Cover Page
The handle
http://hdl.handle.net/1887/36088
holds various files of this Leiden University
dissertation.
Author
: Houwelingen, Anne Henriëtte van
Title
: A proactive approach to complex problems in older people
to complex problems in older people
Department of Public Health and Primary Care, Leiden University Medical Center A.H. van Houwelingen, Leiden, the Netherlands 2015
ISBN: 978-94-6169-658-8
to complex problems in older people
Proefschrift
ter verkrijging van de graad van Doctor aan de Universiteit Leiden, op gezag van Rector Magnificus prof.mr. C.J.J.M. Stolker,
volgens het besluit van het College van Promoties te verdedigen op donderdag 5 november 2015
klokke 11.15 uur
door
Anne Henriëtte van Houwelingen geboren te Middelburg
Promotor: Prof. dr. J. Gussekloo
Co-promotores: Dr. J.W. Blom Dr. W.P.J. den Elzen
Overige leden: Dr. A.J.M. de Craen
Prof. dr. J.P.J. Slaets (Rijksuniversiteit Groningen) Prof. dr. N.J. de Wit (Universiteit Utrecht)
Chapter 1 General introduction 7
Chapter 2 Disability transitions in the oldest old in the general
population. The Leiden 85-plus study
19
Chapter 3 Predictive value of a profile of routine blood measurements
on mortality in older persons in the general population: the Leiden 85-plus study
37
Chapter 4 Consequences of interaction of functional, somatic, mental
and social problems in community-dwelling older people
55
Chapter 5 Measuring complex problems in older people: clinimetric
properties of a postal screening questionnaire
75
Chapter 6 Comparison of three measures to identify older persons with
problems on multiple health domains in primary care
95
Chapter 7 Comparison of quadriceps strength and handgrip strength
in their association with health outcomes in older adults in primary care
111
Chapter 8 Effectiveness and cost-effectiveness of a proactive, goal
oriented, integrated care model in general practice for older people. A cluster randomized controlled trial: Integrated Systematic Care for Older PEople – the ISCOPE study
131
Chapter 9 General discussion 157
Chapter 10 Summary 177
Chapter 11 Samenvatting (Dutch summary) 189
Appendices 201
Appendix 1: ISCOPE screening questionnaire 202
Appendix 2: Additional items suggested by the experts 205
Appendix 3: Framework and content of the training of the intervention group of the ISCOPE study
206
Appendix 4: Format of care plan by the general practitioner for older people with complex problems
208
Appendix 5: Economic evaluation ISCOPE-study 211
Dankwoord 219
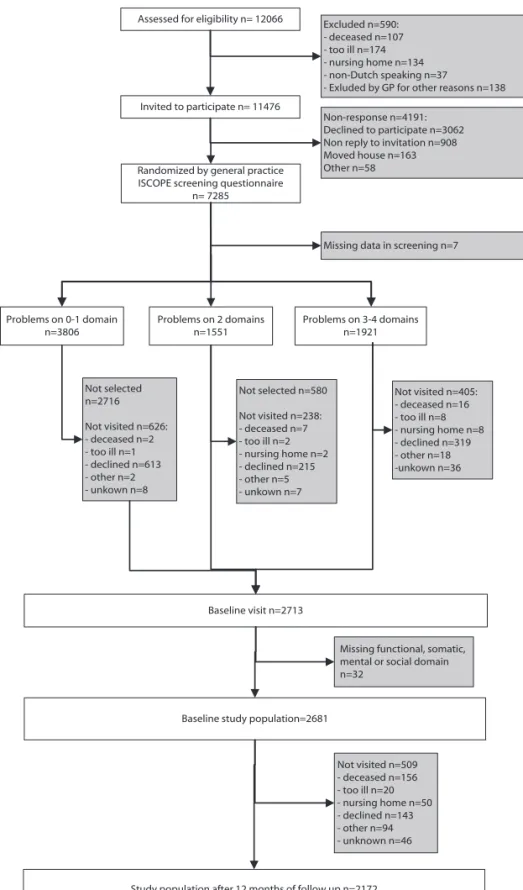
In 2007, the Dutch College of General Practitioners (DCGP) published a statement on future care for older people in general practice1. In 2008 the Dutch government
re-leased the National Programme of Elderly Care (NPEC)2. Both the DCGP and the NPEC
recognised an increasing population of older people with complex problems, for whom health care is poorly coordinated. Both the DCGP and the NPEC introduced proactive integrated care as an answer to poorly coordinated care.
The work presented in this thesis is set within this context of integrated care for older people with complex problems.
This thesis is based on two main research questions:
1) How can older people with complex problems, that might benefit from integrated care, be identified?
2) How effective Is proactive integrated care for older people with complex problems in general practice?
Information on what is already known about these two questions is discussed below.
PROACTIvE IdEnTIfICATIOn Of OldER PEOPlE wITh COMPlEx
PROblEMS
Most older people have multiple (health) problems. For example, about 20-30% of the population aged 70 years and over has a disability3. Additionally, the incidence and
prevalence of chronic disease is much higher among the elderly: most older people have at least one chronic disease (69% of people aged >75 years4) and at least 40%
of older people aged 75 years and over suffer from multimorbidity (i.e. two or more chronic diseases)4. Also, apart from chronic diseases, (minor) ailments, such as memory
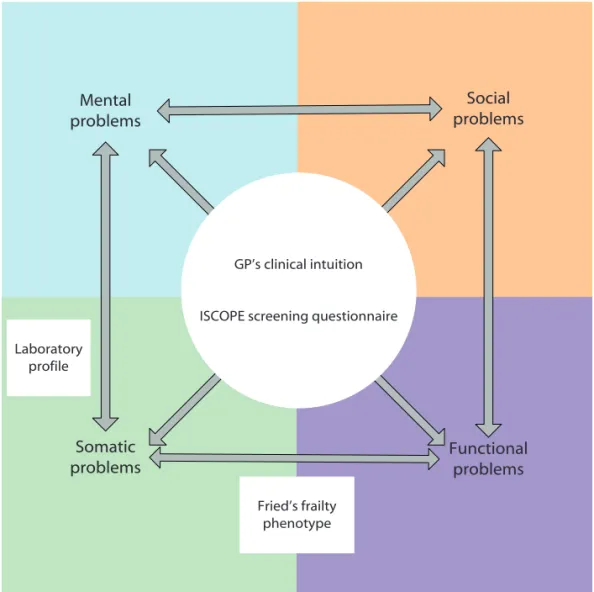
complaints, restricted mobility, falls, vision and hearing problems and incontinence, increase with age. These ailments tend to have a considerable impact on the daily life of older people. In addition, because of a decreasing number of friends and family, various social problems (such as loneliness) can arise. This implies that most older people will probably have multiples of these functional, somatic, mental and/or social problems, which often interact (Figure 1). These multiple interacting problems in older people are covered by the term complex problems.
To provide integrated care, and to test the hypothesis that older people with complex problems might benefit from integrated care, general practitioners (GPs) need to be able to identify this group of older people.
implies: identification of older people at risk for adverse outcomes rather than reacting to an adverse outcome. With this proactive identification, adverse outcomes might be postponed or even prevented.
Functional decline is an adverse outcome that needs to be proactively identified, because functional decline is an important and certainly undesired adverse outcome for most older people. This is because functional decline leads to disability and, most likely, dependency upon others. Of all older groups of people, older people with com-plex problems are considered to be at highest risk for functional decline. Therefore, this group of older people needs to be proactively identified.
We tested five measures to proactively identify older people with complex problems, for their feasibility within general practice. These measures included a profile of laboratory
Somatic
problems Functional problems
Social problems Mental
problems
measurements, handgrip- and quadriceps muscle strength, Fried’s frailty phenotype criteria11, the clinical intuition of the GP, and the ISCOPE screening questionnaire. These
measures are briefly discussed below.
Laboratory parameters are used by GPs to regularly monitor older persons. Many of these parameters, including C-reactive protein (CRP) level5, high homocysteine level6,
low high-density lipoprotein-cholesterol (HDL-C)7, low albumin level8, low alanine
trans-aminase level9, low hemoglobin level10, 11, and poor kidney function (low creatinin
clearance)12, are individually associated with adverse outcomes. An index that combines
these parameters into one profile could be a good measure to identify problems in the somatic domain general practice. Since the somatic domain is one of the domains that determine complex problems (Figure 1), and all these domains interact mutually, somatic problems identified by a laboratory profile might also be an effective measure to identify complex problems.
Sarcopenia is the degenerative loss of skeletal muscle associated with aging13 .
Sar-copenia is thought to play a major role in functional decline14, 15 . Handgrip strength is
often used as a measure for sarcopenia and is associated with several adverse health outcomes16-21, although upper limb muscle strength (measured by quadricpes strength)
might be a better reflection of sarcopenia13. Measurement of muscle strength is not
of-ten used in primary care, but is relatively easy to obtain. Both reduced handgrip- and up-per limb muscle strength could be a good measure to identify problems in the somatic domain of complex problems. Therefore the measurement of muscle strength could be feasible to identify complex problems in general practice.
The Fried’s frailty phenotype is an internationally recognized and validated measure11.
This measure aims to identify frailty in older people. Frailty is a term used to describe a biologic syndrome of decreased reserve and resistance to stressors in older people, resulting from cumulative declines across multiple physiologic systems which increase the risk of adverse outcomes22. The Fried frailty phenotype criteria define frailty as
meet-ing three or more of the followmeet-ing criteria: 1) unintentional weight loss, 2) self-reported exhaustion, 3) slow walking speed, 4) weak grip strength, and 5) low physical activity level22. The Fried frailty phenotype criteria have been widely used in research22 but are
rarely applied in general practice23. It is currently unknown whether the Fried frailty
phenotype criteria can be used as a measure to identify complex problems in general practice. However, since frailty is a concept which describes the interrelation of multiple health domains in older people, the Fried frailty criteria are potentially suitable for the identification of complex problems.
with their patients and are used to relying on a ‘gut feeling’ in their diagnostic process24
the GP’s clinical intuition could be an appropriate measure to identify vulnerability in older people25, 26. However, it is unknown whether this intuition about vulnerability can
be used as an effective measure to identify complex problems.
In addition to these measures which were already available, as a part of this thesis we developed a new measure to identify complex problems in general practice, i.e. a questionnaire with questions covering the four domains of health (functional, somatic, mental and social), known as the ISCOPE screening questionnaire. Based on this ques-tionnaire, older people are considered to have complex problems when they indicate to have problems on three or four of the four domains. Items were partly derived from
Somatic
problems Functional problems
Social problems Mental
problems
Laboratory profile
GP’s clinical intuition
ISCOPE screening questionnaire
Fried’s frailty phenotype
figure 2. Conceptual model of complex problems in older people, the measures to identify complex
existing identification measures, including the Groningen Frailty Indicator (GFI)27 and
the Identification of Seniors At Risk (ISAR) tool28.
The five above-described measures can be classified according to the domains of com-plex problems that they relate to (Figure 2). As only somatic (laboratory) parameters are included in the laboratory profile, it is assumed that they measure primarily somatic problems. Muscle strength is also a somatic parameter and is therefore also assumed to measure somatic problems. In contrast, Fried’s frailty phenotype measures somatic problems (unintentional weight loss, self-reported exhaustion and low physical activity level, weak grip strength) as well as functional problems (slow walking speed). The GP’s intuition is assumed to relate to all these domains, as a holistic vision on their patients is thought to be characteristic for GPs. Finally, the ISCOPE screening questionnaire aims to identify problems in each health domain.
PROACTIvE InTEgRATEd CARE fOR OldER PEOPlE wITh COMPlEx
PROblEMS In gEnERAl PRACTICE
For several reasons, primary care for older persons with complex problems is often not optimal. Firstly, GPs, multiple medical specialists and (informal) caregivers are usually involved with these older persons; unfortunately they each tend to deal with individual problems separately, and none of these professionals has an overview of all the problems of these older persons. This may lead to fragmented care. Secondly, because disease-specific guidelines do not always apply to older people with complex problems4, the
care processes for this group are often not routine or standard.
It has been suggested that to more optimally address these complex problems, GPs, medical specialists and (informal) caregivers should collaborate – this is known as inte-grated care. The DCGP issued a statement (which was based on expert opinions), rec-ommending integrated care for older people in general practice, in particular for older people with complex problems1. In fact, some evidence is available for the effectiveness
of integrated care for older people with complex problems28-30. In line with this, most
GPs are interested to implement integrated care in their practices.
disease is unlikely to fully depict the severity and nature of the accompanying functional consequences.
Specifically, to support this approach, the GP/physician (who has overall responsibil-ity) in close collaboration with the other healthcare workers (e.g. physiotherapist, psy-chologist, etc.) formulates a so-called care plan which combines problems on all health domains (functional, somatic, mental and social). This care plan consists of two steps. The first is an inventory of the existing health problems using five categories or prob-lem areas31: somatic, activities of daily living, social, psychological and communicative
gEnERAl AIMS And OuTlInE Of ThIS ThESIS
The aims of this thesis were:
1. To test five measures on their feasibility to proactively identify older people with complex problems in general practice
2. To investigate the (cost-) effectiveness of a proactive integrated care plan for older persons with complex problems in general practice.
The Integrated Systematic Care for Older PEople (ISCOPE) study was designed and con-ducted to explore whether a proactive approach to complex problems in older people (consisting of proactive identification of older people with complex problems as well as an integrated care plan for older people with complex problems) is applicable for GPs in the Netherlands. Additionally, the ISCOPE study was used to investigate measures to identify older persons with complex problems in general practice. To investigate longi-tudinal identification measures for complex problems we also used the Leiden 85-plus Study, a prospective cohort of 85-year-olds living in Leiden, the Netherlands.
Chapter 2 describes a multistate model to predict disability transitions in the oldest old
in the general population.
Chapter 3 examines the predictive value of a profile of routine blood measurements in
the Leiden 85-plus Study.
Chapter 4 examines the consequences of the interaction of functional, somatic, mental
and social problems in older persons.
Chapter 5 reports on the development, feasibility, internal consistency, construct
valid-ity, test-retest reliability and content validity of the ISCOPE screening questionnaire.
Chapter 6 compares the yield of three measures of complex problems in a cross-sectional
sample of participants of ISCOPE. The comparison involved the Fried frailty phenotype criteria11, clinical intuition of the GP, and the ISCOPE screening questionnaire.
Chapter 7 compares handgrip and quadriceps strength in their association with adverse
health outcomes in older people in general practice.
Chapter 8 presents the results of the ISCOPE randomized trial, which investigates the
effects and costs of a proactive approach in older people with complex problems by general practitioners in the Netherlands.
Chapter 9 is a general discussion of the main results of this thesis. This chapter also
focuses on implications for further research on this topic.
Chapter 10 and Chapter 11 provide a summary of the results of this thesis, in English and
Dutch, respectively.
REfEREnCES
1. NHG-standpunt Toekomstvisie Huisartsenzorg. Huisartsgeneeskunde voor ouderen. NHG, 2007 . 31-5-2007.
2. De Staatssecretaris van Volksgezondheid Welzijn en Sport mw dr J. Bussemaker. Brief aan de Tweede kamer: Multimorbiditeit en ouderenzorg. 12-11-2007.
3. Fried LP, Ferrucci L, Darer J, Williamson JD, Anderson G. Untangling the concepts of disability, frailty, and comorbidity: implications for improved targeting and care. J Gerontol A Biol Sci Med Sci 2004;59(3):255-263.
4. van Weel C, Schellevis FG. Comorbidity and guidelines: conflicting interests. Lancet 2006;367(9510):550-551.
5. Willems JM, Trompet S, Blauw GJ, Westendorp RG, de Craen AJ. White blood cell count and C-reactive protein are independent predictors of mortality in the oldest old. J Gerontol A Biol Sci Med Sci 2010;65(7):764-768.
6. de Ruijter W, Westendorp RG, Assendelft WJ et al. Use of Framingham risk score and new biomark-ers to predict cardiovascular mortality in older people: population based observational cohort study. BMJ 2009;338:a3083.
7. Weverling-Rijnsburger AW, Jonkers IJ, van Exel E, Gussekloo J, Westendorp RG. High-density vs low-density lipoprotein cholesterol as the risk factor for coronary artery disease and stroke in old age. Arch Intern Med 2003;163(13):1549-1554.
8. Schalk BW, Visser M, Bremmer MA, Penninx BW, Bouter LM, Deeg DJ. Change of serum albumin and risk of cardiovascular disease and all-cause mortality: Longitudinal Aging Study Amsterdam. Am J Epidemiol 2006;164(10):969-977.
9. Ford I, Mooijaart SP, Lloyd S et al. The inverse relationship between alanine aminotransferase in the normal range and adverse cardiovascular and non-cardiovascular outcomes. Int J Epidemiol 2011;40(6):1530-1538.
10. Culleton BF, Manns BJ, Zhang J, Tonelli M, Klarenbach S, Hemmelgarn BR. Impact of anemia on hospitalization and mortality in older adults. Blood 2006;107(10):3841-3846.
11. den Elzen WP, Willems JM, Westendorp RG, de Craen AJ, Assendelft WJ, Gussekloo J. Effect of anemia and comorbidity on functional status and mortality in old age: results from the Leiden 85-plus Study. CMAJ 2009;181(3-4):151-157.
12. van Bemmel T, Woittiez K, Blauw GJ et al. Prospective study of the effect of blood pressure on renal function in old age: the Leiden 85-Plus Study. J Am Soc Nephrol 2006;17(9):2561-2566. 13. Cruz-Jentoft AJ, Baeyens JP, Bauer JM et al. Sarcopenia: European consensus on definition and
diagnosis: Report of the European Working Group on Sarcopenia in Older People. Age Ageing 2010;39(4):412-423.
14. Morley JE, Baumgartner RN, Roubenoff R, Mayer J, Nair KS. Sarcopenia. J Lab Clin Med 2001;137(4):231-243.
15. Rolland Y, Czerwinski S, Abellan Van KG et al. Sarcopenia: its assessment, etiology, pathogenesis, consequences and future perspectives. J Nutr Health Aging 2008;12(7):433-450.
16. Femia EE, Zarit SH, Johansson B. Predicting change in activities of daily living: a longitudinal study of the oldest old in Sweden. J Gerontol B Psychol Sci Soc Sci 1997;52(6):294-302.
18. Hairi NN, Cumming RG, Naganathan V et al. Loss of muscle strength, mass (sarcopenia), and quality (specific force) and its relationship with functional limitation and physical disability: the Concord Health and Ageing in Men Project. J Am Geriatr Soc 2010;58(11):2055-2062.
19. Rantanen T, Volpato S, Ferrucci L, Heikkinen E, Fried LP, Guralnik JM. Handgrip strength and cause-specific and total mortality in older disabled women: exploring the mechanism. J Am Geriatr Soc 2003;51(5):636-641.
20. Laukkanen P, Heikkinen E, Kauppinen M. Muscle strength and mobility as predictors of survival in 75-84-year-old people. Age Ageing 1995;24(6):468-473.
21. Newman AB, Kupelian V, Visser M et al. Strength, but not muscle mass, is associated with mor-tality in the health, aging and body composition study cohort. J Gerontol A Biol Sci Med Sci 2006;61(1):72-77.
22. Fried LP, Tangen CM, Walston J et al. Frailty in older adults: evidence for a phenotype. J Gerontol A Biol Sci Med Sci 2001;56(3):M146-M156.
23. Drey M, Wehr H, Wehr G et al. The frailty syndrome in general practitioner care: a pilot study. Z Gerontol Geriatr 2011;44(1):48-54.
24. Stolper E, Van de Wiel M, Van Royen P, Van de Wiel M, Van der Weijden T, Dinant GJ. Gut feelings as a third track in general practitioners’ diagnostic reasoning. J Gen Intern Med 2011;26(2):197-203. 25. Drewes YM, Koenen JM, de Ruijter W et al. GPs’ perspectives on preventive care for older people:
a focus group study. Br J Gen Pract 2012;62(604):765-772.
26. Grant RW, Ashburner JM, Hong CC, Chang Y, Barry MJ, Atlas SJ. Defining Patient Complexity From the Primary Care Physician’s Perspective A Cohort Study. Ann of Intern Med 2011;155(12):797-804.
27. Peters LL, Boter H, Buskens E, Slaets JP. Measurement Properties of the Groningen Frailty Indicator in Home-Dwelling and Institutionalized Elderly People. J Am Med Dir Assoc 2012;13(6):546-551. 28. Salvi F, Morichi V, Grilli A et al. Predictive validity of the Identification of Seniors At Risk (ISAR)
screening tool in elderly patients presenting to two Italian Emergency Departments. Aging Clin Exp Res 2009;21(1):69-75.
29. Beswick AD, Rees K, Dieppe P et al. Complex interventions to improve physical function and maintain independent living in elderly people: a systematic review and meta-analysis. Lancet 2008; 371 (9614):725-735.
30. Lin JS, Whitlock EP, Eckstrom E et al. Challenges in synthesizing and interpreting the evidence from a systematic review of multifactorial interventions to prevent functional decline in older adults. J Am Geriatr Soc 2012;60(11):2157-2166.
Susan Kurrle, Anton J.M. de Craen, Andrea B. Maier, Wendy P.J. den Elzen, and Jeanet W. Blom
AbSTRACT
Transitions between disability states in older people occur frequently. This study in-vestigated predictors of disability transitions in the oldest old and was performed in the Leiden 85-plus Study, a population-based prospective cohort study among 597 participants aged 85 years.
At baseline (age 85 years), data on socio-demographic characteristics and chronic dis-eases were obtained. Disabilities in basic activities of daily living (BADL) and instrumen-tal activities of daily living (IADL) were measured annually for 5 years with the Groningen Activities Restriction Scale (GARS). Mortality data were obtained. A statistical multi-state model was used to assess the risks of transitions between no disabilities, IADL disability, BADL disability and death.
At baseline, 299 participants (50.0%) were disabled in IADL only and 155 participants (26.0%) were disabled in both BADL and IADL. During 5-year follow-up, 374 participants (62.6%) made > 1 transition between disability states, mostly deterioration in disability. Males had a lower risk of deterioration (Hazard ratio [HR] 0.75 [95% CI 0.58-0.96]) com-pared to females. No gender differences were observed for improvement (HR 0.64 [95% CI 0.37-1.11]), Participants with depressive symptoms were less likely to improve (HR 0.50 [95%CI 0.28-0.87]). Participants with depressive symptoms (HR 1.46 [95% CI 1.12-1.91]), > 1 chronic disease (HR 1.60 [95% CI 1.27-2.01), and with cognitive impairment (HR 1.60 [95% CI 1.20-2.13] had the highest risk of deteriorating.
Disability is a dynamic process in the oldest old. Deterioration is more common than improvement. Older men are less likely to deteriorate than women. The presence of depressive symptoms, chronic disease and cognitive impairment predicts deterioration.
AbbREvIATIOnS
IADL: Instrumental Activities of Daily Living BADL: Basic Activities of Daily living
COPD: Chronic obstructive pulmonary disease ATC: Anatomic Therapeutic Chemical
MMSE: Mental State Examination
InTROduCTIOn
Disability in older people is associated with dependency, morbidity, and shorter life expectancy1,2. As the population in the Western world is ageing3,4, the number of older
people facing disability will increase in the coming decades. This increasing prevalence of disability will be accompanied by rising healthcare costs, since care for disabled per-sons is more costly than care for non-disabled perper-sons5,6. Therefore, disability becomes
increasingly important for older people, their caregivers, and policymakers.
New preventive strategies directed at disability could diminish the burden of dis-ability. When considering the introduction of new strategies, it is important to know which subgroup of older people are candidates for prevention of disability. Previous re-search has shown that sex7, level of education8, cognitive decline9, 10, physical frailty11, 12,
chronic disease10, 13, prior disability history14, and depressive symptoms13, 15 contribute to
changes in disability.
Several studies7, 11, 12, 16-18 including the Precipitating Events Project19 found that
dis-ability is not a static state, but has a dynamic nature, which means that people can move in and out of disability, with continuous transitions between states of disability. How-ever, most studies focused on transitions in disability in basic activities of daily living (BADL) in older individuals without disability. Less attention has been paid to transitions between disability in BADL and disability in instrumental activities of daily living (IADL) in older people in the general population7, 16. Moreover, most studies tended to focus
on younger elderly, so that data on disability in individuals aged ≥ 85 years are scarce20.
This study investigates the transitions between no disability in BADL and IADL, and IADL disability, BADL disability and death, and determines predictors of these transi-tions in disability states in the oldest old in the general population.
METhOdS
Study population
This study was conducted within the Leiden 85-plus Study, an observational population-based prospective cohort study of 85-year old inhabitants of Leiden, the Netherlands. Between 1997 and 1999, 705 inhabitants of Leiden reached the age of 85 years and were eligible for participation. Of these, 14 died before enrolment and 92 refused to participate, resulting in a study population of 599 participants (response rate 87%). No selection criteria for health and demographic characteristics were applied21.
information on income, education and disabilities in BADL and IADL was obtained. For the present study, participants with missing BADL and IADL measurements at baseline were excluded (n=2) resulting in a study population of 597 participants. All participants gave informed consent; for participants with severe cognitive impairment, informed consent was obtained from a proxy. The Medical Ethics Committee of Leiden University Medical Centre approved the study.
Study parameters
Predictors
Sociodemographic factors
During baseline interviews, a research nurse collected information on sex, residency, income, and level of education.
Presence of chronic diseases
Information on participants’ medical history was obtained by standardized interviews with their treating general practitioner or elderly care physician, and/or pharmacy records. We obtained clinical information on the presence of diabetes mellitus, chronic obstructive pulmonary disease (COPD), Parkinson’s disease, history of stroke and myo-cardial infarction, cancer, arthritis and hip fracture. COPD was considered present when the diagnosis COPD was reported by the treating physician or when lung medication (Anatomic Therapeutic chemical [ATC] code R03) was used at age 85 years. The presence of diabetes mellitus was based on the diagnosis of the treating physician, a non-fasting glucose level >200 mg/dL, or the use of anti-diabetic medication.
Cognitive function
Cognitive function was measured with the Mini-Mental State Examination (MMSE) with scores ranging from 0 to 3022. Cognitive impairment was considered present when the
MMSE score was below 24 points.
Depressive symptoms
The 15-item geriatric depression scale (GDS-15) was used as a screening instrument for depression23. As the validity and the reliability of the GDS-15 may be reduced in
Outcome
Functional status
Disability in BADL and IADL was measured annually with the Groningen Activities Restriction Scale (GARS)25. The GARS is a questionnaire that assesses disabilities in
competence in nine BADL items and nine IADL items. The GARS is extensively validated in various study populations and has satisfactory clinimetric properties; the test-retest reliability of the GARS-3 was 0.7126.
The BADL items included: walk inside the house, get up and out of bed, get in and out of a chair, visit the toilet, wash hands and face, wash body, dress and undress, eat and drink, and prepare breakfast27. The IADL items included: light housework, heavy
clean-ing, wash and iron clothes, clean and make the bed, prepare a hot meal, climbing/de-scending stairs, get around outdoors, do the groceries, and attend to feet and toenails27.
Questions were phrased ‘Can you fully independently…?’ We dichotomized the answers into a score of 0 (cannot or only with help from others) or 1 (yes fully independently, with or without difficulty). Disability in BADL or IADL was considered present when a participant responded ‘Cannot or only with help from others’ on any BADL or IADL item, respectively. The dichotomizing of BADL en IADL was done because no universal cut-off points of the GARS are known.
Mortality
Dates of death were obtained from municipal registries.
Statistical analysis
Descriptive statistics
Baseline characteristics and the prevalence of IADL and BADL disability at baseline and during follow-up are presented as number (percentage).
Multi-state model
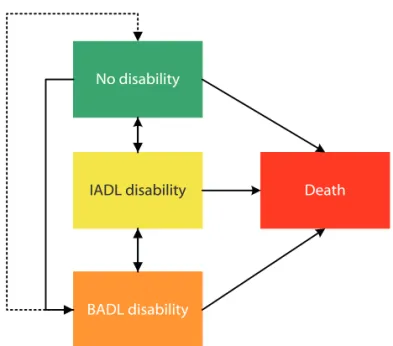
Multi-state analysis was used to assess the participants’ risk for making transitions between states of disability. Our multi-state representation of disability included four states: 1) no disability in either BADL or IADL; 2) disability in IADL; 3) disability in both BADL and IADL, and 4) death (Figure 1). Death was included as a competing risk in this model. Since the transition between BADL disability and no disability was observed very rarely, we did not include this transition in the multi-state model.
Transition hazards were first estimated without the inclusion of covariates, then also with the inclusion of covariates. The Aalen-Johansen estimator28 was used to obtain
haz-ards of all transitions going into the “death” state were assumed to be proportional29,
thus allowing the estimation of hazard ratios of IADL and BADL disability on mortality, compared to having no disability. Estimating covariate effects for all transitions sepa-rately would yield too unstable estimates because of rare events for some transitions. Therefore, we hypothesized that the effect of a covariate would be similar in the transi-tion from no disability to IADL disability and from IADL disability to BADL disability, since both these transitions represent deterioration in disability state. Similarly, we assumed that the effect of covariates would be similar in the transition from IADL disability to no disability and from BADL disability to IADL disability, since these transitions represent an improvement in disability state. Moreover, the effect of covariates was also assumed to be the same for transitions from no disability to death, and from IADL disability or BADL disability to death. Therefore, we used a simplified model with deteriorating transitions, improving transitions, and transitions to death. Preliminary analyses showed that this simplification did not result in a model with worse fit.
To study the effect of sex, living situation, income, educational level, presence of chronic disease, cognitive impairment and depressive symptoms on transitions between disability states, we used these predictors as covariates in the simplified model. Sex, income, education level, living alone and presence of chronic diseases were included as fixed variables. In the model, cognitive function and depressive symptoms were included as time-dependent variables (i.e. each yearly measurement was included in the model)
No disability
Death IADL disability
BADL disability
figure 1. Multi-state representation of the stages of disability. The boxes represent the four stages. The
solid arrows represent the observed transitions; the dotted arrow represents a possible transition that was
Descriptive statistics were computed using PASW 17.0 for Windows. The package mstate30 version 0.2.5, for R version 2.12.031 was used for the multi-state analysis. A
p-value of <0.05 was considered statistically significant.
RESulTS
Study population
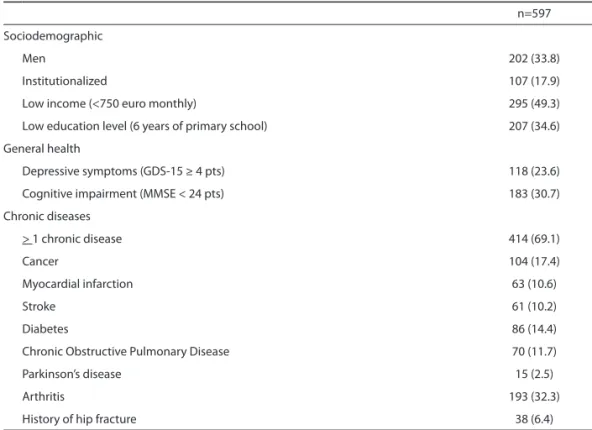
Table 1 presents the baseline characteristics of the study population at age 85 years. One third of the population was male and 18% was living in a long-term care facility. Of all participants, 118 (23.6 %) had depressive symptoms, 183 (30.7%) had cognitive impairment (of which 58 had a clinical diagnosis of dementia by their GP) and almost 70% had at least one chronic disease. At the end of follow-up, 277 participants aged 90 years were interviewed. During the 5-year follow-up period, 41 participants refused further participation and 279 participants died.
Table 1. Baseline characteristics of the participants at age 85 years.
n=597
Sociodemographic
Men 202 (33.8)
Institutionalized 107 (17.9)
Low income (<750 euro monthly) 295 (49.3)
Low education level (6 years of primary school) 207 (34.6)
General health
Depressive symptoms (GDS-15 ≥ 4 pts) 118 (23.6)
Cognitive impairment (MMSE < 24 pts) 183 (30.7)
Chronic diseases
> 1 chronic disease 414 (69.1)
Cancer 104 (17.4)
Myocardial infarction 63 (10.6)
Stroke 61 (10.2)
Diabetes 86 (14.4)
Chronic Obstructive Pulmonary Disease 70 (11.7)
Parkinson’s disease 15 (2.5)
Arthritis 193 (32.3)
History of hip fracture 38 (6.4)
Data are numbers and percentages
Prevalence of disability
At age 85 years, 143 participants (24%) had no disability in IADL and BADL, 299 par-ticipants (50%) had IADL disability only, and 155 parpar-ticipants (26%) had BADL disability. Participants with IADL disability most often reported being unable to do heavy house-hold activities compared with their counterparts with IADL disability only. Being unable to wash and dry the whole body was the most frequently reported BADL item for this group (appendix table 3). The prevalence of BADL disability increased with age to 58% at age 90 years. The prevalence of IADL disability and the prevalence of no disability decreased during follow-up to 35% and 6%, respectively, at age 90 years (Figure 2). As expected, at each year, all participants with BADL disability also had IADL disability, showing the hierarchical relationship between the two forms of disability.
Age
85 86 87 88 89 90
0 50 100
No disability IADL disability BADL disability Death
Age
85 86 87 88 89 90
0 50
100 No disability
IADL disability BADL disability Death
Age
85 86 87 88 89 90
0 50
100 No disability
IADL disability BADL disability Death A
B
C
figure 2. Estimated transition probabilities of the three states of disability and death during follow-up
disability states during follow-up
Of the 277 participants (46.4%) who were alive at 5-years follow-up, 205 (41.2%) made one or more transitions between disability states and 72 (12.0%) were stable in their baseline disability state. Of these 72 participants, five (0.8%) remained free of disability during follow-up, 37 (6.2%) had stable IADL disability, and 30 (5.0%) had stable BADL disability. Of the 277 participants who were alive at 5 year follow-up, 83 (30%) had no disability at baseline, 150 (54.2%) had IADL-disability and 44 (15.9%) had BADL-disability at baseline.
Of the 279 participants who died during follow-up (53.4%), 110 (18.4%) were stable in their baseline disability state and 169 participants (28.3%) had made one or more transitions between disability states before death.
In total, 374 participants (69.5%) made one or more transitions between disability states and 182 (30.5%) were stable in their baseline disability state until death or until they reached the age of 90 years. The 374 participants who made one or more transi-tions between disability states made 579 transitransi-tions in total (i.e. mean 1.6 transitransi-tions per participant); most of these transitions were directed at deteriorating disability (513 deteriorating transitions and 66 improving transitions). Of these 374 participants, 83 (13.9%) improved in disability state at some time during follow-up, 29 (4.9%) improved from IADL disability to no disability state, and 54 participants (9.0%) improved from BADL disability to IADL disability. The remaining 291 participants made transitions directed at greater disability only.
Transitions between states
The relative risk for participants with IADL disability to deteriorate to BADL disability was HR 6.21 (95% CI 3.35-11.35), compared to participants with no disability to deteriorate to BADL disability. Moreover, an increase in disability was associated with an increased risk of death. The relative mortality risk for participants with IADL disability was HR 1.44 [95% CI 0.97-2.63] and for participants with BADL disability was HR 4.20 [95% CI 2.31-7.53], both compared to participants with no disability at any time during follow-up.
Predictors of transitions
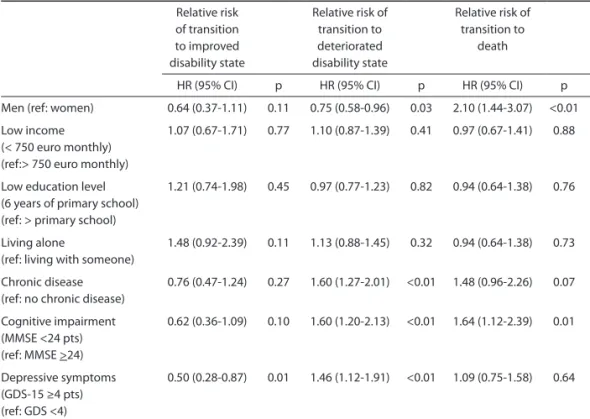
[95% CI 0.28-0.87], p=0.01), and a higher risk of transition to a deteriorated disability state (HR 1.46 [1.12-1.91], p <0.01) compared to participants without depressive symp-toms. Participants with and without depressive symptoms had similar mortality rates. Chronic disease and cognitive impairment (MMSE score <24) were associated with a higher risk of deteriorating in disability state (HR 1.60 [95% CI 1.27-2.01] and HR 1.60 [95% CI 1.20-2.13], respectively, p<0.01) and a higher death rate (HR 1.48 [95% CI 0.96-2.26] p=0.07 and HR 1.64 [1.12-2.39 p=0.01), but were not associated with an increased or decreased risk for improvement in disability state.
Table 2. Multi-variate prediction of improvement in disability state, deterioration in disability state and
death by health characteristics over the 5-year follow-up.
Relative risk
of transition to improved disability state
Relative risk of transition to deteriorated disability state
Relative risk of transition to
death
HR (95% CI) p HR (95% CI) p HR (95% CI) p
Men (ref: women) 0.64 (0.37-1.11) 0.11 0.75 (0.58-0.96) 0.03 2.10 (1.44-3.07) <0.01 Low income
(< 750 euro monthly) (ref:> 750 euro monthly)
1.07 (0.67-1.71) 0.77 1.10 (0.87-1.39) 0.41 0.97 (0.67-1.41) 0.88
Low education level (6 years of primary school) (ref: > primary school)
1.21 (0.74-1.98) 0.45 0.97 (0.77-1.23) 0.82 0.94 (0.64-1.38) 0.76
Living alone
(ref: living with someone)
1.48 (0.92-2.39) 0.11 1.13 (0.88-1.45) 0.32 0.94 (0.64-1.38) 0.73
Chronic disease (ref: no chronic disease)
0.76 (0.47-1.24) 0.27 1.60 (1.27-2.01) <0.01 1.48 (0.96-2.26) 0.07
Cognitive impairment (MMSE <24 pts) (ref: MMSE >24)
0.62 (0.36-1.09) 0.10 1.60 (1.20-2.13) <0.01 1.64 (1.12-2.39) 0.01
Depressive symptoms (GDS-15 ≥4 pts) (ref: GDS <4)
0.50 (0.28-0.87) 0.01 1.46 (1.12-1.91) <0.01 1.09 (0.75-1.58) 0.64
CI= confidence interval; GDS-15= Geriatric Depression Scale 15 items; MMSE = Mini-Mental state Examination; HR=Hazard ratio
Hazard ratios were estimated with a multistate Cox model. Sex, income, education level, living alone and presence of chronic diseases were included as fixed variables. Cognitive function and depressive symptoms were included as timede-pendent variables
dISCuSSIOn
The present study shows that, among the oldest old in the general population, disability in BADL and IADL is a dynamic process with frequent transitions between disability states. In this study, the most important predictors for transition from no disability to both IADL and BADL disability states were the presence of depressive symptoms, chronic disease and cognitive impairment. Men had a higher mortality rate compared to women, but were more stable with respect to their disability state. Whilst transitions to greater disability and death were much more common than improvements in disability, a small number of very old persons do improve in disability status. Recovery from any acute pathological condition or injury could partly explain this. An intriguing result of this study is that the proportion of older people without any disability that shows some functional decline between age 85 and age 86 is almost 80% (similarly from age 86 to age 87). This may be explained by the fact that people of this advanced age are known to decline in function very rapidly32.
Our results in persons aged ≥ 85 years confirm those of other studies on transitions between disability states7, 11, 12, 16-18, 33. However, unlike other studies which presented
high recovery rates7, 8, 11, 12, 16, 18, our study participants infrequently recovered from
disability. Three of these previous studies were performed in the same study popula-tion11, 12, 18 of the Precipitating Events Project19. Of the other three, one was restricted
to moderately and severely disabled women8, and one to disabled patients aged 65
years and older registered for home services7. Only the population-based study by Peres
and colleagues and the study of Mor en colleagues are comparable with the present study16, 33. In these studies, similar results were found for people of old age (80 years and
over). The infrequent recovery in our study might thus be explained by the old age of our study population.
Moreover since IADL disability is highly prevalent among the very elderly27, it is less
likely that the oldest old fully recover to a non-disabled state. Therefore, the transition from BADL disability to no disability was too uncommon to include in the multistate model. In contrast to the abovementioned studies, we had yearly intervals between disability assessments.
Our predictors of transitions in disability state are generally in line with others, who also found that males are more stable with respect to their disability state than females. This has been described as the health-survival paradox in the very old: i.e. men seem to be healthier than women but die earlier34. The biological mechanism underlying this
paradox has yet to be unravelled.
de-teriorating in disability state, and had a lower chance of improvement. This is consistent with others15, 36 and provides evidence that recognition and treatment of depressive
symptoms in the oldest old could lead to a reduction of the burden of disability. The aim of our study was to investigate predictors of disability status in the general population at large. Our study population therefore also included persons living in care homes or nursing homes. Since persons living in these institutions are not likely to im-prove in disability status, and may often have an increased risk of depression37,
comor-bidity and cognitive impairment, this may have resulted in an underestimation of the predictive value of depression, comorbidity and cognitive impairment on the change in disability status for community-dwelling elderly.
Since this study assesses the predictive value of the determinants on disability changes, the results should not be etiologically interpreted. For example: the predictive value of depression on disability has been extensively studied, but a causal relationship has not been identified yet38.
The results of our study are important for several reasons. First, people aged ≥ 85 years are the fastest growing segment of the general population, and data on disability in this population are limited20. This age group is often excluded from clinical trials and
preventive interventions, and is sometimes undertreated39-41. Therefore, the results
of this study in this specific population provide valuable information to help develop preventive strategies directed towards disability in this age group. Second, the results could also have implications for geriatric rehabilitation programs.
Strengths and limitations
Our study has several strengths. The Leiden 85-plus Study is a longitudinal population-based cohort study with no exclusion criteria and almost complete follow-up for mortality. A total of 87% of the oldest old in the population participated in this study. This high participation rate adds to the external validity of our results. Moreover, the longitudinal design with repeated measurements of competence in IADL and BADL al-lowed us to demonstrate the dynamic process of disability in this unique sample of very old participants. Another strength of our study is that we included both IADL and BADL disability and the transitions between these disability states, healthy, and death. In ad-dition, the use of a multi-state model allowed us to include more than one transition per participant, and allowed inclusion of death as a competing risk and separate outcome.
variables. Moreover, since the multistate model will be unstable when too many predic-tors are added, we added a predictor which was based on a score of all chronic diseases.
COnCluSIOn
REfEREnCES
1. Cigolle CT, Langa KM, Kabeto MU, Tian Z, Blaum CS. Geriatric conditions and disability: the Health and Retirement Study. Ann Intern Med 2007;147(3):156-164.
2. Manton KG, Gu X, Lowrimore GR. Cohort changes in active life expectancy in the U.S. elderly population: experience from the 1982-2004 National Long-Term Care Survey. J Gerontol B Psy-chol Sci Soc Sci 2008;63(5):S269-S281.
3. Christensen K, Doblhammer G, Rau R, Vaupel JW. Ageing populations: the challenges ahead. Lancet 2009;374(9696):1196-1208.
4. Lutz W, Sanderson W, Scherbov S. The coming acceleration of global population ageing. Nature 2008;451(7179):716-719.
5. Guralnik JM, Alecxih L, Branch LG, Wiener JM. Medical and long-term care costs when older persons become more dependent. Am J Public Health 2002;92(8):1244-1245.
6. Harrow BS, Tennstedt SL, McKinlay JB. How costly is it to care for disabled elders in a community setting? Gerontologist 1995;35(6):803-813.
7. Nikolova R, Demers L, Beland F, Giroux F. Transitions in the functional status of disabled commu-nity-living older adults over a 3-year follow-up period. Arch Gerontol Geriatr 2011;52(1):12-17. 8. Boyd CM, Ricks M, Fried LP et al. Functional decline and recovery of activities of daily living in
hospitalized, disabled older women: the Women’s Health and Aging Study I. J Am Geriatr Soc 2009;57(10):1757-1766.
9. Tas U, Verhagen AP, Bierma-Zeinstra SM, Odding E, Koes BW. Prognostic factors of disability in older people: a systematic review. Br J Gen Pract 2007;57(537):319-323.
10. Drewes YM, den Elzen WP, Mooijaart SP, De Craen AJ, Assendelft WJ, Gussekloo J. The effect of cognitive impairment on the predictive value of multimorbidity for the increase in disability in the oldest old: the Leiden 85-plus Study. Age Ageing 2011;40(3):352-357.
11. Hardy SE, Dubin JA, Holford TR, Gill TM. Transitions between states of disability and independence among older persons. Am J Epidemiol 2005;161(6):575-584.
12. Hardy SE, Gill TM. Factors associated with recovery of independence among newly disabled older persons. Arch Intern Med 2005;165(1):106-112.
13. Stuck AE, Walthert JM, Nikolaus T, Bula CJ, Hohmann C, Beck JC. Risk factors for functional status decline in community-living elderly people: a systematic literature review. Soc Sci Med 1999;48(4):445-469.
14. Hardy SE, Allore HG, Guo Z, Dubin JA, Gill TM. The effect of prior disability history on subsequent functional transitions. J Gerontol A Biol Sci Med Sci 2006;61(3):272-277.
15. Barry LC, Allore HG, Bruce ML, Gill TM. Longitudinal association between depressive symptoms and disability burden among older persons. J Gerontol A Biol Sci Med Sci 2009;64(12):1325-1332. 16. Peres K, Verret C, Alioum A, Barberger-Gateau P. The disablement process: factors associated with progression of disability and recovery in French elderly people. Disabil Rehabil 2005;27(5):263-276.
17. Gill TM, Allore HG, Gahbauer EA, Murphy TE. Change in disability after hospitalization or restricted activity in older persons. JAMA 2010;304(17):1919-1928.
18. Hardy SE, Gill TM. Recovery from disability among community-dwelling older persons. JAMA 2004;291(13):1596-1602.
20. Vaupel JW. Biodemography of human ageing. Nature 2010;464(7288):536-542.
21. Bootsma-van der Wiel A, Van Exel E, De Craen AJ et al. A high response is not essential to prevent selection bias: results from the Leiden 85-plus study. J Clin Epidemiol 2002;55(11):1119-1125. 22. Heeren TJ, Lagaay AM, von Beek WC, Rooymans HG, Hijmans W. Reference values for the
Mini-Mental State Examination (MMSE) in octo- and nonagenarians. J Am Geriatr Soc 1990;38(10):1093-1096.
23. Sheikh J, Yesavage J. Geriatric Depression Scale (GDS): Recent evidence and development of a shorter version. In: Brink T, editor. Clinical Gerontology: A guide to assessment and Intervention. New York: The Haworth Press; 1986:165-173.
24. De Craen AJ, Heeren TJ, Gussekloo J. Accuracy of the 15-item geriatric depression scale (GDS-15) in a community sample of the oldest old. Int J Geriatr Psychiatry 2003;18(1):63-66.
25. Kempen GI, Miedema I, Ormel J, Molenaar W. The assessment of disability with the Groningen Activity Restriction Scale. Conceptual framework and psychometric properties. Soc Sci Med 1996;43(11):1601-1610.
26. Kempen G, Doeglas T, Suurmeijer. Groningen Activities Restriction Scale (GARS): een handleiding. 2 ed. Groningen: UMCG/Rijksuniversiteit Groningen, Research institute SHARE; 2012.
27. Bootsma-van der Wiel A, Gussekloo J, De Craen AJ et al. Disability in the oldest old: “can do” or “do do”? J Am Geriatr Soc 2001;49(7):909-914.
28. Aalen OO, Johansen S. Empirical Transition Matrix for Nonhomogeneous Markov-Chains Based on Censored Observations. Scandinavian Journal of Statistics 1978;5(3):141-150.
29. Putter H, Fiocco M, Geskus RB. Tutorial in biostatistics: competing risks and multi-state models. Stat Med 2007;26(11):2389-2430.
30. de Wreede LC, Fiocco M, Putter H. The mstate package for estimation and prediction in non- and semi-parametric multi-state and competing risks models. Comput Methods Programs Biomed 2010;99(3):261-274.
31. R Development Core Team. A language and environment for Statistical Computing. Vienna, Austria: 2006.
32. McCusker J, Kakuma R, Abrahamowicz M. Predictors of functional decline in hospitalized elderly patients: a systematic review. J Gerontol A Biol Sci Med Sci 2002;57(9):M569-M577.
33. Mor V, Wilcox V, Rakowski W, Hiris J. Functional transitions among the elderly: patterns, predictors, and related hospital use. Am J Public Health 1994;84(8):1274-1280.
34. Oksuzyan A, Juel K, Vaupel JW, Christensen K. Men: good health and high mortality. Sex differ-ences in health and aging. Aging Clin Exp Res 2008;20(2):91-102.
35. Bootsma-van der Wiel A, Gussekloo J, De Craen AJ, Van Exel E, Bloem BR, Westendorp RG. Com-mon chronic diseases and general impairments as determinants of walking disability in the oldest-old population. J Am Geriatr Soc 2002;50(8):1405-1410.
36. Wang L, van BG, Kukull WB, Larson EB. Predictors of functional change: a longitudinal study of nondemented people aged 65 and older. J Am Geriatr Soc 2002;50(9):1525-1534.
37. Boorsma M, Joling K, Dussel M et al. The incidence of depression and its risk factors in Dutch nursing homes and residential care homes. The American journal of geriatric psychiatry : official journal of the American Association for Geriatric Psychiatry 2012;20(11):932-942.
38. Barry LC, Soulos PR, Murphy TE, Kasl SV, Gill TM. Association between indicators of disabil-ity burden and subsequent depression among older persons. J Gerontol A Biol Sci Med Sci 2013;68(3):286-292.
40. de Boer MJ, Ottervanger JP, Suryapranata H et al. Old age and outcome after primary angioplasty for acute myocardial infarction. J Am Geriatr Soc 2010;58(5):867-872.
Appendix table 3. The prevalence of disability on the individual BADL- and IADL items of the GARS at age 85 (n=597)
Item
total population no disability IADL-disability* BADL-disability*
n=597 n=143 n=299 n=155
BADL: unable to
1. dress yourself 103 (17.3) 0 0 103 (66.5)
2. get in and out of bed 53 (8.9) 0 0 53 (34.2)
3. stand up from sitting in a chair 53 (8.9) 0. 0 53 (54.2)
4. wash face and hands 45 (7.5) 0 0 45 (29.0)
5. wash and dry whole body 124 (20.8) 0 0 124 (80.0)
6. go to the toilet 60 (10.1) 0 0 60 (38.7)
7. eat and drink 21 (3.5) 0 0 21 (13.5)
8. get around in the house 67 (11.2) 0 0 67 (43.2)
12. prepare breakfast 64 (10.7) 0 0 64 (41.3)
IADL: unable to
9. go up and down the stairs 225 (37.7) 0 89 (29.8) 136 (87.7)
10. walk outdoors 171 (28.6) 0 50 (16.7) 121 (78.1)
11. take care of your feet and toenails 340 (57.0) 0 195 (65.2) 145 (93.5)
13. prepare dinner 209 (35.0) 0 80 (26.8) 129 (83.2)
14. light household activities 127 (21.3) 0 28 (9.4) 99 (63.9) 15. heavy household activities 350 (58.6) 0 200 (66.9) 150 (96.8)
16. wash and iron clothes 223 (37.4) 0 94 (31.4) 129 (83.2)
17. make the beds 207 (34.7) 0 80 (26.8) 127 (81.9)
18. groceries 231 (38.7) 0 105 (35.1) 126 (81.3)
Data represent numbers (%)
Anne H. van Houwelingen, Wendy P.J. den Elzen, Simon P. Mooijaart, Margot Heijmans, Jeanet W. Blom, Anton J.M. de Craen and Jacobijn Gussekloo
AbSTRACT
background
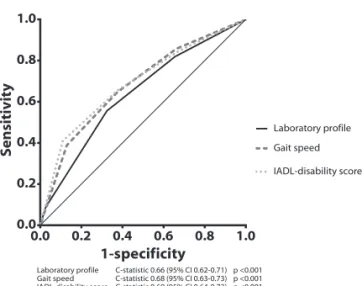
Various questionnaires and performance tests predict mortality in older people. How-ever, most are heterogeneous, laborious and a validated consensus index is not available yet. Since most older people are regularly monitored by laboratory tests, we compared the predictive value of a profile of seven routine laboratory measurements on mortality in older persons in the general population with other predictors of mortality; gait speed and disability in instrumental activities of daily living (IADL).
Methods and findings
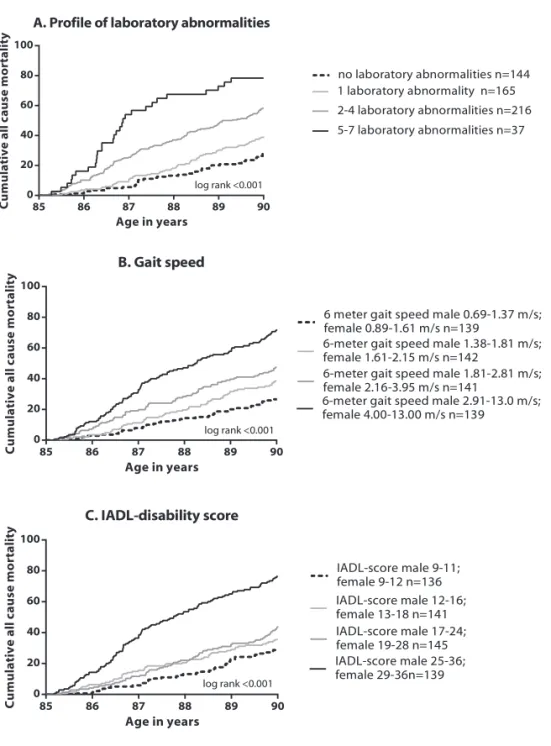
Within the Leiden 85-plus Study, a prospective population-based study, we followed 562 participants aged 85 years for mortality over five years. At baseline (age 85 years) high-density lipoprotein cholesterol, albumin, alanine transaminase, hemoglobin, creatinin clearance, C-reactive protein and homocysteine were measured. Participants were stratified based on their number of laboratory abnormalities (0, 1, 2-4 and 5-7). The predictive capacity was compared with gait speed (6-meter walking test) and disability in IADL (Groningen Activity Restriction Scale) by C-statistics.
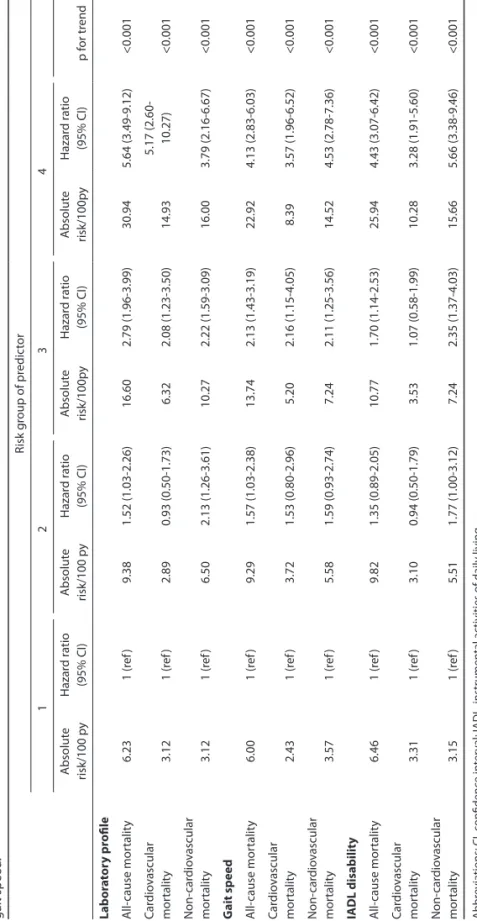
At baseline, 418 (74%) 85-year old participants had at least one laboratory abnormality. All-cause mortality risk increased with increasing number of laboratory abnormalities to a hazard ratio of 5.64 [95% CI 3.49-9.12] for those with 5-7 laboratory abnormalities (p<0.001) compared to those without abnormalities. The c-statistic was 0.66 [95% CI 0.59-0.69], similar to that of gait speed and disability in IADL.
Conclusions
InTROduCTIOn
Prognostic information about life expectancy in older people is important in clinical decision-making because this population is very heterogeneous. Whereas for vital older people usual care is recommended, older people with a limited life expectancy may benefit from integrated, pro-active care1. In addition, although older people with a
bet-ter life expectancy may benefit from cancer screening or advanced medical techniques2,
it is questionable whether older people with a higher mortality risk should be exposed to such invasive tests and/or treatments.
Various prognostic indices are available to predict prognosis in older people3.
Self-reported questionnaires and performance tests are often used to identify older people at risk for mortality4-6. However, these instruments are heterogeneous and a consensus
index is not yet available4-6. Moreover, the application of self-reported questionnaires
and performance tests in the general population is laborious and time consuming. Ar-guably, health care for older people in general could be improved by the development of a robust prognostic tool that is easy to use, inexpensive, fast, and not dependent on healthcare personnel.
Routine clinical laboratory measurements may provide such a clinical prognostic tool. Since most older people are regularly monitored by laboratory tests for preventive or disease-related purposes, such tests may provide valuable prognostic information about older persons. Several common abnormal laboratory results are known to be predictive of poor outcomes in older persons, such as high C-reactive protein (CRP) level7, high homocysteine level8, low high-density lipoprotein-cholesterol (HDL-C)9, low
albumin level10, low alanine transaminase level11, low hemoglobin level12, 13, and poor
kidney function (low creatinin clearance)14. Moreover, combining laboratory results into
a laboratory prognostic index maximizes their predictive utility15-20.
Therefore, this study examines whether and to what extent a profile of seven routine laboratory parameters can predict mortality in persons aged 85 years. In addition, the results from this profile are compared with other known predictors of mortality, i.e. gait speed21 and disability in instrumental activities of daily living (IADL)22.
METhOdS
Study population
This study was performed within the Leiden 85-plus Study, a population-based prospec-tive follow-up study of 85-year-old inhabitants of the city of Leiden, the Netherlands23.
were applied. Fourteen persons died prior to enrolment and 92 refused participation; 7 persons died before blood sample collection and 30 refused blood sampling. As a result, baseline laboratory data for 562 participants (80% of the eligible patients) were available for this study.
At age 85, participants were visited at their place of residence. During these visits, participants underwent face-to-face interviews and were weighed. In addition, perfor-mance tests were done and a venous blood sample was drawn. Information on medical history was obtained from standardised interviews with the participant’s general practi-tioner (GP) or treating elderly care physician (for participants living in a nursing home). All participants gave written informed consent for the study including the use of data from their medical records for additional analysis, following explanation of the study requirements and assurance of confidentiality and anonymity. For participants with severe cognitive impairment, written informed consent was obtained from a proxy. The Medical Ethical Committee of the Leiden University Medical Center approved the study and the informed consent procedure.
Study parameters
Laboratory profile
For each individual participant, we composed a profile of results of seven laboratory measurements: CRP, homocysteine, hemoglobin, HDL-C, alanine transaminase, albumin, and creatinin clearance. These seven laboratory abnormalities were included as markers of different physiological systems; general health status (CRP), cardiovascular status (homocysteine), hematological status (hemoglobin), fatty acid metabolism (HDL-C), liver function (alanine transaminase), nutritional status (albumin), and renal function (creatinin clearance).
Non-fasting blood plasma samples were drawn before 11 am. All samples arrived within 2 hours after the sample was drawn at the laboratory. Hemoglobin levels were then determined on the day the sample was drawn with the use of an automated clinical analyzing system (Coulter Electronics, Hialeah, Florida, USA). After centrifuging with citrate as anticoagulant, plasma samples were frozen immediately to measure concentrations of homocysteine later in one batch in frozen plasma samples with a fluorescence polarization immunoassay after reduction to the free form with an IMx analyzer (Abbott, Abott Park, IL, USA) (coefficient variation 2.2-2.5%). HDL-C, albumin, alanine transaminase, creatinin, and CRP were determined on the day the sample was drawn using the fully automated Hitachi 747 and 911 (Hitachi, Tokyo, Japan). Creatinin clearance was estimated with the Cockcroft Gault formula24.
Since clinical cut-offs are reported to be unreliable in old age25, 26, each parameter was
determined which sex-dependent quartile (high or low) per laboratory measurement predicted the highest mortality risk. Per participant, the number of abnormal laboratory results was summed, i.e. the highest quartile of CRP and homocysteine, and the lowest quartile of hemoglobin, HDL-C, alanine transaminase, albumin, and creatinin clearance.
Scores ranged from zero laboratory abnormalities to seven laboratory abnormalities. Participants were stratified in four risk groups based on the number of abnormalities (no laboratory abnormality, 1 laboratory abnormality, 2-4 laboratory abnormalities and 5-7 laboratory abnormalities).
Gait speed
Gait speed was assessed at the participant’s home with a 12-m walking test, which is described in detail elsewhere27. In short, the course was denoted by a tape
measure-ment of 3 m. Participants were requested to walk 2 times back and forth along the tape as quickly as possible, from a standing start position. Use of a walking aid was allowed. Total time was measured with a stopwatch. For this study we used 6-m gait speed, which is the time an older person needed for one time back and forth along a 3 meter long tape. Gait speed was calculated using distance in meters and time in seconds (m/s) for 497 (88.4%) participants. A total of 65 participants were unable to perform this test. Since older people who are unable to walk are at highest risk, those participants were considered as having the lowest possible gait speed. Gait speed was ranked in four risk groups based on sex-dependent quartiles.
Ability in instrumental activities of daily living
Disability in Instrumental Activities of daily Living (IADL) was measured annually with the Groningen Activities Restriction Scale (GARS)28. The GARS assesses restrictions in
competence in nine basic activities of daily living (BADL) and nine IADL items. It is a self-report questionnaire and assesses therefore if someone can do the task, not if someone actually performs the task29. For the present analyses, only the IADL items were included.
IADL included the following tasks: doing light housework, heavy cleaning, wash and iron clothes, clean and make the bed, prepare a hot meal, climbing stairs, get around outdoors, do the groceries, and attend to feet and toenails. Questions are phrased: ‘Can you fully independently,…?’ Answers range from ‘fully independently, without any dif-ficulty’ (1 point) to ‘not fully independently with someone’s help’ (4 points).
Mortality
Mortality data, recorded from the start of the study until participants reached the age of 90 years, were obtained from the municipal registry. Causes of death were obtained from Statistics Netherlands (CBS), where all national death certificates are coded according to the International Classification of Diseases and Related Disorders, 10th revision. Causes of death were divided into cardiovascular causes (codes I00-I99) and non-cardiovascular causes (all codes except I00-I99)30.
Other parameters
Information on sex, level of education and institutionalization was obtained during face-to-face interviews with participants. Level of education was measured as the high-est educational degree the participant had obtained. Cognitive function was measured annually with the Mini-Mental State Examination (MMSE)31; scores range from 0-30
points, with lower scores indicating poorer cognitive performance. Multimorbidity was defined as the presence of one or more diseases at baseline as indicated by the participants’ GP, elderly care physicians, pharmacy records and laboratory findings, and included stroke, myocardial infarction, severe cognitive impairment, diabetes mellitus, Parkinson disease, hip fracture, arthritis, obstructive lung disease, and cancer32. The
presence of severe cognitive impairment was based on a diagnosis by the participant’s treating physician or a MMSE score <19 points33. The presence of diabetes was based on
a diagnosis by the treating physician, a non-fasting glucose level >200.0 mg/dL, or the use of anti-diabetic medication.
Statistical analysis
Baseline differences between participants in the four risk groups of the laboratory profile were compared with the Jonckheere Terpstra test (for continuous nonparametric variables) or linear by linear test (for categorical variables). Kaplan-Meier curves (includ-ing log rank tests) and Cox proportional hazard models were used for the prediction of the three models (laboratory profile, gait speed, and IADL) on mortality. Since the aim of this study was to assess the predictive performance of the laboratory profile, and not to investigate the causes of disease, no adjustments were made for potential confounders.
We assessed the performance of the different prediction models with receiver opera-tion characteristic (ROC) curves with corresponding c-statistics (neutral value 0.50 and 95% confidence intervals (CI)), using all-cause mortality as the outcome.
As additional sensitivity analyses, stratified analyses were performed for the presence of multimorbidity at baseline.
RESulTS
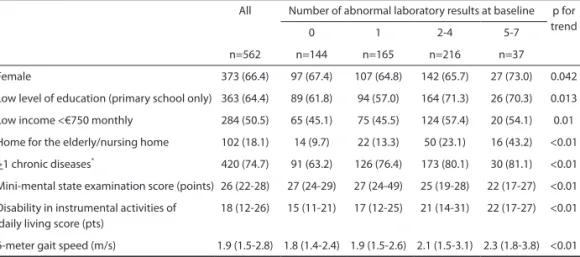
Table 1 shows the characteristics of the total study population, stratified for the four risk groups of the laboratory profile. Of the 562 participants, 373 (66.4%) were female and 102 (18.1%) were living in a home for the elderly or in a nursing home.
At baseline, 144 participants (26.0%) had 0 abnormal laboratory results, 165 (29.4%) had 1 abnormal laboratory result, 216 participants (38.4%) had 2, 3 or 4 abnormal laboratory results, and 37 participants (6.6%) had 5, 6 or 7 abnormal laboratory results. All combinations of laboratory abnormalities for participants with 2 or 3 abnormalities occurred in a similar frequency (data not shown).
With an increasing number of abnormal laboratory results, participants were more likely to have a low income and to live in a home for the elderly or in a nursing home. In addition, participants with an increasing number of abnormalities had more multimor-bidity, more disability in IADL, lower gait speed, and lower MMSE scores (Table 1).
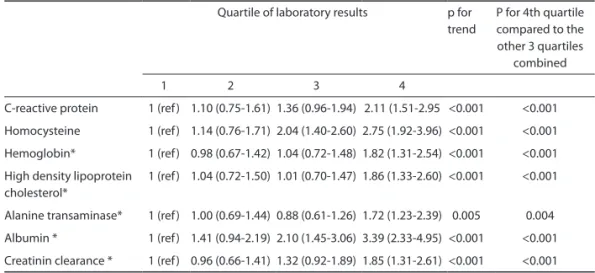
During the 5-year follow-up, 260/562 (46%) participants died. In the univariate analy-sis, participants with levels within the highest quartile of CRP and homocysteine, and within the lowest quartile of hemoglobin, HDL-C, alanine transaminase, albumin and creatinin clearance, had the highest all-cause mortality risk compared to participants within the other quartiles of these laboratory values (Table 2; all p-trend <0.005, all p for 4th quartile compared to other quartiles combined <0.005).
Table 1. Baseline characteristics of the study population at age 85 years stratified according to the number
of abnormal laboratory results.
All Number of abnormal laboratory results at baseline p for trend
0 1 2-4 5-7
n=562 n=144 n=165 n=216 n=37
Female 373 (66.4) 97 (67.4) 107 (64.8) 142 (65.7) 27 (73.0) 0.042 Low level of education (primary school only) 363 (64.4) 89 (61.8) 94 (57.0) 164 (71.3) 26 (70.3) 0.013 Low income <€750 monthly 284 (50.5) 65 (45.1) 75 (45.5) 124 (57.4) 20 (54.1) 0.01 Home for the elderly/nursing home 102 (18.1) 14 (9.7) 22 (13.3) 50 (23.1) 16 (43.2) <0.01 >1 chronic diseases* 420 (74.7) 91 (63.2) 126 (76.4) 173 (80.1) 30 (81.1) <0.01
Mini-mental state examination score (points) 26 (22-28) 27 (24-29) 27 (24-49) 25 (19-28) 22 (17-27) <0.01 Disability in instrumental activities of
daily living score (pts)
18 (12-26) 15 (11-21) 17 (12-25) 21 (14-31) 22 (17-27) <0.01
6-meter gait speed (m/s) 1.9 (1.5-2.8) 1.8 (1.4-2.4) 1.9 (1.5-2.6) 2.1 (1.5-3.1) 2.3 (1.8-3.8) <0.01 Continuous data are presented as median (IQR); p for trend values were obtained by Jonckheere Terpstra tests Categorical data are presented as number (%); p for trend values were obtained by Linear by Linear tests