Studies of Exocytosis at Single Cells
Keith T. Thornley
A dissertation submitted to the faculty of the University of North Carolina at Chapel Hill in partial fulfillment of the requirements for the degree of Doctor of Philosophy in the
Department of Chemistry
Chapel Hill 2009
Abstract
Keith T. Thornley: Studies of Exocytosis at Single Cells (Under the direction of Dr. R. Mark Wightman)
Intercellular communication via chemical signaling is vital to the healthy functioning of multicellular organisms. In exocytosis, intracellular vesicles undergo Ca2+-triggered fusion with the cell plasma membrane, releasing their chemical messengers into the extracellular space. As exocytosis serves as the primary mechanism of communication at neuronal synapses, great emphasis has been placed on understanding the complex cellular regulation of this process. This dissertation focused on the use of amperometry and fast scan cyclic voltammetry at carbon-fiber microelectrodes to monitor exocytosis in real-time at both isolated neurons and chromaffin cells, well-characterized model cells for neuronal exocytosis. These techniques provide the necessary temporal resolution and sensitivity required to detect the chemical signals resulting from individual vesicular release events. Amperometric recordings at midbrain dopamine neurons showed that somatodendritic dopamine release is exocytotic, with a bimodal distribution of vesicular events. A combinatorial approach was used to demonstrate alterations in biogenic amine exocytosis in mice lacking the mitochondrial uncoupling protein UCP2 or the hormone leptin. Conversely, a mouse model of fragile X syndrome revealed no deficiencies in vesicular release mechanisms. Electrochemical methodologies were developed to distinguish catecholamine transmitters from the L-tyrosine-derived trace amines. Application of these methods revealed poor vesicular accumulation of trace amines precludes their function as false transmitters. Finally, vesicular quantal size in chromaffin cells was shown to be resistant to exogenous application of catecholamine precursors.
To Amy
It took five years and over 150 pages for me to finish this chapter of my life. It would take ten times as long on both counts for me to adequately express how
instrumental you were in seeing me through to this moment. You are my strength, my spirit, and my soul.
Acknowledgements
I would like to acknowledge the vast network of individuals who have generously given of their time and energy during my completion of this dissertation. First and foremost, to my advisor Dr. Mark Wightman: thank you for the opportunity to further my knowledge of science in your lab and for the necessary guidance to make the most of that opportunity. To my undergraduate advisor Dr. Bruce Bursten: thanks for nurturing a young, inquisitive mind and providing the motivation for me to pursue this degree. Thanks to my collaborators from other research institutions: Dr. Lorraine Iacovitti at Thomas Jefferson University; Dr. Brad Lowell, Dr. Helen Freeman, and Dr. Dong Kong at Harvard University; and Dr. Jonathan Sweedler at the University of Illinois at Urbana-Champaign.
A hearty thank you to all the members of the Wightman lab for countless helpful discussions on life, sports, and sometimes even science. In particular, thanks to Dr. Brian Kile, who collected the brain slice data presented in these chapters, fixed the HPLC every time I broke it, and, in general, served as my analytical chemistry textbook. Special thanks to Dr. Charles Miller and Jelena Petrovic for assistance with both research and mouse colony maintenance. Also, a thank you to Paul Walsh, perhaps the best undergraduate researcher ever.
Last, but most certainly not least, I would like to acknowledge my family for their tireless support over the years. To my mom, my dad, Tim, Patti, and even you Ryan: thanks for always being there. It's humbling to think I could make such great people proud.
Table of Contents
List of Tables……….x
List of Figures………...xi
List of Abbreviations and Symbols………..xiii
Chapter 1 – Techniques for the Study of Exocytosis………..…….1
Introduction………...1
Exocytosis……….3
Points of Regulation………...5
Ca2+-Dependence………..7
Systems of Interest………...10
Midbrain Dopamine Neurons……….11
Chromaffin Cells………...11
Techniques for Study of Exocytosis………...12
Constant Potential Amperometry………..13
Fast Scan Cyclic Voltammetry………...18
Fluorescent Ca2+ Imaging………...22
High Performance Liquid Chromatography……….24
Dissertation Overview………..25
References……….26
Chapter 2 – Origins of Extrasynaptic Dopamine Release……….32
Introduction……….32
Animals………..…35
Preparation Acutely Dissociated Midbrain Neurons………..….35
Preparation Adrenal Medullary Chromaffin Cells………36
Electrodes and Electrochemistry………...36
Single Cell Experiments………..37
Fluorescent Measurements of Intracellular Ca2+……….38
HPLC Determination of Dopamine Content……….38
Histochemistry………..39
Chemicals………..40
Results………40
Properties of Acutely Dissociated Midbrain Dopamine Neurons………..40
Vesicular Release at Cell Bodies of Dissociated Midbrain Neurons…………43
Effects of Axodendritic Differentiation on Release at Cell Bodies………45
TH-GFP Mice as Suitable Models for Midbrain Studies………51
Discussion………..54
References……….58
Chapter 3 – Energy Stores in Regulated Exocytosis……….62
Introduction……….62
Disclaimer………...65
Materials and Methods……….65
Animals………..65
Preparation of Adrenal Medullary Chromaffin Cells………...65
Preparation of Brain Slices……….66
Electrodes and Electrochemistry………...66
Single Cell Experiments………..67
Slice Experiments………68
Data Analysis………68
Fluorescent Measurements of Intracellular Ca2+……….69
Results………69
Stimulated Release in Brain Slices from ob/ob Animals………69
Exocytosis at Chromaffin Cells from ob/ob Mice………71
Stimulated Release in Brain Slices from UCP2 KO Animals………74
Exocytosis at Chromaffin Cells from UCP2 KO Mice……….77
Discussion………..80
References……….85
Chapter 4 – Exocytosis in a Mouse Model of Fragile X Syndrome……….88
Introduction……….88
Materials and Methods……….90
Animals………..90
Preparation of Adrenal Medullary Chromaffin Cells………...90
Preparation of Brain Slices……….90
Electrodes and Electrochemistry………...91
Single Cell Experiments………..92
Slice Experiments………92
Data Analysis………93
Results………94
Presynaptic Release of Biogenic Amines in Brain Slices………..94
Vesicular Release at Chromaffin Cells……….94
Discussion………..98
References………...100
Chapter 5 – Fast Scan Cyclic Voltammetry of Trace Amines………103
Materials and Methods………...106
Electrodes and Electrochemistry……….106
Flow Injection Experiments………..106
Chemicals………107
Results………..107
Characterization of Trace Amine Electrochemistry………..107
Discrimination from Catecholamines with the Extended Waveform………..109
The Effect of Holding Potential on the Secondary Oxidation Peak…………110
Discrimination from Catecholamines with the Short Waveform……….113
Discussion………114
References………...120
Chapter 6 – The Plasticity of Vesicular Content………122
Introduction………..122
Materials and Methods………...124
Animals………124
Preparation of Adrenal Medullary Chromaffin Cells……….124
Electrodes and Electrochemistry……….125
Single Cell Experiments………125
Data Analysis………..126
HPLC Determination Cellular Catecholamine Content………127
Chemicals………127
Results………..128
Vesicular Loading and Quantal Size at Chromaffin Cells………128
Trace Amines and Vesicular Content at Chromaffin Cells………..131
Discussion………135
References………...141
Appendix 1 – Exploring the Origin of Post-Spike Feet………144
Introduction………..144
Materials and Methods………...146
Preparation of Bovine Adrenal Medullary Chromaffin Cells………146
Electrodes and Electrochemistry……….147
Single Cell Experiments………147
Data Analysis………..148
Results………..148
Discussion………151
References………...153
Appendix 2 – Pressure Ejection, Extracellular Calcium, and Exocytosis………..155
Introduction………..155
Materials and Methods………...156
Preparation of Bovine Adrenal Medullary Chromaffin Cells………156
Fluorescent Measurements of Intracellular Ca2+………..156
Single Cell Experiments………157
Results………..157
Discussion………160
List of Tables
Table 2.1 Comparison of total dopamine content in WT and TH-GFP mice………...53 Table 3.1 Amperometric spike characteristics of WT, ob/ob, and UCP2 KO mice…………73 Table 3.2 Intracellular Ca2+ dynamics in WT, ob/ob, and UCP2 KO mice………..75 Table 4.1 Amperometric spike characteristics of WT and Fmr1 KO mice………...97
List of Figures
Figure 1.1 Schematic drawing of a neuron……….2
Figure 1.2 The synaptic vesicle cycle……….4
Figure 1.3 Intracellular Ca2+ regulation in an adrenal chromaffin cell………9
Figure 1.4 Electron micrograph of a disk carbon-fiber microelectrode………14
Figure 1.5 Amperometric measurements of exocytosis……….16
Figure 1.6 Individual amperometric spike characteristics………..17
Figure 1.7 Fast scan cyclic voltammetry technique………19
Figure 1.8 FSCV measurements of exocytosis………...21
Figure 1.9 Structure and excitation spectra of fura Ca2+ dyes………..23
Figure 2.1 Identification of dissociated midbrain dopamine neurons………...41
Figure 2.2 Intracellular Ca2+ transients at midbrain dopamine neurons………..42
Figure 2.3 Vesicular release of dopamine from the cell body of an acutely dissociated midbrain dopamine neuron………...44
Figure 2.4 Amperometric spike distributions reveal two vesicle pools………46
Figure 2.5 Identification of dissociated midbrain dopamine neurons grown on glial monolayers………..47
Figure 2.6 Amperometric spike distributions remain bimodal………...49
Figure 2.7 Differences in amperometric spike characteristics between neuron isolation procedures………50
Figure 2.8 Comparison of exocytosis between WT and TH-GFP mice………..52
Figure 3.1 Leptin deficiency affects striatal dopamine release but not stimulated 5-HT release in the substantia nigra………...70
Figure 3.2 Vesicular release at WT and ob/ob cells………...72
Figure 3.3 Lack of UCP2 affects striatal dopamine release but not stimulated 5-HT release in the substantia nigra………...76
Figure 3.4 Genipin modulation of dopamine release and uptake in mouse brain slices…..78
Figure 4.1 Stimulated neurotransmitter release in three regions
of the adult mouse brain………..95
Figure 4.2 Vesicular release at WT and Fmr1 KO cells……….96
Figure 5.1 Chemical structures of the catecholamines and trace amines………105
Figure 5.2 Electrochemical characterization of tyramine, octopamine, and synephrine with the extended waveform……….108
Figure 5.3 Discrimination of catecholamines and trace amines with the extended waveform………..111
Figure 5.4 Electrochemical characterization of tyramine, octopamine, and synephrine with the short waveform……….112
Figure 5.5 Discrimination of catecholamines and trace amines with the short waveform……….115
Figure 6.1 Exocytosis following L-DOPA, NE, and E loading……….129
Figure 6.2 Cellular catecholamine content following L-DOPA loading………..130
Figure 6.3 Exocytosis following tyramine treatment……….132
Figure 6.4 Exocytosis following octopamine treatment………133
Figure 6.5 Exocytosis following synephrine treatment……….134
Figure 6.6 Cellular catecholamine content following trace amine treatment………136
Figure A1.1 Examples of pre- and post-spike feet………...145
Figure A1.2 Vesicular release after wortmannin treatment……….149
Figure A1.3 Amperometric spike characteristics following wortmannin treatment………..150
Figure A2.1 Effect of extracellular Ca2+ on intracellular Ca2+ responses………..158
Figure A2.2 Intracellular Ca2+ dynamics depend on buffer Ca2+………159
List of Abbreviations and Symbols
[Ca2+]i Intracellular Ca2+ concentration 5-HT 5-hydroxytryptamine (serotonin) ATP Adenosine triphosphate
CV Background-subtracted cyclic voltammogram DAT Dopamine transporter
E Epinephrine
ER Endoplasmic reticulum
FMRP Fragile X mental retardation protein FSCV Fast scan cyclic voltammetry FXS Fragile X syndrome
GFP Green fluorescent protein GTP Guanosine triphosphate
HPLC High performance liquid chromatography Imax Amplitude
Kd Dissociation constant
KO Knock out
L-DOPA L-3,4-dihydroxy-phenylalanine LDCV Large dense core vesicle MAO Monoamine oxidase NAc Nucleus accumbens
NE Norepinephrine
PC12 Rat phaeochromocytoma
Q Quantal size
xiv
RRP Readily releasable pool
SNc Substantia nigra pars compacta SNr Substantia nigra pars reticulata
SNARE Soluble NSF attachment protein receptor SSV Small synaptic vesicle
t1/2 Halfwidth td Decay time tr Rise time
TH Tyrosine hydroxylase UCP2 Uncoupling protein 2 Vmax Maximal uptake velocity
vBNST Ventral bed nucleus of the stria terminalis VGCC Voltage-gated calcium channel
VMAT Vesicular monoamine transporter VTA Ventral tegmental area
Chapter 1
Techniques for the Study of Exocytosis
Introduction
Chemical signaling forms the basis of intercellular communication in multicellular
organisms. Following triggered secretion, chemical messengers diffuse to their site of action
where they are specifically detected by target cells. Exocytosis is a secretory process in
which intracellular vesicles containing chemical messengers fuse with the cell's plasma
membrane extruding the vesicular content into the extracellular space. Exocytosis is the
primary cellular mechanism for the triggered release of chemical messengers, and has been
the object of intense study as it represents the principle method of communication at the
neuronal synapse.
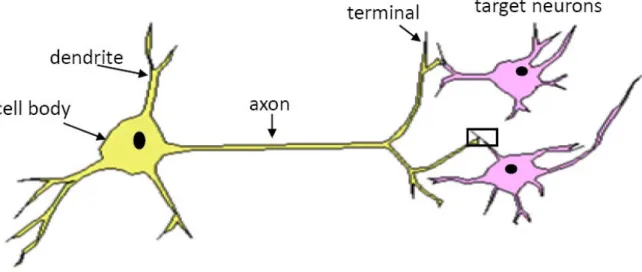
In the mammalian nervous system, information is transmitted in pathways via
specialized cells called neurons (Figure 1.1). Neurons are excitable cells that communicate
with each other through a combination of electrical and chemical signals. Through strict
regulation of intracellular and extracellular ion concentrations (mainly Na+, K+, and Cl-),
neurons maintain a negative resting potential across the plasma membrane of
approximately 70 mV (with the intracellular compartment being more negative) (Squire,
2008). Neurons receive inputs at their dendrites, where the action of chemical messengers
on ionotropic receptors produces changes in ion concentration gradients that manifest as
fluctuations in membrane potential. These fluctuations can be excitatory or inhibitory, with
excitatory responses corresponding to positive deflections in the membrane potential and
Figure 1.1. Schematic drawing of a neuron. Neurons receive inputs at the dendrites. Inputs are summed at the cell body, or soma. If the inputs are significant , the neuron will fire an action potential that propagates down the axon to the axon terminals, which form specialized specialized connections called synapses (black box) on the dendrites of target neurons.
summed at the cell body, or soma. If the membrane potential is deflected above the
threshold, the neuron will fire an action potential. During an action potential, the positive
deflections in membrane potential trigger the opening of voltage-gated Na+ channels and the
influx of Na+ ions into the cell along their concentration gradient, further depolarizing the
membrane. As voltage-gated K+ channels open, prompting efflux of K+ ions out of the cell
along their concentration gradient, and the Na+ channels begin to inactive, the cell returns to
its resting membrane potential. The action potential propagates down the axon as local
depolarization stimulates the opening of neighboring Na+ and K+ channels, ultimately
reaching the synapse, a specialized connection between axon terminals and the dendrites
of their target neurons. At the synapse, the invading action potential causes voltage-gated
calcium channels (VGCCs) to open, and the resulting Ca2+ influx triggers the exocytosis of
chemical neurotransmitters (Llinas et al., 1992; Borst and Sakmann, 1996). The
transmitters diffuse across the synaptic cleft, a 20-50 nm gap ensuring the electrical
depolarization isn't transferred to the next cell, and their actions on postsynaptic receptors
begin the signal transduction process anew.
Exocytosis
Figure 1.2 shows a drawing that outlines some of the major steps in the exocytotic
process. Vesicles are packaged with neurotransmitters via active transport and then are
localized in clusters/pools near the presynaptic active zone. Prior to release, vesicles must
be physically relocated to the plasma membrane. In a series of ATP-dependent steps,
vesicles are recruited, tethered, and docked to the plasma membrane (Burgoyne and
Morgan, 2003). A final priming step renders vesicles competent for Ca2+-triggered formation
of the fusion pore and secretion of their contents into the extracellular space. Following
release, vesicles are recycled for further rounds of exocytosis through three primary routes
depending on whether full fusion and incorporation of the vesicular membrane into the
Figure 1.2. The synaptic vesicle cycle. Red arrows indicate steps in exocytosis and yellow arrows indicate steps in endocytosis. Synaptic vesicles are filled with neurotransmitters via active transport (1). Prior to release, vesicles are mobilized from clusters/pools (2) to dock at the plasma membrane (3). Following a priming step (4), vesicles are capable of
undergoing Ca2+-triggered fusion (5). Vesicles are recycled via several pathways including
local reuse (6), fast recycling without an endosomal intermediate (7), and clathrin-mediated endocytosis with or without an endosomal intermediate (8-9). (Sudhof, 2004)
without undocking, leaving them available for immediate release (sometimes termed "kiss
and stay" exocytosis), or can undock and undergo local repackaging ("kiss and run"
exocytosis) (Harata et al., 2006). After full fusion, vesicles undergo a slower endocytosis
pathway via clathrin-coated pits that may or may not involve an endosomal intermediate
(Smith et al., 2008).
Points of Regulation
Neurotransmitters are packaged at high concentrations into vesicles via active
transport. Biochemical studies have revealed seven transporter proteins for the classical
neurotransmitters: three differentially-expressed transporters for glutamate (Bellocchio et
al., 2000; Fremeau et al., 2001; Fremeau et al., 2002), two differentially expressed
transporters for all the monoamines (Erickson et al., 1992; Liu et al., 1992), a single
transporter for gamma-aminobutyric acid (GABA) and glycine (McIntire et al., 1997; Sagne
et al., 1997), and a single transporter for acetylcholine (Roghani et al., 1994). Active
transport is driven by a vacuolar-type proton pump that couples hydrolysis of ATP to the
movement of H+ from the cytosol to the vesicle interior, generating an electrochemical
gradient (Maycox et al., 1988). The vesicular transporters then couple translocation of
transmitter against its concentration gradient with the exchange of H+ running down its
electrochemical gradient (Chaudhry et al., 2008). Transporters play two important roles in
chemical communication. First, expression of a particular vesicular transporter is a major
determinant in the type of neurotransmitter used at a synapse. As an example, GABAergic
neurons transfected with a vesicular glutamate transmitter became capable of releasing
glutamate in addition to GABA (Takamori et al., 2000). Second, vesicular transporters help
regulate the amount of neurotransmitter released during exocytosis. For instance,
overexpression of the vesicular monoamine transporter (VMAT2) has been shown to
VMAT2 gene lead to significantly reduced dopamine levels in the striatum (Wang et al.,
1997).
A second concept crucial to understanding the regulated process of exocytosis is
that of vesicle pools. Within a presynaptic terminal, the population of vesicles can be
divided into two separate vesicle pools based on morphological and physiological criteria:
the readily releasable pool (RRP), consisting of those vesicles docked at the active zone
and immediately available for exocytosis, and the reserve pool (RP), consisting of those
vesicles clustered at a distance from the plasma membrane and not immediately available
for release (Rizzoli and Betz, 2005). Directly following stimulation of the nerve terminal,
vesicles in the RRP are released, leading to a depletion of the pool. In response to
prolonged or intense stimuli, continued release is dependent on the recycling of vesicles
back into the RRP and/or the mobilization of vesicles from the RP to the RRP for
subsequent release. The cellular mechanisms responsible for sequestering the RP and
controlling vesicle mobilization are still under investigation, but most work to date has
focused on synapsins, peripheral membrane proteins associated with synaptic vesicles
(Schiebler et al., 1986; Benfenati et al., 1989a; Benfenati et al., 1989b). Mammals express
three synapsin genes, with most neuronal synapses expressing synapsins 1 and 2 (De
Camilli et al., 1990; Hosaka and Sudhof, 1998a). Conserved among all synapsins are a
N-terminal domain containing phosphorylation sites for cAMP-dependent protein kinase and
Ca2+/calmodulin-dependent kinases and a large, central domain with a high affinity
ATP-binding site (Hosaka and Sudhof, 1998b). Research showing that synapsins bind to
cytoskeletal components, particularly actin, as well as synaptic vesicles, and that
phosphorylation of synapsins eliminates vesicle binding suggests that synapsin could be
involved in regulating the availability of the RP vesicles via a reversible cross-linking
between vesicles and/or vesicles and the cytoskeleton (Bahler and Greengard, 1987;
Benfenati et al., 1992).
The final point of regulation prior to release of neurotransmitters is the actual fusion
of the vesicular membrane with the cell plasma membrane. Four classes of proteins have
been identified as the core machinery controlling this process: SNARE proteins, SNARE
regulators, Rab proteins, and Rab effectors (Jahn et al., 2003). Rab proteins belong to a
family of small guanosine triphosphate (GTP)-binding proteins, and interact with effectors
and vesicles in a GTP-dependent manner (Araki et al., 1990; Johnston et al., 1991). Rab
proteins are presumed to act as switches, with the active, GTP-bound state rendering
vesicles competent for docking to the plasma membrane (Rybin et al., 1996). The
phospholipid bilayers comprising the vesicular and plasma membrane are both negatively
charged, resulting in an energy barrier to fusion. Soluble NSF attachment protein receptor
(SNARE) proteins are membrane-associated proteins that contain a characteristic residue
sequence called the SNARE motif. There are three SNARE proteins linked to exocytosis:
synaptobrevin located on the vesicular membrane and syntaxin and SNAP-25 on the
plasma membrane (Sollner et al., 1993). Synaptobrevin and syntaxin each contain a single
SNARE motif, while SNAP-25 contains two SNARE motifs. Association of the four SNARE
motifs into a "trans complex," a parallel four helical bundle, overcomes the repulsion energy
barrier and forces the vesicular and plasma membrane together (Hanson et al., 1997;
Weber et al., 1998). This results in an unstable intermediate from which the fusion pore can
form by mixing of the destabilized phospholipid bilayers. SNARE proteins are additionally
regulated by the Sec1/Munc18-like proteins. While necessary for fusion, the exact roles of
these proteins remain unclear. To date, evidence suggests that these proteins play a role in
controlling the availability of syntaxin for SNARE complex formation and the vesicle priming
step following establishment of the SNARE complex (Hata et al., 1993; Deak et al., 2009).
Ca2+-Dependence
As mentioned earlier, exocytosis of neurotransmitters is a Ca2+-mediated process.
VGCCs, and the resulting influx of Ca2+ ions serves as the ultimate trigger for release. The
extent to which Ca2+ elicits vesicular release is then dependent on two factors: the
efficiency of the cellular mechanisms for translating increases in intracellular Ca2+
concentration ([Ca2+]
i) to vesicle fusion and the time course of the Ca2+ signal in the
synapse. The putative cellular Ca2+ sensor is synaptotagmin, a synaptic vesicle-associated
protein with two Ca2+-binding C
2 domains (Perin et al., 1990). Multiple synaptotagmin
isoforms have been identified in the brain, with synaptotagmin-1,-2, and -9 implicated as the
Ca2+ sensors in exocytosis (Xu et al., 2007). The current model suggests that through Ca2+
-dependent interactions with phospholipids and the SNARE proteins, synaptotagmins
promote fusion pore formation by pulling the SNARE complexes apart (Sudhof, 2004).
Supporting the role of synaptotagmins in exocytosis, the micromolar Ca2+ affinity of
synaptotagmins is consistent with the Ca2+ affinity of release measured at the Calyx of Held
synapse (Meinrenken et al., 2003), and genetic alterations of synaptotagmin Ca2+ affinity
produce proportional changes in the Ca2+ affinity of release (Fernandez-Chacon et al.,
2001). In addition to triggering vesicle fusion via synaptotagmin, Ca2+ influx also facilitates
vesicle mobilization. Increases in [Ca2+]i have been shown to relocate docked vesicles
closer to Ca2+ entry sites (Becherer et al., 2003) and to activate the protein scinderin, which
severs F-actin filaments (Rodriguez Del Castillo et al., 1990). Disruption of the cortical actin
cytoskeleton serves as a first step in the recruitment of vesicles to the plasma membrane for
exocytosis (Burgoyne and Cheek, 1987). Similarly, the mobilization of RP vesicles is
thought to depend on Ca2+-mediated phosphorylation of synapsin (Chi et al., 2003).
The Ca2+ dynamics in a synapse can be simply represented as a series of fluxes
between the extracellular medium, the cytosol, and intracellular organelles (chiefly
mitochondria and the endoplasmic reticulum (ER)) (Figure 1.3). At rest these fluxes are
minimal, with the [Ca2+] in the cytosol and mitochondrial matrix in the 100 nM range and the
[Ca2+] in the extracellular medium and inside the ER above 1 mM. As the action potential
Figure 1.3. Intracellular Ca2+ regulation in an adrenal chromaffin cell. Ca2+ entry through voltage-gated calcium channels (VOCC) and/or release from the ER generates a local
microdomain of high [Ca2+]. Cytosolic Ca2+ is cleared by ATP-driven pumps (white circles)
on the plasma and ER membranes or mitochondrial uptake via the uniporter (U). Spatial organization of the intracellular organelles helps define the boundaries of the microdomain
invades the synapse, VGCCs open and Ca2+ rushes from the extracellular medium down its
concentration gradient into the cytosol. The spatial distribution of the VGCCs coupled with
the limited diffusion of Ca2+ due to endogenous cytosolic Ca2+ buffers produces localized
concentration microdomains in the tens of micromolar (Neher, 1998). Ca2+ release from the
ER, triggered via either the Ca2+-gated ryanodine receptors or second messenger inositol
1,4,5-trisphosphate-gated channels, may also contribute to cytosolic [Ca2+] (Verkhratsky,
2004). Clearance of cytosolic Ca2+ occurs at the plasma membrane through the
combination of a Na+/Ca2+ exchanger and an ATP-driven Ca2+ pump. Cytosolic Ca2+ may
also be cleared by uptake into intracellular organelles. An ATP-driven Ca2+ pump resides on
the ER membrane, and mitochondria uptake Ca2+ through a low affinity uniporter driven by
the mitochondrial membrane potential (Gunter and Pfeiffer, 1990). At basal levels of
stimulation, the cytosolic Ca2+ transient is shaped primarily by diffusion and the endogenous
buffers (Neher, 1998). Global cytosolic [Ca2+] reaches levels around 1 µM, and clearance is
dominated by the ATP-driven Ca2+ pumps on the plasma and ER membranes (Meinrenken
et al., 2003; Garcia et al., 2006). During intense stimulation, cytosolic [Ca2+] may reach
levels high enough to facilitate uptake through the mitochondrial uniporter. Mitochondrial
Ca2+ uptake stimulates cellular respiration (Rizzuto et al., 2000), and Ca2+ clearance via this
mechanism may provide the necessary energy to restore Ca2+ to resting levels.
Systems of Interest
Regulated secretory vesicle exocytosis has been documented in a vast array of cell
types including neurons, neuroendocrine cells, exocrine cells, hemopoietic cells, endothelial
cells, and even sperm. The primary focus of this work is to better understand the cellular
mechanisms responsible for neuronal communication, and hence studies have been
conducted at individual neurons and chromaffin cells, a well-characterized model system for
neuronal exocytosis.
Midbrain Dopamine Neurons
Dopamine, along with serotonin and norepinephrine (NE), belongs to the biogenic
amine class of neurotransmitters. Dopamine modulates a wide variety of physiological
functions in the brain from control of locomotion to reward seeking behavior. The particular
involvement of dopamine in the brain chemistry of addiction and of motor movement
disorders such as Parkinson's and Huntington's disease makes the regulated exocytosis of
dopamine an especially attractive system for study. The term midbrain refers specifically to
those dopamine neurons whose cell bodies are located in the substantia nigra (SN) and the
ventral tegmental area (VTA). Dopamine neurons in the SN project to the striatum to form
the nigrostriatal pathway, while dopamine neurons in the VTA project to the nucleus
accumbens to form the mesolimbic pathway.
Chromaffin Cells
Adrenal medullary chromaffin cells, members of the neuroendocrine system, have
been widely used in biochemical studies of vesicular exocytosis owing to their common
origin with sympathetic neurons in the neural crest and their relative ease of isolation as
homogenous populations in primary culture (Fujita, 1977; Livett, 1984). Chromaffin cells
help modulate the body's "fight or flight" response by releasing the catecholamine hormones
epinephrine (E) and NE into the bloodstream. A wealth of experimental evidence has
revealed that the Ca2+ dependence of release and the protein machinery of vesicular
docking and fusion are conserved in the chromaffin cell and the synapse (Morgan and
Burgoyne, 1997; Burgoyne and Morgan, 2003). Chromaffin cells are an especially useful
model of dopaminergic neurons as they both contain the same catecholamine synthesis
enzymes and package transmitter into vesicles with VMAT, although via different isoforms
(Erickson et al., 1996). The primary distinction between exocytosis at chromaffin cells and
neurons is the size of the vesicles. In contrast to the small synaptic vesicles (diameter ≤ 50
in large dense core vesicles (LDCVs) with diameters near 300 nm. The greater capacity of
LDCVs facilitates measurements of individual vesicular release events.
Techniques for Study of Exocytosis
Real time monitoring of exocytosis is subject to several challenging experimental
constraints. First, measurement at spatially resolved regions of isolated cells requires a
sensor with physical dimensions in the micron range. Second, observation of individual
vesicular events requires a technique with extreme sensitivity. For even though vesicles can
contain high concentrations of transmitter (up to 0.5 M), their small size necessitates limits of
detection in the zeptomole to attomole range. Third, the rapid time course of vesicular
fusion and release requires a technique with microsecond to millisecond resolution. And
finally, a cell that releases multiple transmitters or a transmitter of unknown identity requires
a technique with chemical selectivity. When used with carbon-fiber microelectrodes, the
electrochemical techniques of constant potential amperometry (referred to hereafter as
amperometry) and fast scan cyclic voltammetry (FSCV) provide the necessary spatial,
temporal, sensitivity, and selectivity characteristics for accurate recordings of the exocytotic
process. These techniques take advantage of the fact that several important secreted
chemical messengers, including the catecholamines dopamine, NE, and E, are easily
oxidized.
Carbon-fiber microelectrodes provide distinct advantages over conventional-sized
electrodes for measurements of exocytosis at single cells. The small size of
microelectrodes decreases double layer capacitance at the electrode tip, reducing the time
constant of the electrode and allowing measurements down to the sub-microsecond time
scale (Amatore and Maisonhaute, 2005). As the spatial dimensions of the carbon-fiber
microelectrode approximate that of a single cell, the signal to noise ratio is enhanced over
sensors with extraneous electroactive surface area (Schroeder et al., 1994). The use of
disk geometries is particularly advantageous for single cell recordings. Disk microelectrodes
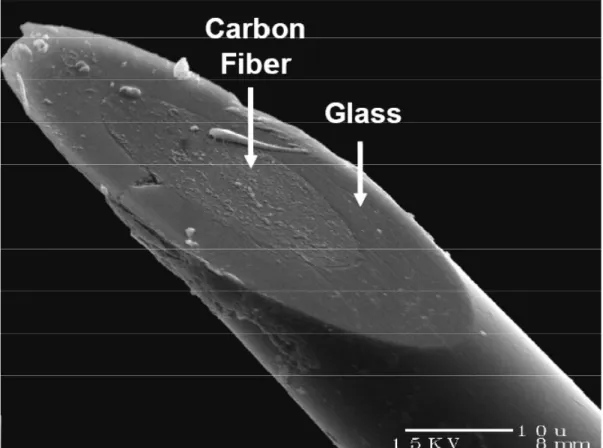
(Figure 1.4) are fabricated by insulating a carbon fiber (6-10 µm in diameter) in a pulled
glass capillary and beveling the tip at 45 degrees to create a flat, elliptical sensor surface
(Kawagoe et al., 1993). Disk microelectrodes can be positioned flush with the membrane of
a cell, creating an "artificial synapse" configuration where the restricted extracellular volume
into which transmitters are released minimizes signal loss due to diffusion and allows the
release of a small number of molecules in the local vicinity of the sensor/receptor to be
detected with a high signal to noise ratio (Amatore et al., 2008). This same approach is
used by nature at the biological synapse.
Constant Potential Amperometry
In amperometry, the electrode is held at a constant potential sufficient to oxidize or
reduce an analyte of interest. Analytes are immediately electrolyzed upon contact with the
electrode surface, resulting in a measurable current. Unlike FSCV, in which the electrode
response is slowed by adsorption and desorption of the analyte to the electrode surface
(Bath et al., 2000), the temporal response of amperometry is limited only by mass transport
and electron transfer kinetics. Thus, amperometry offers superior temporal resolution
compared to FSCV. However, amperometry does not allow for positive analyte
identification. If multiple electroactive species are present that can undergo oxidation or
reduction at the electrode holding potential, it is impossible to distinguish their corresponding
components of the recorded signal. For this reason, precaution must be taken with
amperometric measurements in mixed samples to ensure the identity of the released
species through knowledge of cell type and neurotransmitter content from complementary
techniques such as FSCV and liquid chromatography. Amperometry at carbon-fiber
microelectrodes was first used at bovine chromaffin cells, providing the first direct chemical
evidence of exocytosis (Leszczyszyn et al., 1990, 1991). The technique has since been
Figure 1.4. Electron micrograph of a disk carbon-fiber microelectrode. The carbon fiber is sealed in a glass capillary, and the electrode is beveled at 45 degrees to create a flat electroactive surface that can be positioned flush with the cell membrane.
neurons (Chen et al., 1994; Bruns and Jahn, 1995; Huang et al., 1995; Zhou and Misler,
1995).
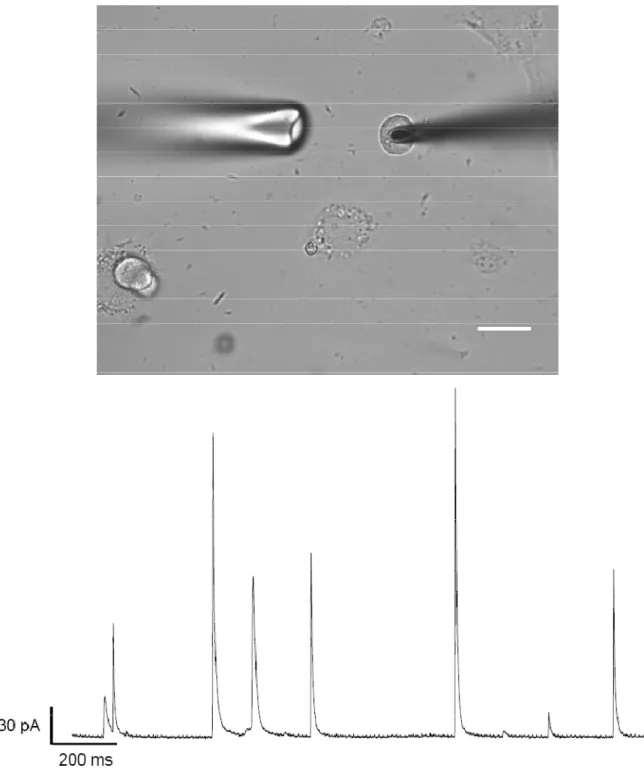
Figure 1.5 (top panel) shows a typical experimental setup for amperometry at a
single cell. The disk electrode is positioned flush with cell membrane, and exocytosis is
induced via pressure ejection of chemical secretagogues from a nearby stimulating pipette.
If the electrode is held at a potential sufficient to oxidize the released transmitter, a series of
discrete current spikes are recorded (Figure 1.5, bottom panel). The individual spikes have
been shown to correspond to the oxidation of molecules released from single vesicles
(Wightman et al., 1991). By examining the number and frequency of current spikes along
with the individual spike characteristics, much information can be revealed about the
vesicular release mechanisms at target cells. For example, the total number and frequency
of events in response to a stimulus can be used to probe the size of the RRP, efficiency of
vesicle docking and fusion, the recycling of vesicles back into the RRP, and the mobilization
of vesicles from the RP to the RRP.
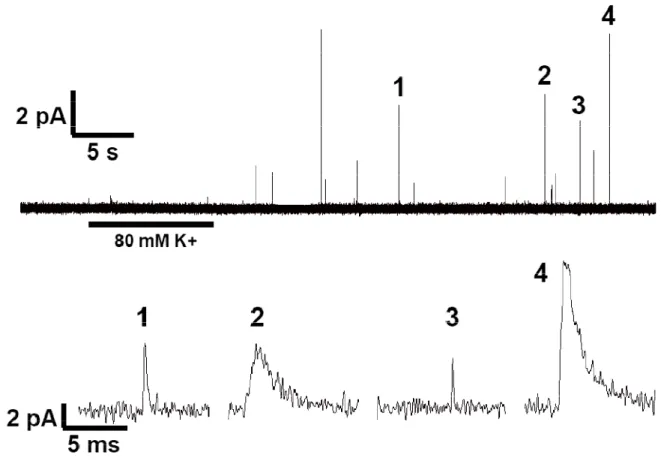
Figure 1.6 shows an expanded view of an individual amperometric current spike.
Spikes are generally characterized by a sharp rise in current, corresponding to a rapid flux
of transmitter intro the extracellular space following vesicular fusion, and a more gradual
decay to baseline (Schroeder et al., 1996). Additionally, pre-spike features known as feet
may sometimes be observed (Chow et al., 1992). These features have been attributed to
the leak of transmitter through the fusion pore intermediate that precedes full vesicular
fusion. Individual spike characteristics that are commonly measured include the amplitude
(Imax), halfwidth (t1/2), rise time (tr), decay time (td), and area (or quantal size, Q). Spike Imax
values can be related to the maximal flux of transmitter during a fusion event. The kinetic
parameters t1/2, tr, and td provide information on the time course of the extrusion of vesicular
content following fusion. Spike area is directly related to the number of molecules
Figure 1.5. Amperometric measurements of exocytosis. Top panel: transmitted light micrograph showing typical experimental setup. The microelectrode (right) is lowered until it contacts the cell membrane. Exocytosis is triggered by pressure ejection of chemical secretagogues from a stim pipette (left) located 20 to 60 µm from the cell. Scale bar = 20 µm. Bottom panel: following stimulation, a series of discrete current spikes are observed at the electrode. Each spike represents the fusion of a single secretory vesicle. Trace is taken
from a mouse chromaffin cell stimmed with 60 mM K+.
Figure 1.6. Individual amperometric spike characteristics. Imax is the peak current or
amplitude of the spike. t1/2 is the width at half height. tr and td are the rise time and decay
time yields the measured charge (Q, in coulombs), which is proportional to moles of analyte
(m) by Faraday's law, Q = nFm, where n is the number of electrons involved in the
electrochemical reaction and F is Faraday's constant.
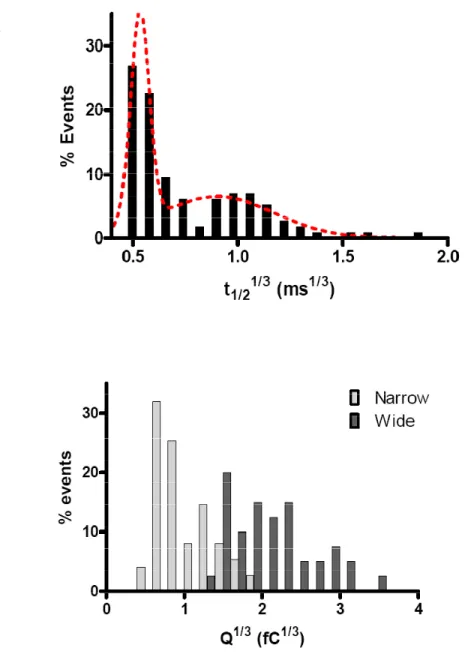
Contrary to the expectations from the quantal hypothesis of neurotransmission, direct
measurement of exocytosis with amperometry reveals that individual vesicular events are
surprisingly nonuniform. Histograms of raw amperometric spike Q and t1/2 data reveal
non-Gaussian distributions heavily skewed towards smaller values with the means being larger
than the modes (Finnegan et al., 1996; Pothos et al., 1998; Villanueva et al., 2006). If one
assumes a uniform concentration of transmitter in the spherical vesicles, then the
amperometric spike characteristics should depend on vesicular volume (Bekkers et al.,
1990). Vesicle radii (volume1/3) show a normal Gaussian distribution in most cells,
suggesting that histograms of the cube roots of Q and t1/2 should also show a Gaussian
distribution. These cube root distributions are indeed Gaussian, with relative standard
deviations approximating those for the vesicle radii (Finnegan et al., 1996).
Fast Scan Cyclic Voltammetry
In FSCV, the electrode potential is periodically scanned in a triangle waveform
(Figure 1.7). Voltage limits are chosen such that oxidation and reduction of the analyte of
interest occur within the potential window. The fast scan rates result in large background
currents associated with charging of the double layer capacitance. Fortunately, these
background currents are stable over short time periods, allowing the use of digital
background subtraction to reveal the comparatively small Faradaic current resulting from
oxidation and reduction of the analyte (Howell et al., 1986). The current amplitude is directly
proportional to the local concentration of analyte at the electrode surface, with FSCV at
carbon-fiber microelectrodes demonstrating nanomolar limits of detection (Cahill et al.,
1996). The background-subtracted cyclic voltammogram (CV) is characteristic of the
detected species, and the positions of the peak currents for oxidation and reduction and the
peak shapes can be used to distinguish between analytes (Heien et al., 2004). This
chemical selectivity of FSCV has been exploited in studies of exocytosis at single cells
where multiple chemical messengers are released. FSCV at carbon-fiber microelectrodes
has been used to discriminate between vesicular release of E and NE at chromaffin cells
(Pihel et al., 1994) and to detect release of histamine and serotonin at mast cells (Pihel et
al., 1995). The latter providing the first direct evidence for corelease of chemical
messengers from a single vesicle.
Figure 1.8 shows an example of the data obtained by monitoring exocytosis at single
cells with FSCV. In this example, the potential at the electrode was scanned from -0.4 V to
1.3 V and back at 600 V/s to measure the secretion of NE and E from a chromaffin cell.
With this waveform, the CVs for the two catecholamines are indistinguishable and the peak
oxidation and reduction currents occur at 0.6 V and -0.2 V, respectively. In order to view
multiple CVs simultaneously, FSCV data is generally presented in false color plots (Michael
et al., 1998). By extracting the current at the peak oxidation potential from successive CVs,
a current vs. time trace very similar to those from amperometric measurements can be
obtained. As Figure 1.8 clearly shows, FSCV has sufficient temporal resolution to observe
individual exocytotic events. However, when compared to an amperometric trace (Figure
1.5), it is obvious that the resolution is significantly diminished. This, again, is due to the fact
that the temporal response in amperometry is limited only by mass transport and electron
transfer kinetics. In FSCV, the temporal response is ultimately limited by the frequency at
which the waveform is applied to the electrode. In this case, the frequency is 60 Hz, or one
data point every 16.7 ms. Despite poorer kinetic information, the advantage to FSCV
measurements of exocytosis is that the CV can be used to verify the chemical identity of the
secreted species for each vesicular event. Thus, amperometry and FSCV can be viewed as
complementary techniques, each vital to the study of exocytosis at single cells.
Figure 1.8. FSCV measurements of exocytosis. A 3 s time window of release from a
mouse chromaffin cell stimulated with 60 mM K+ is shown. The color plot (bottom) displays
Fluorescent Ca2+ Imaging
The fundamental role of Ca2+ in vesicular release makes real time monitoring of
changes in [Ca2+]
i vital for a complete understanding of exocytosis. The development of the
fura family of fluorescent Ca2+ indicators in the lab of Dr. Tsien has provided researchers
with a simple tool for such measurements (Grynkiewicz et al., 1985). One of the primary
advantages of fura dyes is their ability to be prepared as acetoxymethyl ester derivitives,
rendering the hydrophillic dyes membrane permeable for easy loading into cells. In the
cytosol, endogenous cellular esterases cleave the ester linkages effectively trapping the
indicator inside the cell in its active form. Figure 1.9A shows the active forms of fura-2 and
fura-FF. The addition of two fluorine atoms produces a near 40-fold decrease in Ca2+ affinity
for fura-FF relative to fura-2. With Ca2+ dissociation constants (Kd) of 0.14 and 5.5 µM,
respectively, both fura-2 and fura-FF are suitable for studying the transient changes in
[Ca2+]i accompanying exocytosis, where resting levels near 100 nM are rapidly increased to
micromolar levels. However, fura-2 does exhibit limited sensitivity to [Ca2+]i greater than 1
µM as these concentrations approach the edge of the dye's linear response window
(approximately 0.1 to 10 x Kd).
Fura dyes bind Ca2+ in a 1:1 manner. The unbound indicator has a peak
fluorescence excitation wavelength of 380 nm and a peak fluorescence emission
wavelength of 510 nm (Figure 1.9B). Upon Ca2+ binding, the dye undergoes an absorption
shift to 340 nm, while maintaining peak fluorescence emission at 510 nm (Figure 1.9B).
Thus, by rapidly switching the excitation wavelength between 340 and 380 nm and
monitoring emission at 510 nm, it is possible to obtain dynamic information on the ratio of
bound to unbound dye inside the cell. The ability to perform ratiometric measurements
significantly reduces the effects of differing cell thickness, uneven dye loading, dye leakage,
photobleaching, and intensity of the excitation source; variables the must be accounted for
in dyes utilizing only changes in fluorescence intensity upon binding (Moore et al., 1990).
Figure 1.9. Structure and excitation spectra of fura Ca2+ dyes. A. Molecular structure of the active, cell-impermeant forms of fura-2 and fura-FF. B. Fluorescence excitation and emission spectra for fura-2 (fura-FF spectra are identical). Peak excitation wavelength for
the Ca2+-bound dye (trace A) is 340 nm. Peak excitation wavelength for the free dye (trace
By calibrating the indicator in solutions of known [Ca2+], experimentally determined ratio
values can be calibrated to [Ca2+] t ing ation:
i using he follow equ
(1)
where Kd is the dissociation constant, R is the experimentally observed ratio, Rmin is the ratio
measured in a Ca2+-free solution, Rmax is the ratio measured in a solution of dye-saturating
[Ca2+], F380max is the fluorescence observed with 380 nm excitation in a Ca2+-free solution,
and F380min is the fluorescence observed with 380 nm excitation in a solution of
dye-saturating [Ca2+]. This equation assumes that the fluorescent properties and the Ca2+
affinity of the dye are similar in both the calibration solutions and the cell cytosol.
Several important limitations have been addressed in the use of fura dyes for
measurement of [Ca2+]
i (Roe et al., 1990). These include incomplete hydrolysis of
acetoxymethyl ester bonds by cytosolic esterases, sequestration of fura dyes in intracellular
organelles, quenching of fluorescence by heavy metals, active and passive dye loss from
loaded cells, enhanced cytosolic Ca2+ buffering at high concentrations of the dye (≥100 µM),
and shifts in the Kd for Ca2+ as a function of the viscosity, ionic strength, and temperature of
the dye environment. However, through careful control of experimental conditions and dye
concentrations, fura dyes can be readily used for accurate determinations of real time
changes in [Ca2+]
i during exocytosis.
High Performance Liquid Chromatography
High performance liquid chromatography (HPLC) with electrochemical detection can
be used as a valuable supplement to the real time measurement of vesicular release events
at single cells with amperometry or FSCV. The high selectivity and sensitivity of this
separation method allow for the simultaneous determination of multiple neurotransmitters
and metabolites in biologically complex mixtures such as tissue samples, individual cells,
and extracellular media. The initial experiments in this field used open tubular liquid
chromatography with electrochemical detection to quantitatively determine the presence of
dopamine, serotonin, tyrosine, and tryptophan at the femtomolar level in single cells of the
land snail, Helix aspersa (Kennedy and Jorgenson, 1989). Further experiments utilized
reverse phase HPLC with packed microcolumns to quantitate both the E and NE content of
and secretion from individual bovine chromaffin cells and to measure the histamine and
serotonin content of single rat peritoneal mast cells (Cooper et al., 1992; Cooper et al.,
1994; Pihel et al., 1995). The switch from open tubular columns to packed microcolumns
permitted greater retention and separation, of polar compounds like the catecholamines.
Combining HPLC determination of cellular neurotransmitter content with amperometric or
FSCV measurement of vesicular events at single cells provides a more complete
understanding of the related processes of transmitter synthesis, storage, and release by
exocytosis.
Dissertation Overview
The following chapters discuss the use of the electrochemical and supporting
techniques described above to study exocytosis at single cells. In Chapter 2, amperometry
and fluorescent Ca2+ imaging at isolated midbrain dopamine neurons were used to examine
the cellular mechanisms behind somatodendritic dopamine release. Chapters 3 and 4 both
describe collaborative efforts to investigate potential changes in regulated exocytosis at
several transgenic mouse lines. FSCV, amperometry, and fluorescent Ca2+ imaging were
used to characterize biogenic amine release in mice lacking the mitochondrial uncoupling
protein UCP2 and in mouse models of obesity and fragile X syndrome. Chapter 5 describes
the electrochemistry of three trace amines at carbon-fiber microelectrodes using FSCV. The
FSCV techniques developed in Chapter 5 were then employed in Chapter 6 to explore the
References
Amatore C, Maisonhaute E (2005) When voltammetry reaches nanoseconds. Anal Chem 77:303A-311A.
Amatore C, Arbault S, Guille M, Lemaitre F (2008) Electrochemical monitoring of single cell secretion: vesicular exocytosis and oxidative stress. Chem Rev 108:2585-2621.
Araki S, Kikuchi A, Hata Y, Isomura M, Takai Y (1990) Regulation of reversible binding of smg p25A, a ras p21-like GTP-binding protein, to synaptic plasma membranes and vesicles by its specific regulatory protein, GDP dissociation inhibitor. J Biol Chem 265:13007-13015.
Bahler M, Greengard P (1987) Synapsin I bundles F-actin in a phosphorylation-dependent manner. Nature 326:704-707.
Bath BD, Michael DJ, Trafton BJ, Joseph JD, Runnels PL, Wightman RM (2000) Subsecond adsorption and desorption of dopamine at carbon-fiber microelectrodes. Anal Chem 72:5994-6002.
Becherer U, Moser T, Stuhmer W, Oheim M (2003) Calcium regulates exocytosis at the level of single vesicles. Nat Neurosci 6:846-853.
Bekkers JM, Richerson GB, Stevens CF (1990) Origin of variability in quantal size in cultured hippocampal neurons and hippocampal slices. Proc Natl Acad Sci U S A 87:5359-5362.
Bellocchio EE, Reimer RJ, Fremeau RT, Jr., Edwards RH (2000) Uptake of glutamate into synaptic vesicles by an inorganic phosphate transporter. Science 289:957-960.
Benfenati F, Bahler M, Jahn R, Greengard P (1989a) Interactions of synapsin I with small synaptic vesicles: distinct sites in synapsin I bind to vesicle phospholipids and vesicle proteins. J Cell Biol 108:1863-1872.
Benfenati F, Greengard P, Brunner J, Bahler M (1989b) Electrostatic and hydrophobic interactions of synapsin I and synapsin I fragments with phospholipid bilayers. J Cell Biol 108:1851-1862.
Benfenati F, Valtorta F, Chieregatti E, Greengard P (1992) Interaction of free and synaptic vesicle-bound synapsin I with F-actin. Neuron 8:377-386.
Borst JG, Sakmann B (1996) Calcium influx and transmitter release in a fast CNS synapse. Nature 383:431-434.
Bruns D, Jahn R (1995) Real-time measurement of transmitter release from single synaptic vesicles. Nature 377:62-65.
Burgoyne RD, Cheek TR (1987) Reorganisation of peripheral actin filaments as a prelude to exocytosis. Biosci Rep 7:281-288.
Burgoyne RD, Morgan A (2003) Secretory granule exocytosis. Physiol Rev 83:581-632.
Cahill PS, Walker QD, Finnegan JM, Mickelson GE, Travis ER, Wightman RM (1996) Microelectrodes for the measurement of catecholamines in biological systems. Anal Chem 68:3180-3186.
Chaudhry FA, Edwards RH, Fonnum F (2008) Vesicular neurotransmitter transporters as targets for endogenous and exogenous toxic substances. Annu Rev Pharmacol Toxicol 48:277-301.
Chen TK, Luo G, Ewing AG (1994) Amperometric monitoring of stimulated catecholamine release from rat pheochromocytoma (PC12) cells at the zeptomole level. Anal Chem 66:3031-3035.
Chi P, Greengard P, Ryan TA (2003) Synaptic vesicle mobilization is regulated by distinct synapsin I phosphorylation pathways at different frequencies. Neuron 38:69-78.
Chow RH, von Ruden L, Neher E (1992) Delay in vesicle fusion revealed by electrochemical monitoring of single secretory events in adrenal chromaffin cells. Nature 356:60-63.
Cooper BR, Wightman RM, Jorgenson JW (1994) Quantitation of epinephrine and norepinephrine secretion from individual adrenal medullary cells by microcolumn high-performance liquid chromatography. J Chromatogr B Biomed Appl 653:25-34.
Cooper BR, Jankowski JA, Leszczyszyn DJ, Wightman RM, Jorgenson JW (1992) Quantitative determination of catecholamines in individual bovine adrenomedullary cells by reversed-phase microcolumn liquid chromatography with electrochemical detection. Anal Chem 64:691-694.
De Camilli P, Benfenati F, Valtorta F, Greengard P (1990) The synapsins. Annu Rev Cell Biol 6:433-460.
Deak F, Xu Y, Chang WP, Dulubova I, Khvotchev M, Liu X, Sudhof TC, Rizo J (2009) Munc18-1 binding to the neuronal SNARE complex controls synaptic vesicle priming. J Cell Biol 184:751-764.
Erickson JD, Eiden LE, Hoffman BJ (1992) Expression cloning of a reserpine-sensitive vesicular monoamine transporter. Proc Natl Acad Sci U S A 89:10993-10997.
Erickson JD, Schafer MK, Bonner TI, Eiden LE, Weihe E (1996) Distinct pharmacological properties and distribution in neurons and endocrine cells of two isoforms of the human vesicular monoamine transporter. Proc Natl Acad Sci U S A 93:5166-5171.
Fernandez-Chacon R, Konigstorfer A, Gerber SH, Garcia J, Matos MF, Stevens CF, Brose N, Rizo J, Rosenmund C, Sudhof TC (2001) Synaptotagmin I functions as a calcium regulator of release probability. Nature 410:41-49.
Finnegan JM, Pihel K, Cahill PS, Huang L, Zerby SE, Ewing AG, Kennedy RT, Wightman RM (1996) Vesicular quantal size measured by amperometry at chromaffin, mast, pheochromocytoma, and pancreatic beta-cells. J Neurochem 66:1914-1923.
glutamate transporters defines two classes of excitatory synapse. Neuron 31:247-260.
Fremeau RT, Jr., Burman J, Qureshi T, Tran CH, Proctor J, Johnson J, Zhang H, Sulzer D, Copenhagen DR, Storm-Mathisen J, Reimer RJ, Chaudhry FA, Edwards RH (2002) The identification of vesicular glutamate transporter 3 suggests novel modes of signaling by glutamate. Proc Natl Acad Sci U S A 99:14488-14493.
Fujita T (1977) Concept of paraneurons. Arch Histol Jpn 40 Suppl:1-12.
Garcia AG, Garcia-De-Diego AM, Gandia L, Borges R, Garcia-Sancho J (2006) Calcium signaling and exocytosis in adrenal chromaffin cells. Physiol Rev 86:1093-1131.
Grynkiewicz G, Poenie M, Tsien RY (1985) A new generation of Ca2+ indicators with greatly improved fluorescence properties. J Biol Chem 260:3440-3450.
Gunter TE, Pfeiffer DR (1990) Mechanisms by which mitochondria transport calcium. Am J Physiol 258:C755-786.
Hanson PI, Roth R, Morisaki H, Jahn R, Heuser JE (1997) Structure and conformational changes in NSF and its membrane receptor complexes visualized by quick-freeze/deep-etch electron microscopy. Cell 90:523-535.
Harata NC, Aravanis AM, Tsien RW (2006) Kiss-and-run and full-collapse fusion as modes of exo-endocytosis in neurosecretion. J Neurochem 97:1546-1570.
Hata Y, Slaughter CA, Sudhof TC (1993) Synaptic vesicle fusion complex contains unc-18 homologue bound to syntaxin. Nature 366:347-351.
Heien ML, Johnson MA, Wightman RM (2004) Resolving neurotransmitters detected by fast-scan cyclic voltammetry. Anal Chem 76:5697-5704.
Hosaka M, Sudhof TC (1998a) Synapsin III, a novel synapsin with an unusual regulation by Ca2+. J Biol Chem 273:13371-13374.
Hosaka M, Sudhof TC (1998b) Synapsins I and II are ATP-binding proteins with differential Ca2+ regulation. J Biol Chem 273:1425-1429.
Howell JO, Kuhr WG, Ensman RE, Mark Wightman R (1986) Background subtraction for rapid scan voltammetry. Journal of Electroanalytical Chemistry 209:77-90.
Huang L, Shen H, Atkinson MA, Kennedy RT (1995) Detection of exocytosis at individual pancreatic beta cells by amperometry at a chemically modified microelectrode. Proc Natl Acad Sci U S A 92:9608-9612.
Jahn R, Lang T, Sudhof TC (2003) Membrane fusion. Cell 112:519-533.
Johnston PA, Archer BT, 3rd, Robinson K, Mignery GA, Jahn R, Sudhof TC (1991) rab3A attachment to the synaptic vesicle membrane mediated by a conserved polyisoprenylated carboxy-terminal sequence. Neuron 7:101-109.
Kawagoe KT, Zimmerman JB, Wightman RM (1993) Principles of voltammetry and microelectrode surface states. J Neurosci Methods 48:225-240.
Kennedy RT, Jorgenson JW (1989) Quantitative analysis of individual neurons by open tubular liquid chromatography with voltammetric detection. Anal Chem 61:436-441.
Leszczyszyn DJ, Jankowski JA, Viveros OH, Diliberto EJ, Jr., Near JA, Wightman RM (1990) Nicotinic receptor-mediated catecholamine secretion from individual chromaffin cells. Chemical evidence for exocytosis. J Biol Chem 265:14736-14737.
Leszczyszyn DJ, Jankowski JA, Viveros OH, Diliberto EJ, Jr., Near JA, Wightman RM (1991) Secretion of catecholamines from individual adrenal medullary chromaffin cells. J Neurochem 56:1855-1863.
Liu Y, Peter D, Roghani A, Schuldiner S, Prive GG, Eisenberg D, Brecha N, Edwards RH (1992) A cDNA that suppresses MPP+ toxicity encodes a vesicular amine transporter. Cell 70:539-551.
Livett BG (1984) Adrenal medullary chromaffin cells in vitro. Physiol Rev 64:1103-1161.
Llinas R, Sugimori M, Silver RB (1992) Microdomains of high calcium concentration in a presynaptic terminal. Science 256:677-679.
Maycox PR, Deckwerth T, Hell JW, Jahn R (1988) Glutamate uptake by brain synaptic vesicles. Energy dependence of transport and functional reconstitution in proteoliposomes. J Biol Chem 263:15423-15428.
McIntire SL, Reimer RJ, Schuske K, Edwards RH, Jorgensen EM (1997) Identification and characterization of the vesicular GABA transporter. Nature 389:870-876.
Meinrenken CJ, Borst JG, Sakmann B (2003) Local routes revisited: the space and time dependence of the Ca2+ signal for phasic transmitter release at the rat calyx of Held. J Physiol 547:665-689.
Michael D, Travis ER, Wightman RM (1998) Color images for fast-scan CV measurements in biological systems. Anal Chem 70:586A-592A.
Moore ED, Becker PL, Fogarty KE, Williams DA, Fay FS (1990) Ca2+ imaging in single living cells: theoretical and practical issues. Cell Calcium 11:157-179.
Morgan A, Burgoyne RD (1997) Common mechanisms for regulated exocytosis in the chromaffin cell and the synapse. Semin Cell Dev Biol 8:141-149.
Neher E (1998) Vesicle pools and Ca2+ microdomains: new tools for understanding their roles in neurotransmitter release. Neuron 20:389-399.
Pihel K, Schroeder TJ, Wightman RM (1994) Rapid and Selective Cyclic Voltammetric Measurements of Epinephrine and Norepinephrine as a Method To Measure Secretion from Single Bovine Adrenal Medullary Cells. Analytical Chemistry 66:4532-4537.
Pihel K, Hsieh S, Jorgenson JW, Wightman RM (1995) Electrochemical detection of histamine and 5-hydroxytryptamine at isolated mast cells. Anal Chem 67:4514-4521.
Pothos EN, Davila V, Sulzer D (1998) Presynaptic recording of quanta from midbrain dopamine neurons and modulation of the quantal size. J Neurosci 18:4106-4118.
Pothos EN, Larsen KE, Krantz DE, Liu Y, Haycock JW, Setlik W, Gershon MD, Edwards RH, Sulzer D (2000) Synaptic vesicle transporter expression regulates vesicle phenotype and quantal size. J Neurosci 20:7297-7306.
Rizzoli SO, Betz WJ (2005) Synaptic vesicle pools. Nat Rev Neurosci 6:57-69.
Rizzuto R, Bernardi P, Pozzan T (2000) Mitochondria as all-round players of the calcium game. J Physiol 529 Pt 1:37-47.
Rodriguez Del Castillo A, Lemaire S, Tchakarov L, Jeyapragasan M, Doucet JP, Vitale ML, Trifaro JM (1990) Chromaffin cell scinderin, a novel calcium-dependent actin filament-severing protein. Embo J 9:43-52.
Roe MW, Lemasters JJ, Herman B (1990) Assessment of Fura-2 for measurements of cytosolic free calcium. Cell Calcium 11:63-73.
Roghani A, Feldman J, Kohan SA, Shirzadi A, Gundersen CB, Brecha N, Edwards RH (1994) Molecular cloning of a putative vesicular transporter for acetylcholine. Proc Natl Acad Sci U S A 91:10620-10624.
Rybin V, Ullrich O, Rubino M, Alexandrov K, Simon I, Seabra MC, Goody R, Zerial M (1996) GTPase activity of Rab5 acts as a timer for endocytic membrane fusion. Nature 383:266-269.
Sagne C, El Mestikawy S, Isambert MF, Hamon M, Henry JP, Giros B, Gasnier B (1997) Cloning of a functional vesicular GABA and glycine transporter by screening of genome databases. FEBS Lett 417:177-183.
Schiebler W, Jahn R, Doucet JP, Rothlein J, Greengard P (1986) Characterization of synapsin I binding to small synaptic vesicles. J Biol Chem 261:8383-8390.
Schroeder TJ, Jankowski JA, Senyshyn J, Holz RW, Wightman RM (1994) Zones of exocytotic release on bovine adrenal medullary cells in culture. J Biol Chem 269:17215-17220.
Schroeder TJ, Borges R, Finnegan JM, Pihel K, Amatore C, Wightman RM (1996) Temporally resolved, independent stages of individual exocytotic secretion events. Biophys J 70:1061-1068.
Smith SM, Renden R, von Gersdorff H (2008) Synaptic vesicle endocytosis: fast and slow modes of membrane retrieval. Trends Neurosci 31:559-568.
Sollner T, Whiteheart SW, Brunner M, Erdjument-Bromage H, Geromanos S, Tempst P, Rothman JE (1993) SNAP receptors implicated in vesicle targeting and fusion. Nature 362:318-324.
Squire LR (2008) Fundamental neuroscience, 3rd Edition. Amsterdam ; Boston: Academic Press/Elsevier.
Sudhof TC (2004) The synaptic vesicle cycle. Annu Rev Neurosci 27:509-547.
Takamori S, Rhee JS, Rosenmund C, Jahn R (2000) Identification of a vesicular glutamate transporter that defines a glutamatergic phenotype in neurons. Nature 407:189-194.
Verkhratsky A (2004) Endoplasmic reticulum calcium signaling in nerve cells. Biol Res 37:693-699.
Villanueva M, Thornley K, Augustine GJ, Wightman RM (2006) Synapsin II negatively regulates catecholamine release. Brain Cell Biol 35:125-136.
Wang YM, Gainetdinov RR, Fumagalli F, Xu F, Jones SR, Bock CB, Miller GW, Wightman RM, Caron MG (1997) Knockout of the vesicular monoamine transporter 2 gene results in neonatal death and supersensitivity to cocaine and amphetamine. Neuron 19:1285-1296.
Weber T, Zemelman BV, McNew JA, Westermann B, Gmachl M, Parlati F, Sollner TH, Rothman JE (1998) SNAREpins: minimal machinery for membrane fusion. Cell 92:759-772.
Wightman RM, Jankowski JA, Kennedy RT, Kawagoe KT, Schroeder TJ, Leszczyszyn DJ, Near JA, Diliberto EJ, Jr., Viveros OH (1991) Temporally resolved catecholamine spikes correspond to single vesicle release from individual chromaffin cells. Proc Natl Acad Sci U S A 88:10754-10758.
Xu J, Mashimo T, Sudhof TC (2007) Synaptotagmin-1, -2, and -9: Ca(2+) sensors for fast release that specify distinct presynaptic properties in subsets of neurons. Neuron 54:567-581.
Chapter 2
Origins of Extrasynaptic Dopamine Release
Introduction
In the classical model of neurotransmission, electrochemical signals are propagated
in a unidirectional manner: a neuron receives information from incoming synaptic terminals
at its dendrites, processes the information at the cell body, and then passes the information
down its axon to terminals that form synapses with the next cell in the pathway. Over the
past few decades the classical model has been shown to be incomplete, as a wealth of
evidence has accumulated demonstrating that the somatodendritic region of neurons is
capable of synthesizing, storing, and releasing chemical neurotransmitters.
As far back as 1975, glyoxylic acid-induced histofluorescence was used to show the
accumulation and storage of dopamine in the dendrites of substantia nigra (SN) neurons
(Bjorklund and Lindvall, 1975). Similar to the storage of dopamine at axon terminals, this
accumulation was blocked by reserpine, an inhibitor of the vesicular monoamine transporter
(VMAT2). Shortly thereafter, experiments with radio-labeled dopamine revealed both
spontaneous and depolarization-evoked release in the SN from in vivo and in vitro
preparations (Geffen et al., 1976; Nieoullon et al., 1977). More recently, electrochemical
techniques have been used to make direct, real-time measurements of dopamine release in
somatodendritic regions. Amperometry has been used to detect quantal release events
from the cell bodies of SN neurons in slices of rat brain (Jaffe et al., 1998), while fast scan

![Figure 1.3. Intracellular Ca 2+ regulation in an adrenal chromaffin cell. Ca 2+ entry through voltage-gated calcium channels (VOCC) and/or release from the ER generates a local microdomain of high [Ca 2+ ]](https://thumb-us.123doks.com/thumbv2/123dok_us/8323948.2206858/23.918.216.731.108.729/figure-intracellular-regulation-chromaffin-channels-release-generates-microdomain.webp)