Dietary determinants of cadmium exposure in the Strong Heart
Family Study
Pablo Olmedo1,2,*, Maria Grau-Perez1,2, Amanda Fretts3, Maria Tellez-Plaza1,4, Fernando Gil5, Fawn Yeh6, Jason G. Umans7, Kevin A. Francesconi8, Walter Goessler8, Nora Franceschini9, Elisa T. Lee6, Lyle G. Best10, Shelley A. Cole11, Barbara V. Howard12, and Ana Navas-Acien1,2,13,14
1Department of Environmental Health Sciences. Johns Hopkins Bloomberg School of Public
Health, Baltimore, MD, USA
2Department of Environmental Health Sciences, Mailman School of Public Health, Columbia
University, New York, NY, USA
3Department of Epidemiology. University of Washington School of Public Health, Seattle, WA,
USA
4Fundación de Investigación Hospital Clínico de Valencia INCLIVA, Valencia, Spain
5Department of Legal Medicine and Toxicology. School of Medicine, University of Granada, Spain
6Center for American Indian Health Research, College of Public Health, University of Oklahoma
Health Sciences Center, Oklahoma City, OK, USA
7Department of Medicine, Georgetown University Medical Center, Washington, DC, USA
8Institute of Chemistry -Analytical Chemistry, University of Graz, Austria
9Department of Epidemiology, University of North Carolina Gillings School of Global Public
Health, Chapel Hill, NC, USA
10Missouri Breaks Industries Research, Inc., Timber Lake, SD, USA
11Department of Genetics, Texas Biomedical Research Institute, San Antonio, TX, USA
12MedStar Health Research Institute, Hyattsville, MD, USA
13Department of Epidemiology, Johns Hopkins Bloomberg School of Public Health, Baltimore,
MD, USA
14Welch Center for Prevention, Epidemiology and Clinical Research, Johns Hopkins Bloomberg
School of Public Health, Baltimore, MD, USA
*Corresponding Author: Pablo Olmedo, PhD., Department of Environmental Health Sciences, Columbia University Mailman School
of Public Health, 722 West 168th St., New York, NY 10032, Telephone number: 667-212-9916, [email protected]. Publisher's Disclaimer: This is a PDF file of an unedited manuscript that has been accepted for publication. As a service to our customers we are providing this early version of the manuscript. The manuscript will undergo copyediting, typesetting, and review of the resulting proof before it is published in its final citable form. Please note that during the production process errors may be discovered which could affect the content, and all legal disclaimers that apply to the journal pertain.
HHS Public Access
Author manuscript
Food Chem Toxicol
. Author manuscript; available in PMC 2018 February 01.Published in final edited form as:
Food Chem Toxicol. 2017 February ; 100: 239–246. doi:10.1016/j.fct.2016.12.015.
A
uthor Man
uscr
ipt
A
uthor Man
uscr
ipt
A
uthor Man
uscr
ipt
A
uthor Man
uscr
Abstract
Urinary cadmium (Cd) concentrations in the Strong Heart Family Study (SHFS) participants are higher than in the general US population. This difference is unlikely to be related to tobacco smoking. We evaluated the association of consumption of processed meats and other dietary products with urinary Cd concentrations in the SHFS, a family-based study conducted in American Indian communities. We included 1725 participants with urine Cd concentrations (standardized to urine creatinine) and food frequency questionnaire data grouped in 24 categories, including processed meat. Median (IQR) urinary Cd concentrations were 0.44 (0.20–0.85) μg/g creatinine. The age, sex, smoking, education, center, body mass index, and total kcal adjusted geometric mean ratio (GMR) (95%CI) of urinary cadmium concentrations per IQR increase in each dietary category was 1.16 (1.04–1.29) for processed meat, 1.10 (1.00–1.21) for fries and chips, 0.87 (0.80–0.95) for dairy products, and 0.89 (0.82–0.97) for fruit juices. The results remained similar after further adjustment for the dietary categories associated with urinary Cd in the previous model except for fries and chips, which was no longer statistically significant. These findings revealed the potential importance of processed meat products as a dietary source of cadmium.
Keywords
American Indians; Cadmium; Diet; Meat; Association Analysis; Epidemiology
1. Introduction
Cadmium is a toxic metal with multiple health effects including kidney disease, bone fragility, cardiovascular disease and several cancers even at low exposure levels (Tellez-Plaza et al., 2013a; Tellez-(Tellez-Plaza et al., 2013b; García-Esquinas et al., 2014). Cadmium half-life in the body is extremely long (20–35 years) due to its cumulative capacity and binding to different proteins, especially in the kidneys and liver (Jomova and Valko, 2011). Tobacco is a major source of cadmium exposure in humans (Gil et al., 2011), as tobacco leaves bio-concentrate cadmium, which is then absorbed through the lungs during smoking. In non-smokers, the diet is the main source of cadmium (ATSDR, 2012) including root and leafy vegetables (e.g. potatoes, lettuce or spinach) (EFSA, 2009; Llobet et al., 2003), shellfish (e.g. clams or mussels) (Olmedo et al., 2013) and organ meats (e.g. liver or kidneys) (Jokanović et al., 2013).
The characterization and prevention of cadmium exposures are warranted, especially in disproportionately exposed populations. In the Strong Heart Study (SHS), a population-based prospective cohort study conducted in American Indian communities in Arizona, Oklahoma and North and South Dakota, baseline urinary cadmium concentrations were markedly higher in the study participants compared to the general US population, even among never smokers (Tellez-Plaza et al., 2013b, Pang et al., 2016). These findings suggest there are unaccounted sources of cadmium exposure in the SHS population. Fretts et al. (2012) have reported a high consumption of processed meats in the SHS communities (68% participants consumed at least 3 servings of processed meats per week). Processed meat products, commonly consumed by low-income families due to its low price, could constitute
A
uthor Man
uscr
ipt
A
uthor Man
uscr
ipt
A
uthor Man
uscr
ipt
A
uthor Man
uscr
a relevant source of cadmium exposure as they contain heavily processed animal tissues, some of them potentially including organ meats. Several types of processed meats have historically been distributed free of charge by U.S. Department of Agriculture food assistance program in some Indian reservations and this distribution influences their diet (Smith et al., 1996; Taylor et al., 2006; Vaughan et al. 1997).
Baseline urinary cadmium concentrations, a biomarker of long-term exposure, were positively associated with incident cardiovascular disease in the SHS, even among non-smokers (Tellez-Plaza et al., 2013b). The goal of this study was to assess the association of different foods, with a specific interest on processed meat products, with urinary cadmium concentrations in the Strong Heart Family Study (SHFS), a family-based extension of the SHS that included a detailed food frequency questionnaire and urinary cadmium measures during the 2001–2003 visit. Our main hypothesis was that higher frequency and amount of processed meat consumption is associated with higher cadmium concentrations in urine. Given relatively high urinary cadmium concentrations in the SHS communities and its associated health effects, identifying relevant sources of exposure is critical for the development of prevention interventions.
2. Materials and methods
2.1. Study population
The SHFS is a multigenerational cohort recruited from the SHS (North et al., 2002). Families were eligible if they had a core sibship consisting of 3 original SHS participants and at least 5 additional living family members. During the 2001–2003 baseline visit, 2474 SHFS participants (15 years of age and older) were recruited who were free of diabetes at baseline and had urine metal concentrations measured as part of an ancillary study to evaluate gene-environment interactions for incident diabetes. We only included participants with dietary data available (n=2188). We excluded 1 participant with missing urinary creatinine, 3 participants with abnormal concentrations of creatinine-corrected urine cadmium (concentrations 24, 30 and 200 times higher than the 90th percentile), and participants with missing values of educational level (n=8), body mass index (n=7), and smoking status (n=1). We further excluded 443 participants from a community that has withdrawn their permission to conduct research in 2016, leaving a total of 1725 participants in this analysis (see participant flow chart in Supplemental Figure 1).
The study protocol was approved by the institutional review boards of the Indian Health Service, the participating institutions and the participating tribes. All participants provided written informed consent.
2.2. Food frequency questionnaire
An interviewer-administered Block 119-item Food Frequency Questionnaire (FFQ) was used to measure usual food intake as previously described (Fretts et al., 2012). Serving sizes, described as standard units (e.g., 1 banana, 2 eggs, etc.) or standard volume/weight portions, were assessed using photographs of various portions as visual aids. Each participant was asked how often, on average, a particular food was consumed during the past year. The
A
uthor Man
uscr
ipt
A
uthor Man
uscr
ipt
A
uthor Man
uscr
ipt
A
uthor Man
uscr
quantity was assessed using frequency measures of consumption (seasonally, never, a few times per year, once per month, 2–3 times/mo, once per week, twice per week, 2–3 times/wk, 5–6 times/wk, daily) and adjusted for portion size (small, medium, or large). In addition to standard Block FFQ food items, the FFQ included foods commonly consumed among American Indians such as menudo, pozole, guysava, red or green chili, Indian taco, fry bread, corn tortilla, flour tortilla, and “spam” (a term that refers to canned meats, usually a combination of heavily processed beef or pork meats, salt, sodium nitrate, potato starch and water).
Average daily energy and macronutrient intakes were calculated for each study participant by using the Block database (Block Dietary Systems). To obtain measures of average daily energy and nutrient intake, the frequency response for each food on the FFQ and American Indians supplementary foods questionnaire was multiplied by the nutrient content of the documented portion size of the food, then summed for all foods (Block et al., 1998).
The food items in the FFQ were grouped in 24 different categories according to their potential cadmium content based on data on cadmium concentrations in US foods from the Total Diet Study Market Baskets 2006 through 2011 conducted by the US Food and Drug Administration (FDA, 2014). As an example, leafy vegetables, fries and chips, nuts and seeds, organ meat and processed meat had their own categories. For instance, the
classification of fries and chips together and separated from boiled or baked potatoes is due to different levels of cadmium concentrations in these modalities of potato preparation. The specific food stuffs included in each category is displayed in Supplemental Table 1. For processed meats, for instance, our goal was to include meats made of mixed parts of the animal and for that reason we did not include bacon or hamburgers. Total intake for each food category was expressed as grams (g) consumed per day (Supplemental Figure 2).
2.3. Urine cadmium
Spot urine samples from baseline were collected in polypropylene tubes, frozen within 1 to 2 hours of collection, shipped buried in dry ice and stored in freezers at −70°C in the Penn Medical Laboratory, MedStar Research Institute, Washington, DC. Strict controls on the sampling, transport and storage of urine were conducted to ensure study quality (Strong Heart Study, 1991). The analyses of cadmium and other metals were performed by Inductively Coupled Plasma Mass Spectrometry ICP-MS (Agilent 7700x ICP-MS, Agilent Technologies, Waldbronn, Germany) and urine samples have already been used to measure creatinine and albumin (Tellez-Plaza et al, 2013b; Scheer et al., 2012). The inter-assay and the intra-assay coefficients of variation for urinary cadmium concentrations were 8.7% and 4.5%, respectively. Standard reference materials (National Institute of Standards and Technology, NIST 1640a and 1643e) were used to test the accuracy of the analyses. The limit of detection for urine cadmium was 0.015 μg/L (and the corresponding limit of quantification is 0.050 μg/L), but our limit of detection is estimated conservatively so we kept all values provided by the method above the limit of detection. A total of 87 (5.05%) samples were below the limit of detection and were replaced by the limit of detection divided by the square root of two.
A
uthor Man
uscr
ipt
A
uthor Man
uscr
ipt
A
uthor Man
uscr
ipt
A
uthor Man
uscr
2.4. Other variables
Study visits were performed by trained and certified staff following a standard protocol (Lee et al., 1990). Sociodemographic (age, sex, region and education) and lifestyle information (smoking status) were obtained by questionnaire during the interview. Body mass index was calculated from measured weight (kg) divided by measured height (m2). Kcal per day were obtained from the FFQ based on total grams of food estimated per day. To account for urine dilution, urine cadmium was divided by urine creatinine (μg per g of urine creatinine). Urine creatinine was measured at the Laboratory of the National Institute of Diabetes and
Digestive and Kidney Disease, Epidemiology and Clinical Research Branch (Phoenix, AZ) by an alkaline picrate rate method (Lee et al., 1990).
2.5. Statistical analysis
Urine cadmium corrected for urinary creatinine and intake of dietary variables were right-skewed and log-transformed to improve normality. We described the participant
characteristics across urine cadmium quartiles and assessed the differences between groups using Kruskal-Wallis tests for continuous variables and χ2 tests for categorical variables.
To assess the association between cadmium exposure and the different food categories, including processed meats, we estimated geometric mean ratios (GMRs) and corresponding 95% confidence intervals (95% CI) of urinary cadmium concentrations for an interquartile range increase in daily intake for each food type modeled. We used generalized estimating equations (GEE) to account for the lack of independence among family members. We presented the results in two models progressively adjusted. Model 1 was initially adjusted for age (continuous), gender (male/female), educational level (more/less than 12 years or education), body mass index (continuous), smoking status (never/former/current), center (Arizona/Oklahoma/North and South Dakota) and total Kcal per day (continuous). Model 2 was further adjusted for other foods showing a significant association with urinary cadmium concentrations in Model 1 as well as with other food categories established as potential sources of cadmium exposure (see Supplemental Table 2), independently of statistical significance. To allow for a flexible evaluation of the dose-response, we also graphically described the association between cadmium and the food type based on restricted quadratic splines with knots at 10th, 50th, and 90th percentiles of each intake distribution, with the 10th percentile as the reference.
To evaluate the robustness of the results, we re-run the analyses with the dietary variables in the original scale instead as of log-transformed, with essentially identical results. We also run additional sensitivity analyses further adjusting for cigarette pack-years, smokeless tobacco products and exposure to secondhand tobacco smoke, with similar findings (Supplemental Table 3). We also conducted analyses stratified by sex and smoking status. All analyses were conducted with R software, version 3.1.2, the significance level was set at 0.05 and all tests were two-sided.
A
uthor Man
uscr
ipt
A
uthor Man
uscr
ipt
A
uthor Man
uscr
ipt
A
uthor Man
uscr
3. Results
Median (IQR) urinary cadmium concentrations were 0.44 (0.20–0.85) μg/g creatinine (0.31 (0.15–0.58) for men and 0.56 (0.27–1.02) for women). Participants with higher urinary cadmium concentrations were more likely to be older, women, more educated, current smokers, consume less Kcal per day and to be from North and South Dakota (Table 1). Before any adjustment, the food categories positively associated with urinary cadmium concentrations (p<0.05) were organ meat, leafy vegetables, root vegetables, non-alcoholic drinks, and oil and fat; food categories negatively associated with urinary cadmium concentrations were dairy products and fruit juices. Medians (IQR) intake in g/day were 23 (11–49) for processed meat, 27 (11–63) for fries and chips, 108 (38–268) for dairy products, and 140 (47–356) for fruit juices. Processed meat intake was weakly positively correlated with the intake of fries and chips (Spearman correlation coefficient of 0.20) (Supplemental Table 4). Dairy products and fruit juice intake were weakly positively correlated (Spearman correlation coefficient 0.24). Median (IQR) processed meat consumption was 20.9 (9.9, 41.0) for never smokers and 26.9 (11.9, 55.2) for ever smokers, respectively (p-value <0.001).
As seen in Table 2, after adjustment for sociodemographic and other participant
characteristics (Model 1) the GMR (95% CI) of urinary cadmium for an interquartile range in log-transformed g/day for each food group was 1.16 (1.04, 1.29) for processed meat products, 1.10 (1.00, 1.21) for fries and chips, 0.87 (0.80, 0.95) for dairy products and 0.89 (0.82, 0.97) for fruit juices. After further adjustment for the food categories associated with urinary cadmium in model 1 (processed meat products, fries and chips, dairy products and fruit juices) and for food categories known to have higher cadmium concentrations (organ meat, leafy vegetables, and baked and mashed potatoes) processed meat products remained associated with higher urinary cadmium concentrations (GMR 1.15, 95% CI 1.03–1.28), while dairy products (GMR 0.88, 95% CI 0.80–0.97) and fruit juices (GMR 0.91, 95% CI 0.83–0.99) remained associated with lower urinary cadmium concentrations (Model 2). In analysis stratified by sex (Table 3), the association of urinary cadmium with processed meat consumption was higher in males (GMR 1.31 95% CI 1.08–1.60) than in females (GMR 1.07 95% CI 0.95–1.20) (p-value for interaction 0.05). The negative associations between urinary cadmium concentrations and dairy products and fruit juices was also stronger in males compared to females. In analyses stratified by smoking status (Table 3), the
association between cadmium and processed meat was stronger in ever smokers (GMR 1.23 95% CI 1.06–1.44) compared to never smokers (GMR 1.07 95% CI 0.92–1.25) although the interaction was not significant (p-value 0.46), while dairy products and fruit juices displayed similar results in ever and never smokers.
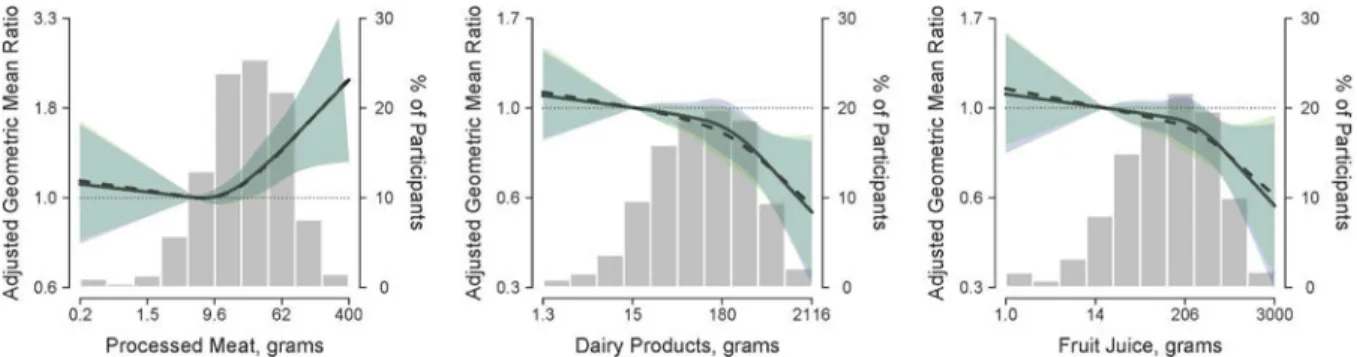
In flexible evaluations of the dose-response, processed meat intake was associated with increased urinary cadmium concentrations only at levels of consumption higher than 9.6 g/day (Figure 1). Dairy products and fruit juice showed an inverse association throughout the range of intake, although the decrease in urinary cadmium concentrations became more accentuated after around 180 g/day for dairy products and 206 g/day of fruit juices. The associations of cadmium with processed meats, dairy products and fruit juice remained
A
uthor Man
uscr
ipt
A
uthor Man
uscr
ipt
A
uthor Man
uscr
ipt
A
uthor Man
uscr
similar in analyses allowing for effect modification by sex and smoking status (Supplemental Figure 3).
4. Discussion
The findings of this study support that the consumption of processed meat products are associated with higher cadmium concentrations in urine. The association was non-linear, being observed at a daily intake of processed meats above 9.6 g/day but not below that level. Other meat products evaluated (poultry, read meat, and organ meat) were not associated with higher urinary cadmium concentrations, supporting the specificity of the association with processed meat, not with other types of meat. The association was stronger among men and ever smokers, compared to women and never smokers, respectively, although the interaction by smoking status was not statistically significant. In this respect, the markedly weaker and non-statistically significant association among never smokers prevents this study to reach firm conclusions regarding the association between processed meat and cadmium exposure. Additional research is needed to assess whether our findings are due to confounding, maybe by smoking status or other sources of cadmium that could correlate with processed meat intake or whether high intake of this type of product contributes to cadmium exposure in the population. Dairy products and fruit juices, on the other hand, were associated with lower urinary cadmium concentrations.
Typically, organ meat (especially kidneys and liver) have been identified as the major type of meat products associated with cadmium exposure due to their capacity to accumulate cadmium (Hassan et al., 2012; López-Alonso et al., 2007). After adjustment for participant characteristics, we found no association between the consumption of organ meat and urinary cadmium concentrations. This can be explained by the relatively low consumption of organ meats in the study population (Table 1). Several studies have also found that despite the high concentration of cadmium in organ meats, their contribution to dietary cadmium is small due to their infrequent consumption. In Sweden, offal products provided only 4% of the total cadmium dietary intake in a postmenopausal women cohort (Julin et al., 2012), and in another Swedish study for nonsmoking participants living on farms, offal products contributed only 0.3% (range 0.5–3.6%) of dietary cadmium (Olsson et al., 2002).
Very few studies have evaluated the association between processed meat products or other types of meat and cadmium biomarkers. In Swedish adults, total meat intake, measured through a food frequency questionnaire, was related to blood cadmium concentrations, although the study did not distinguished between processed and non-processed meats (Bjermo et al., 2013). In children from the US, beef consumption (measured through a food frequency questionnaire which included hot dogs as one of the beef food items), was associated with blood cadmium concentrations (Davis et al., 2014). In 3 year-old children from Ukraine, on the other hand, eating one sausage or more per week was not associated with higher blood cadmium concentrations (Friedman et al., 2006). Our study constitutes one of the first studies specifically evaluating the potential importance of these processed meat products in cadmium exposure. It is unclear, however, why we observed a non-linear dose-response relationship or why the association was stronger in men and ever smokers. On one hand, this could be related to residual confounding by smoking, although our analyses
A
uthor Man
uscr
ipt
A
uthor Man
uscr
ipt
A
uthor Man
uscr
ipt
A
uthor Man
uscr
were robust to additional adjustment for cigarette pack-years, smokeless tobacco products, and secondhand smoke exposure. On the other hand, these differences could also be related by differences in the types of processed meats consumed, as it is possible that not all types of processed meats contribute to increased cadmium exposure.
Food categories that were associated with higher urinary cadmium concentrations in this study before adjustment for other foods included fries and chips. Several studies have identified potatoes and root vegetables as an important dietary contributor to cadmium exposure. In Sweden, a study in nonsmoking men and women living on farms estimated that potatoes and other roots provided 24% of the total dietary cadmium (Olsson et al., 2002), while a study in Swedish postmenopausal women estimated that potatoes provided 18% of total dietary cadmium intake (Julin et al., 2012). In the Total Diet Study by the FDA, fries and chips show higher concentrations of cadmium as compared to potatoes cooked with other cooking methods (FDA, 2014), which could be related to the lower water content of fries and chips. In our study, cereals such as wheat and rice, leafy vegetables, and nuts and seeds, foods that have been commonly reported as dietary sources of cadmium (FDA, 2014; Olsson et al., 2002, Tsukahara et al., 2003, Baldantoni et al., 2016), were not associated with increased urinary cadmium concentrations.
Dairy products and fruit juices showed an inverse association with urinary Cd
concentrations. Drinking milk has also been identified as inversely associated with urinary cadmium concentrations in a study in premenopausal women aged 40–45 years from the US (Adams et al., 2011). A similar inverse association of urinary cadmium with dairy products and fruit juices has been reported in US adults in a Dietary-Wide Association Study (DWAS) using NHANES and USDA data (Davis et al., 2014). Milk, cheese and yogurt were
associated with lower urinary or blood cadmium concentrations. Similarly, orange juice and apple juice (this one just with blood cadmium) were associated with lower blood and urinary cadmium concentrations (Davis et al., 2014). The reasons behind these inverse associations are unknown. Potentially, these products could decrease the gastro-intestinal absorption of cadmium. This is well known, for instance, for dairy products and lead, which is also a toxic divalent metal (de Almeida Lopes et al., 2015). An adequate supply of calcium can protect against cadmium toxicity symptoms (Peraza et al., 1998). Regarding fruit juices, one possible explanation could be related to increased vitamin C and the activation of the iron transporter which could result in increasing iron while decreasing cadmium uptake (Fox et al., 1980). Interestingly, vitamin C supplementation has been observed to reduce elevated cadmium concentrations in the kidneys and liver of pigs fed a copper-rich diet (Peraza et al., 1998). Unfortunately in our study we have no information on ferritin levels or iron stores.
This study has several strengths. The SHFS represents a unique resource to evaluate the dose-response relationship between processed meat consumption and urine cadmium concentrations due to the wide range of levels of processed meat consumption in the study population. Strengths of the study include state-of-the art methods to measure cadmium in urine with low limits of detection and the availability of dietary information (Scheer et al., 2012). The Block FFQ is one of the most widely used food questionnaires, showing reliability and validity (Block et al., 1992; Boucher et al., 2006; Caan et al., 1998; Subar et al., 2001). The inclusion of an ethnic foods section on the FFQ contributes considerably to
A
uthor Man
uscr
ipt
A
uthor Man
uscr
ipt
A
uthor Man
uscr
ipt
A
uthor Man
uscr
increase group mean nutrient estimates and can contribute to better food and energy intake estimates (Block et al., 2004).
A possible limitation is the lack of blood cadmium, a cadmium biomarker that has a shorter half-life than urine cadmium and that could be useful to evaluate together with urine cadmium concentrations. In the Strong Heart Family Study, however, only urine cadmium is available. Other limitations include the use of a single spot urine sample of cadmium determination as a biomarker of exposure and the lack of tobacco biomarkers. Regression-dilution bias due to non-differential measurement error in dietary assessment may have resulted in an underestimation of the associations. We also lack information on other environmental or occupational sources of cadmium in the population. Studies of other Native American populations from the US, Canada and Mexico have suggested that sources of cadmium include nearby contaminating factories and mining (Schmitt et al., 2006; Moon et al., 1986), and surface dust in jewelry-making homes (Gonzales et al., 2004). Another activity that could be relevant for cadmium exposure in our population is small-scale-motor vehicle repair (Yassin and Martonik, 2004).
5. Conclusions
Increased consumption of processed meat products was associated with increased urinary cadmium concentrations in the SHFS participants, although the association was weaker and non-statistically significant among never smokers. Increased consumption of milk products and fruit juices, on the other hand, was associated with lower urinary cadmium
concentrations. This study revealed the potential contribution of processed meat products to cadmium exposure and provides a possible explanation for the high concentrations of urinary cadmium in the population. Research is needed to confirm the association between processed meat products and cadmium biomarkers in other populations, as well as to evaluate the cadmium content of a diverse group of processed meat products, including those that are more frequently consumed in American Indian communities. Meanwhile, our findings support that promoting healthier dietary habits in American Indian communities, including the reduction of consumption of processed meats and increasing the intake of dairy and fruit juices, could contribute to reduce cadmium exposure.
Supplementary Material
Refer to Web version on PubMed Central for supplementary material.
Acknowledgments
This study was supported by cooperative agreement grants HL41642, HL41652, HL41654, U01-HL65520, and U01-HL65521, research grants R01-HL109315, R01HL109301, R01HL109284, R01HL109282 and R01HL109319 from the National Heart, Lung, and Blood Institute, Bethesda, MD, and research grants
R01ES021367 and R01ES025216 from the National Institute of Environmental Health Sciences. PO was supported by the Alfonso Martín Escudero Foundation (Postdoctoral Fellowship 2014) and MTP was supported by the Carlos III Health Institute (Instituto de Salud Carlos III) Madrid (CP12/03080), co-funded by the European Funds for Regional Development (FEDER).
We thank all the participating tribes, the Indian Health Service hospitals and clinics at each center, and the Strong Heart Study/SHFS staff.
A
uthor Man
uscr
ipt
A
uthor Man
uscr
ipt
A
uthor Man
uscr
ipt
A
uthor Man
uscr
References
Adams SV, Newcomb PA, Shafer MM, Atkinson C, Bowles EJ, Newton KM, Lampe JW. Sources of cadmium exposure among healthy premenopausal women. Sci Total Environ. 2011; 409(9):1632–7. [PubMed: 21333327]
ATSDR. Agency for Toxic Substances and Disease Registry. Public Health Statement for Cadmium. Sep. 2012 Internet: http://www.atsdr.cdc.gov/phs/phs.asp?id=46&tid=15 (accessed 9 August 2016) Baldantoni D, Morra L, Zaccardelli M, Alfani A. Cadmium accumulation in leaves of leafy vegetables.
Ecotoxicol Environ Saf. 2016; 123:89–94. [PubMed: 26004982]
Bjermo H, Sand S, Nälsén C, Lundh T, Enghardt Barbieri H, Pearson M, Lindroos AK, Jönsson BA, Barregård L, Darnerud PO. Lead, mercury, and cadmium in blood and their relation to diet among Swedish adults. Food Chem Toxicol. 2013; 57:161–9. [PubMed: 23537601]
Block G, Mandel R, Gold E. On food frequency questionnaires: the contribution of open-ended questions and questions on ethnic foods. Epidemiology. 2004; 15:216–21. [PubMed: 15127915] Block G, Thompson F, Hartman A, Larkin F, Guire K. Comparison of two dietary questionaires
validated against multiple dietary records collected during a 1-year period. J Am Diet Assoc. 1992; 92:686–93. [PubMed: 1607564]
Block, G., Wakimoto, P., Block, TA. Revision of the Block Dietary Questionnaire and database, based on NHANES III Data. 1998. Internet: http://www.nutritionquest.com/products/B98_DEV.pdf
(accessed 9 August 2016)
Boucher B, Cotterchio M, Kreiger N, Nadalin V, Block T, Block G. Validity and reliability of the Block 98 food frequency questionaire in a sample of Canadian women. Public Health Nutr. 2006; 9:84–93. [PubMed: 16480538]
Caan BJ, Slattery M, Potter J, Quesenberry C, Coates A, Schaffer D. Comparison of the Block and Willett self-administered semiquantitative food frequency questionaires with an interview-administered dietary food history. Am J Epidemiol. 1998; 148:1137–47. [PubMed: 9867257] Davis MA, Gilbert-Diamond D, Karagas MR, Li Z, Moore JH, Williams SM, Frost HR. A
Dietary-Wide Association Study (DWAS) of Environmental Metal Exposure in US Children and Adults. PLoS One. 2014; 9:e104768. [PubMed: 25198543]
de Almeida Lopes AC, Navas-Acien A, Zamoiski R, Silbergeld EK, Carvalho Mde F, Buzzo ML, Urbano MR, Martins Ada C Jr, Paoliello MM. Risk factors for lead exposure in adult population in southern Brazil. J Toxicol Environ Health A. 2015; 78(2):92–108. [PubMed: 25424618]
EFSA. European Food Safety Authority. The EFSA Journal. Vol. 980. Parma, Italy: 2009. Scientific opinion of the Panel on Contaminants in the Food Chain on a request from the European Commission on cadmium in food; p. 1-139.
FDA. US Food and Drug Administration. Total Diet Study Market Baskets 2006 through 2011. Version current 15 April, 2014. Internet: http://www.fda.gov/downloads/Food/FoodScienceResearch/ TotalDietStudy/UCM184301.pdf (accessed 9 August 2016)
Fox MR, Jacobs RM, Jones AO, Fry BE Jr, Stone CL. Effects of vitamin C and iron and cadmium metabolism. Ann N Y Acad Sci. 1980; 355:249–61. [PubMed: 6940479]
Fretts AM, Howard BV, McKnight B, Duncan GE, Beresford SA, Mete M, Eilat-Adar S, Zhang Y, Siscovick DS. Associations of processed meat and unprocessed red meat intake with incident diabetes: the Strong Heart Family Study. Am J Clin Nutr. 2012; 95:752–8. [PubMed: 22277554] Friedman LS, Lukyanova EM, Kundiev YI, Shkiryak-Nizhnyk ZA, Chislovska NV, Mucha A,
Zvinchuk AV, Oliynyk I, Hryhorczuk D. Anthropometric, environmental, and dietary predictors of elevated blood cadmium levels in Ukrainian children: Ukraine ELSPAC group. Environ Res. 2006; 102(1):83–9. [PubMed: 16729996]
García-Esquinas E, Pollan M, Tellez-Plaza M, Francesconi KA, Goessler W, Guallar E, Umans JG, Yeh J, Best LG, Navas-Acien A. Cadmium exposure and cancer mortality in a prospective cohort: the strong heart study. Environ Health Perspect. 2014; 122:363–70. [PubMed: 24531129] Gil F, Hernández AF, Márquez C, Femia P, Olmedo P, López-Guarnido O, Pla A. Biomonitorization of
cadmium, chromium, manganese, nickel and lead in whole blood, urine, axillary hair and saliva in an occupationally exposed population. Sci Total Environ. 2011; 409:1172–80. [PubMed:
21211822]
A
uthor Man
uscr
ipt
A
uthor Man
uscr
ipt
A
uthor Man
uscr
ipt
A
uthor Man
uscr
Gonzales M, Shah V, Bobelu A, Qualls C, Natachu K, Bobelu J, Jamon E, Neha D, Paine S, Zager P. Concentrations of surface-dust metals in Native American jewelry-making homes in Zuni Pueblo, New Mexico. Arch Environ Health. 2004; 59(5):245–9. [PubMed: 16201670]
Hassan AA, Rylander C, Brustad M, Sandanger TM. Level of selected toxic elements in meat, liver, tallow and bone marrow of young semi-domesticated reindeer (Rangifer tarandus tarandus L) from Northern Norway. Int J Circumpolar Health. 2012; 71:1–7.
Jokanović MR, Tomović VM, Šojić BV, Škaljac SB, Tasić TA, Ikonić PM, Kevrešan ŽS. Cadmium in meat and edible offal of free-range reared Swallow-belly Mangulica pigs from Vojvodina (northern Serbia). Food Addit Contam Part B Surveill. 2013; 6:98–102. [PubMed: 24779873]
Jomova K, Valko M. Advances in metal-induced oxidative stress and human disease. Toxicology. 2011; 283(2–3):65–87. [PubMed: 21414382]
Julin B, Wolk A, Bergkvist L, Bottai M, Akesson A. Dietary cadmium exposure and risk of postmenopausal breast cancer: a population-based prospective cohort study. Cancer Res. 2012; 72(6):1459–66. [PubMed: 22422990]
Lee ET, Welty TK, Fabsitz R, Cowan LD, Le NA, Oopik AJ, Cucchiara AJ, Savage PJ, Howard BV, The Strong Heart Study. A study of cardiovascular disease in American Indians: design and methods. Am J Epidemiol. 1990; 132(6):1141–55. [PubMed: 2260546]
Llobet JM, Falcó G, Casas C, Teixidó A, Domingo JL. Concentrations of arsenic, cadmium, mercury, and lead in common foods and estimated daily intake by children, adolescents, adults, and seniors of Catalonia, Spain. J Agric Food Chem. 2003; 51:838–42. [PubMed: 12537467]
López-Alonso M, Miranda M, Castillo C, Hernández J, García-Vaquero M, Benedito JL. Toxic and essential metals in liver, kidney and muscle of pigs at slaughter in Galicia, north-west Spain. Food Addit Contam. 2007; 24(9):943–54. [PubMed: 17691007]
Moon J, Smith TJ, Tamaro S, Enarson D, Fadl S, Davison AJ, Weldon L. Trace metals in scalp hair of children and adults in three Alberta Indian villages. Sci Total Environ. 1986; 54:107–25. [PubMed: 3810124]
North KE, MacCluer JW, Devereux RB, Howard BV, Welty TK, Best LG, Lee ET, Fabsitz RR, Roman MJ, Strong Heart Family Study. Heritability of carotid artery structure and function: the Strong Heart Family Study. Arterioscler Thromb Vasc Biol. 2002; 22(10):1698–703. [PubMed: 12377752]
Olmedo P, Pla A, Hernández AF, Barbier F, Ayouni L, Gil F. Determination of toxic elements (mercury, cadmium, lead, tin and arsenic) in fish and shellfish samples. Risk assessment for the consumers. Environ Int. 2013; 59:63–72. [PubMed: 23792415]
Olsson IM, Bensryd I, Lundh T, Ottosson H, Skerfving S, Oskarsson A. Cadmium in blood and urine– impact of sex, age, dietary intake, iron status, and former smoking–association of renal effects. Environ Health Perspect. 2002; 110(12):1185–90. [PubMed: 12460796]
Pang Y, Peng RD, Jones MR, Francesconi KA, Goessler W, Howard BV, Umans JG, Best LG, Guallar E, Post WS, et al. Metal mixtures in urban and rural populations in the US: The Multi-Ethnic Study of Atherosclerosis and the Strong Heart Study. Environ Res. 2016; 147:356–64. [PubMed: 26945432]
Peraza MA, Ayala-Fierro F, Barber DS, Casarez E, Rael LT. Effects of micronutrients on metal toxicity. Environ Health Perspect. 1998; 106(Suppl 1):203–16.
Scheer J, Findenig S, Goessler W, Francesconi KA, Howard B, Umans JG, Pollak J, Tellez-Plaza M, Silbergeld EK, Guallar E, et al. Arsenic species and selected metals in human urine: validation of HPLC/ICPMS and ICPMS procedures for a long-term population-based epidemiological study. Anal Methods. 2012; 4(2):406–13. [PubMed: 22685491]
Schmitt CJ, Brumbaugh WG, Linder GL, Hinck JE. A screening-level assessment of lead, cadmium, and zinc in fish and crayfish from Northeastern Oklahoma, USA. Environ Geochem Health. 2006; 28(5):445–71. [PubMed: 16791710]
Smith CJ, Nelson R, Hardy S, Manahan E, Bennett P, Knowler W. Survey of the diet of Pima Indians using quantitative food frequency assessment and 24-hour recall. J Am Diet Assoc. 1996; 96:778– 84. [PubMed: 8683009]
Strong Heart Study. Operations Manual. Chapter 6. Laboratory Procedure. 1991. Internet: http:// strongheart.ouhsc.edu/manual/PhaseI/Chapter%206.pdf (accessed 9 August 2016)
A
uthor Man
uscr
ipt
A
uthor Man
uscr
ipt
A
uthor Man
uscr
ipt
A
uthor Man
uscr
Subar AF, Thompson F, Kipnis V, Midthune D, Hurwitz P, McNutt S, McIntosh A, Rosenfeld S. Comparative validation of the Block, Willett, and National Cancer Institute food frequency questionaires. Am J Epidemiol. 2001; 154:1089–99. [PubMed: 11744511]
Taylor CA, Keim K, Gilmore A, Parker S, Van Delinder J. Most commonly consumed foods and food perceptions in Native American women. Am J Health Behav. 2006; 30:613–25. [PubMed: 17096619]
Tellez-Plaza M, Guallar E, Fabsitz RR, Howard BV, Umans JG, Francesconi KA, Goessler W, Devereux RB, Navas-Acien A. Cadmium exposure and incident peripheral arterial disease. Circ Cardiovasc Qual Outcomes. 2013a; 6:626–33. [PubMed: 24255048]
Tellez-Plaza M, Guallar E, Howard BV, Umans JG, Francesconi KA, Goessler W, Silbergeld EK, Devereux RB, Navas-Acien A. Cadmium exposure and incident cardiovascular disease. Epidemiology. 2013b; 24:421–9. [PubMed: 23514838]
Tsukahara T, Ezaki T, Moriguchi J, Furuki K, Shimbo S, Matsuda-Inoguchi N, Ikeda M. Rice as the most influential source of cadmium intake among general Japanese population. Sci Total Environ. 2003; 305(1–3):41–51. [PubMed: 12670756]
Vaughan LA, Benyshek D, Martin J. Food acquisition habits, nutrient intakes, and anthropometric data of Havasupai adults. J Am Diet Assoc. 1997; 97:1275–82. [PubMed: 9366866]
Yassin AS, Martonik JF. Urinary cadmium levels in the U S working population, 1988–1994. J Occup Environ Hyg. 2004; 1(5):324–33. [PubMed: 15238341]
A
uthor Man
uscr
ipt
A
uthor Man
uscr
ipt
A
uthor Man
uscr
ipt
A
uthor Man
uscr
HIGHLIGHTS
- We evaluated the association of foods with urinary Cd levels in American Indians.
- Higher processed meat intake was associated with higher urinary Cd concentrations.
- Higher intake of dairy products and fruit juices was associated with lower Cd levels.
- Processed meat products are a potential dietary source of cadmium.
A
uthor Man
uscr
ipt
A
uthor Man
uscr
ipt
A
uthor Man
uscr
ipt
A
uthor Man
uscr
Figure 1. Geometric mean ratio (95% confidence interval) of urine cadmium by daily intake of processed meat, dairy products and fruit juice
Lines represent the geometric mean ratio of urinary cadmium concentrations based on restricted quadratic spline models with knots at the 10th, 50th, and 90th percentiles of each log-transformed daily intake of each food type. Shaded areas surrounding the lines represent 95% confidence intervals. The reference was set at the 10th percentile of each dietary variable distribution. Solid lines (blue shaded areas) represent the cadmium geometric mean ratios (95% CI’s) for each dietary variable by adjusting for age (continuous), sex (male/ female), center (Arizona/Oklahoma/North and South Dakota), educational level (<12 years/ ≥12 years), smoking status (never/former/current), body mass index (continuous), and total kilocalories (continuous). Dotted lines (green shaded areas) represent the cadmium geometric mean ratios (95% CI’s) in model further adjusted for additional food type variables (organ meat, processed meat, leafy vegetables, root vegetables, baked and mashed potatoes, fries and chips, dairy products, fruit juice and alcoholic drinks). Bars represent the distribution of processed meat, dairy products and fruit juice intake, respectively. The extreme tails of the histogram were truncated because 3 participants reported processed meat intake > 400 grams, and 6 reported dairy products intake < 1.3 grams.
A
uthor Man
uscr
ipt
A
uthor Man
uscr
ipt
A
uthor Man
uscr
ipt
A
uthor Man
uscr
A
uthor Man
uscr
ipt
A
uthor Man
uscr
ipt
A
uthor Man
uscr
ipt
A
uthor Man
uscr
ipt
T ab le 1 Participant characteristics by urine cadmium (μg/g) quartiles.
1 (N=1725)
V
ariable
Ov
erall
Q1 (≤ 0.20)
Q2 (0.20–0.44)
Q3 (0.44–0.85)
Q4 (> 0.85)
p-v alue N (%) 1725 (100) 437 (25.3) 437 (25.3) 423 (24.5) 428 (24.8) Age, years 35.9 (23.6–47.1) 21.9 (17.9–31.4) 32.6 (23.8–43.2) 40.3 (31.8–49.3) 43.9 (35.9–54.4) <0.001 Gender
, n (%)
Male 669 (38.8) 245 (56.1) 184 (42.1) 139 (32.9) 101 (23.6) <0.001 Female 1056 (61.2) 192 (43.9) 253 (57.9) 284 (67.1) 327 (76.4)
Education, n (%)
Less than 12
519 (30.1) 184 (42.1) 117 (26.8) 90 (21.3) 128 (29.9) <0.001
More than 12
1206 (69.9) 253 (57.9) 320 (73.2) 333 (78.7) 300 (70.1) BMI, kg/m 2 29.4 (25.4–34.4) 28.7 (23.9–34.2) 30.4 (25.9–35.5) 29.7 (26.3–34) 29 (25.5–34) 0.006
Smoking Status, n (%)
Ne v er 711 (41.2) 231 (52.9) 208 (47.6) 153 (36.2) 119 (27.8) <0.001 F ormer 358 (20.8) 71 (16.2) 82 (18.8) 108 (25.5) 97 (22.7) Current 656 (38) 135 (30.9) 147 (33.6) 162 (38.3) 212 (49.5) Center
, n (%)
Arizona 171 (9.9) 47 (10.8) 45 (10.3) 38 (9) 41 (9.6) 0.092 Oklahoma 767 (44.5) 169 (38.7) 198 (45.3) 210 (49.6) 190 (44.4)
N and S. Dak
ota 787 (45.6) 221 (50.6) 194 (44.4) 175 (41.4) 197 (46) Smok eless tobacco a No 1563 (91.8) 376 (86.8) 382 (88.6) 399 (96.1) 406 (95.8) <0.001 Y es 140 (8.2) 57 (13.2) 49 (11.4) 16 (3.9) 18 (4.2) Secondhand Smok e, hours/day b 3 (1–6) 4 (2–6) 3 (1–4) 3 (1–4) 2 (1–4.8) 0.096
Kcal per day
A
uthor Man
uscr
ipt
A
uthor Man
uscr
ipt
A
uthor Man
uscr
ipt
A
uthor Man
uscr
ipt
V ariable Ov erallQ1 (≤ 0.20)
Q2 (0.20–0.44)
Q3 (0.44–0.85)
Q4 (> 0.85)
p-v alue Shellf ish 2 0 (0–2) 0 (0–2) 0 (0–2) 0 (0–2) 0 (0–2) 0.19 Leafy v egetables 2 13 (5–33) 10 (2–29) 14 (5–31) 16 (6–34) 14 (5–37) <0.001 Root v egetable 2 6 (2–13) 5 (1–12) 6 (3–13) 6 (3–14) 6 (3–13) 0.004 Other v egetables 2 63 (33–123) 55 (30–114) 60 (34–114) 66 (35–125) 70 (35–131) 0.15 Cereals 2 144 (85–239) 140 (79–227) 150 (88–239) 139 (86–232) 150 (86–260) 0.67 Rice 2 7 (3–25) 7 (1–19) 7 (3–13) 7 (3–25) 7 (3–25) 0.23 Corn 2 15 (7–30) 14 (7–30) 15 (7–29) 16 (8–30) 15 (7–31) 0.99 Le gumes 2 10 (4–25) 10 (3–22) 10 (4–25) 11 (4–26) 11 (4–28) 0.27
Nuts and seeds
2 6 (2–16) 7 (2–21) 5 (2–14) 6 (2–16) 5 (2–16) 0.21 Bak
ed and mashed potatoes
2 14 (7–40) 13 (6–27) 14 (7–40) 14 (7–40) 14 (7–40) 0.05
Fries and chips
2 27 (11–63) 31 (13–67) 28 (13–63) 26 (11–59) 26 (9–60) 0.07 Eggs 2 14 (7–43) 14 (7–43) 22 (8–43) 21 (8–43) 14 (5–43) 0.39 Dairy products 2 108 (38–268) 142 (49–331) 111 (39–263) 92 (35–246) 101 (35–244) 0.001 Fruit 2 58 (30–104) 60 (31–116) 52 (30–98) 59 (31–100) 57 (29–99) 0.14 Fruit juice 2 140 (47–356) 198 (63–457) 145 (50–331) 125 (43–291) 115 (35–306) <0.001
Sauces and dressings
2 24 (11–47) 22 (10–44) 25 (11–45) 25 (13–47) 26 (12–51) 0.08
Oil and f
at 2 8 (4–16) 8 (3–15) 8 (4–16) 8 (4–16) 10 (4–18) 0.001 Non-Alcoholic Drinks 2 985 (529–1544) 826 (441–1422) 957 (508–1500) 1074 (578–1646) 1064 (652–1613) <0.001 Alcoholic Drinks 2 18 (0–137) 25 (0–144) 22 (0–148) 18 (0–136) 12 (0–92) 0.13
1 Data are n (%) for cate
gorical v
ariables and median (interquartile range) for continuous v
ariables.
A
uthor Man
uscr
ipt
A
uthor Man
uscr
ipt
A
uthor Man
uscr
ipt
A
uthor Man
uscr
ipt
T ab le 2Geometric Mean Ratios (95% conf
idence interv
al) of urine cadmium concentrations per interquartile range in daily food type intak
e (N=1725)
F
ood type
p75 vs. p25 (g/day)
Model 1 p-v alue Model 2 p-v alue Poultry
46.4 vs 11.7
1.03 (0.95, 1.12)
0.49
0.99 (0.91, 1.08)
0.80
Red meat
109.8 vs 30
1.06 (0.96, 1.18)
0.25
0.99 (0.89, 1.11)
0.90
Or
g
an meat
5.9 vs 0.3
1.08 (0.95, 1.22)
0.24
1.06 (0.93, 1.20)
0.39
Processed meat
48.8 vs 11.4
1.16 (1.04, 1.29)
0.007
1.15 (1.03, 1.28)
0.01
Fish
10.8 vs 0.8
0.95 (0.85, 1.06)
0.38
0.94 (0.83, 1.05)
0.27
Shellf
ish
4.3 vs 1.1
1.01 (0.89, 1.15)
0.90
1.01 (0.88, 1.15)
0.94
Leafy v
egetables
32.9 vs 4.6
1.02 (0.94, 1.10)
0.70
1.04 (0.95, 1.13)
0.40
Root v
egetable
12.8 vs 2.5
1.00 (0.93, 1.08)
0.99
1.00 (0.93, 1.08)
0.96
Other v
egetables
123 vs 33.4
0.97 (0.89, 1.06)
0.50
0.97 (0.89, 1.06)
0.52
Cereals
238.8 vs 85.4
0.97 (0.89, 1.06)
0.54
0.96 (0.87, 1.06)
0.46
Rice
25 vs 2.9
0.94 (0.86, 1.03)
0.21
0.93 (0.85, 1.03)
0.16
Corn
30.2 vs 7.4
0.98 (0.90, 1.07)
0.64
0.97 (0.88, 1.06)
0.49
Le
gumes
24.8 vs 3.8
1.00 (0.91, 1.09)
0.94
0.98 (0.89, 1.07)
0.64
Nuts and seeds
16.1 vs 1.7
0.94 (0.85, 1.04)
0.24
0.94 (0.84, 1.04)
0.23
Bak
ed and mashed potatoes
40.3 vs 6.7
1.03 (0.95, 1.11)
0.46
1.00 (0.92, 1.09)
0.96
Fries and chips
62.9 vs 11.4
1.10 (1.00, 1.21)
0.04
1.07 (0.96, 1.18)
0.21
Eggs
43.3 vs 7.1
1.07 (0.99, 1.16)
0.09
1.05 (0.97, 1.14)
0.22
Dairy products
268.1 vs 38.3
0.87 (0.80, 0.95)
0.00
0.88 (0.80, 0.97)
0.007
Fruit
103.6 vs 30.2
0.96 (0.89, 1.03)
0.24
1.00 (0.93, 1.08)
0.99
Fruit juice
356 vs 46.6
0.89 (0.82, 0.97)
0.006
0.91 (0.83, 0.99)
0.03
Sauces and dressings
46.8 vs 11.5
1.06 (0.97, 1.17)
0.21
1.03 (0.93, 1.15)
0.52
Oil and f
at
15.8 vs 3.5
1.05 (0.98, 1.13)
0.19
1.03 (0.96, 1.12)
0.38
Non-Alcoholic Drinks
1543.8 vs 528.9
1.05 (0.98, 1.12)
0.16
1.05 (0.98, 1.12)
0.16
Alcoholic Drinks
136.9 vs 1.2
1.12 (0.99, 1.28)
0.08
1.10 (0.96, 1.26)
0.17
Model 1 adjusted for age at baseline, se
x, smoking status, educational le
v
el, center
, body mass inde
x, and total kcal. Model 2 further adjusted for dietary v
ariables that may contrib
ute to cadmium intak
e
(or
g
an meat, processed meat, leafy v
egetables, root v
egetables, bak
ed and mashed potatoes, fries and chips, dairy products and fruit juice). F
A
uthor Man
uscr
ipt
A
uthor Man
uscr
ipt
A
uthor Man
uscr
ipt
A
uthor Man
uscr
ipt
T
ab
le 3
Geometric Mean Ratios (95% conf
idence interv
al) of urine cadmium concentrations per interquartile range in daily food intak
e of processed meat, dairy
products and fruit juice stratif
ied by se
x and smoking status (N=1725)
F
ood type
p75 vs. p25 (g/day)
Model 1
p-v
alue
Model 2
p-v
alue
Female (n=1056)
Processed meat
38.1 vs 8.9
1.09 (0.97, 1.22)
0.13
1.07 (0.95, 1.20)
0.28
Dairy products
243.9 vs 35.9
0.88 (0.79, 0.97)
0.01
0.88 (0.79, 0.99)
0.03
Fruit juice
323.7 vs 43.2
0.88 (0.80, 0.98)
0.02
0.90 (0.81, 1.00)
0.05
Male (n=669)
Processed meat
66.4 vs 19.5
1.30 (1.06, 1.59)
0.01
1.31 (1.08, 1.60)
0.007
Dairy products
332.1 vs 46.5
0.86 (0.71, 1.03)
0.10
0.87 (0.72, 1.05)
0.15
Fruit juice
411.9 vs 50.7
0.88 (0.74, 1.04)
0.13
0.89 (0.73, 1.08)
0.25
Ne
v
er
(n=711)
Processed meat
41 vs 9.9
1.09 (0.94, 1.25)
0.25
1.07 (0.92, 1.25)
0.36
Dairy products
268.2 vs 43.3
0.89 (0.79, 0.99)
0.04
0.87 (0.77, 0.99)
0.03
Fruit juice
362.9 vs 47.8
0.90 (0.78, 1.05)
0.18
0.92 (0.79, 1.07)
0.26
Ev
er
(n=1014)
Processed meat
55.2 vs 11.9
1.24 (1.05, 1.47)
0.01
1.23 (1.06, 1.44)
0.008
Dairy products
267.8 vs 36.1
0.86 (0.75, 0.98)
0.02
0.87 (0.76, 1.00)
0.05
Fruit juice
332.9 vs 46.3
0.87 (0.77, 0.99)
0.03
0.90 (0.79, 1.03)