THE EFFECTS OF HEARING IMPAIRMENT ON THE ABILITY TO GLIMPSE SPEECH IN A SPECTRO-TEMPORALLY COMPLEX NOISE
Erol James Ozmeral
A dissertation submitted to the faculty of the University of North Carolina at Chapel Hill in partial fulfillment of the requirements for the degree of Doctor of Philosophy in the
Department of Psychology (Cognitive Program).
Chapel Hill 2013
iii
ABSTRACT
Erol James Ozmeral: The effects of hearing impairment on the ability to glimpse speech in a spectro-temporally complex noise
(Under the direction of Joseph W. Hall, III and Emily Buss)
iv
v
vi
ACKNOWLEDGEMENTS
vii
their generous contributions to designing experiments and writing manuscripts. Each is a notable scientist that I hope to have the chance to collaborate with again in the future. My academic big brothers and sister in the Auditory Neuroscience Lab at BU: Dr. Adrian KC Lee, Dr. Antje Ihlefeld, Dr. Eric Thompson, Scott Bressler, and Tim Streeter for the times spent scheming and enjoying the nightlife in Boston, New Orleans, Baltimore, and
viii PREFACE
Erol J. Ozmeral attended Boston University (Boston, MA; 2000-2004) and earned a Bachelor of Science in Biomedical Engineering, minoring in Philosophy. He then went on to earn a Master of Arts in Cognitive and Neural Systems, also at Boston University (2004-2007), under the supervision of Dr. Barbara Shinn-Cunningham and with the support of a research assistantship in the Auditory Neuroscience Lab. During his tenure at BU, including as a research specialist (2007-2008), he co-authored seven peer-reviewed manuscripts and submitted twelve abstracts to international and domestic research meetings.
In August 2008, Erol began his doctoral studies at the University of North Carolina at Chapel Hill in the Cognitive Program in the Department of Psychology, minoring in Neurobiology. He completed his masters and doctoral theses under the supervision of Drs. Joseph Hall and Emily Buss, with support by a research assistantship in the Psychoacoustics Lab and a National Research Service Award (NRSA) from the National Institutes of Health (NIH; F31 DC01269). He published a first-authored manuscript and presented his research at five research meetings during his tenure at UNC.
ix
TABLE OF CONTENTS
LIST OF TABLES ... X LIST OF FIGURES ... XI LIST OF ABBREVIATIONS ... XIII
CHAPTER 1: GENERAL INTRODUCTION ... 1
1.1GLIMPSING OF SPEECH IN FLUCTUATING NOISE ... 1
1.2WHAT IS FREQUENCY RESOLUTION AND WHY IS IT IMPORTANT? ... 5
1.3MOTIVATION FOR EXPERIMENTS ... 8
1.4OUTLINE OF DISSERTATION ... 11
CHAPTER 2: EXPERIMENT 1 – EFFECTS OF HEARING IMPAIRMENT ... 13
2.1INTRODUCTION ... 13
2.2METHOD ... 14
2.3RESULTS ... 23
2.4DISCUSSION ... 33
CHAPTER 3: EXPERIMENT 2 – EFFECTS OF SIMULATED HEARING LOSS ... 38
3.1INTRODUCTION ... 38
3.2METHOD ... 41
3.3RESULTS ... 47
3.4DISCUSSION ... 58
CHAPTER 4: EXPERIMENT 3 – A BINAURAL GLIMPSING MODEL ... 63
4.1INTRODUCTION ... 63
4.2METHOD ... 66
4.3RESULTS ... 78
4.4DISCUSSION ... 83
CHAPTER 5: GENERAL DISCUSSION ... 87
5.1SUMMARY OF EXPERIMENTS ... 87
5.2CLINICAL APPLICATIONS ... 90
5.3LIMITATIONS AND POSSIBLE IMPROVEMENTS TO THE STUDY ... 91
5.4CONCLUSIONS ... 93
x
LIST OF TABLES
Table 2.1: Experiment 1 listener demographics and audiometric profiles ...15
Table 2.2: Mean speech reception thresholds from Experiment ...21
Table 2.3: Mean speech reception thresholds for the dichotic and monaural controls in Experiment 1 ...21
Table 3.1: Mean speech reception thresholds from Experiment 2 ...46
Table 4.1: Mean speech reception thresholds without a noise floor in Experiment 3 ...77
xi
LIST OF FIGURES
Figure 1.1: Spectrograms of the Sync and Async maskers ...2
Figure 2.1: Audiograms for normal-hearing and hearing-impaired listeners ...14
Figure 2.2: Schematic of masker conditions for all experiments ...19
Figure 2.3: Schematic of the frequency spectrum for the notched-noise method ...20
Figure 2.4: Mean masking release in Experiment 1...22
Figure 2.5: Dichotic advantage in Experiment 1 ...27
Figure 2.6: Consonant accuracy for each band number (by row; 2, 4, 8, and 16) ...28
Figure 2.7: The difference between thresholds in the Async-D and Control-D conditions ....30
Figure 2.8: Similar to Figure 2.4 except masking release is normalized to the Sync MR ...34
Figure 2.9: Similar to Figure 2.5 except dichotic advantage is normalized to MR in the Sync condition...37
Figure 3.1: Spectrograms of an Async masker with 8 frequency bands after spectral smearing ...43
Figure 3.2: Estimated thresholds (in dB SPL) with no masker present for each smearing group...46
Figure 3.3: Masking release in the average Sync conditions for each smear factor group ...49
Figure 3.4: Mean masking release for Async-D and Async-M conditions ...49
Figure 3.5: Masking release re-plotted for normal-hearing group in Experiment 1 (85 dB SPL) and group SF1 in Experiment 2 (55 dB SPL) ...51
Figure 3.6: Dichotic advantage for all three smear factor groups at 4 and 8 bands ...53
Figure 3.7: The masking release difference between Async-D and Control-D for all three smear factor groups at 4 and 8 bands ...55
Figure 3.8: Speech reception thresholds for the Unmod condition in each smear factor group ...57
xii
Figure 4.1: Outputs of the spectro-temporal excitation pattern processor for the speech
token /aga/ and three maskers...65
Figure 4.2: Processing architecture of the STEP processor ...66
Figure 4.3: Probabilistic parameters of a hidden Markov model of a series of coin ...67
Figure 4.4: Processing architecture of the decision model ...70
Figure 4.5: Each panel represents the spectro-temporal excitation pattern of the signal ...71
Figure 4.6: Speech reception thresholds in the Unmod and Sync conditions as a function of the noise floor parameter in the model ...73
Figure 4.7: Masking release in the Sync condition as a function of the local SNR used for glimpse detection in the model ...74
Figure 4.8: Model results: masking release in the synchronously-modulated noise condition for each level of smearing without a noise floor ...79
Figure 4.9: Model results: masking release in the synchronously-modulated noise condition for each level of smearing with a noise floor...80
Figure 4.10: Data from Experiment 1 and the model with no smearing and no noise floor ...81
xiii
LIST OF ABBREVIATIONS
AI Articulation Index
ANOVA analysis of variance
Async asynchronously modulated noise
D dichotic
ERB equivalent rectangular bandwidth
FFT fast-Fourier transform
HMM hidden Markov model
L left
M monaural
MR masking release
R right
rms root mean squared
SF smear factor
SNR signal-to-noise ratio
STEP spectro-temporal excitation pattern Sync synchronously modulated noise
CHAPTER 1: GENERAL INTRODUCTION
1.1 Glimpsing of Speech in Fluctuating Noise
In everyday listening environments, following a conversation amidst numerous
competing sounds can seem very difficult. Interfering background sounds energetically mask target speech sounds by adding energy to shared frequency bands at the periphery. On a noisy city street or at a crowded party, there is a blend of interfering sounds that fluctuate in time and frequency depending on their sources. Due to inherent fluctuations in the spectro-temporal structure of these maskers, the brain is sometimes able to take advantage of the redundancy in speech across time and frequency to piece together a coherent message. One view of how this takes place is that listeners are able to listen in the dips, or glimpse, sparse speech cues at brief moments of favorable signal-to-noise ratios (SNRs; Miller and Licklider, 1950; Dirks and Bower, 1970; Howard-Jones and Rosen, 1993; Peters et al., 1998; Li and Loizou, 2007). The series of experiments reported here explores the ability to recognize speech presented in spectro-temporally complex maskers and the factors that influence this ability, including those associated with hearing impairment.
2
reception thresholds in fluctuating maskers are typically better. During the “off” phase of amplitude modulation, target speech has the highest SNR, and taking advantage of the high SNR at the masker minima typically leads to the improved thresholds, also known as masking release (MR; Miller and Licklider, 1950; Wilson and Carhart, 1969). Normal-hearing listeners have been shown to achieve MR as large as 23 dB in an amplitude-modulated noise (Howard-Jones and Rosen, 1993; Ozmeral et al., 2012). The size of MR gained by replacing steady noise with an amplitude-modulated masker, however, can vary depending on the masker bandwidth (Hall and Grose, 1989; Bacon et al., 1997), modulation rate (Carlyon et al., 1989; Peters and Hall, 1994), and intensity (Zwicker and Schorn, 1982; Moore and Shailer, 1991).
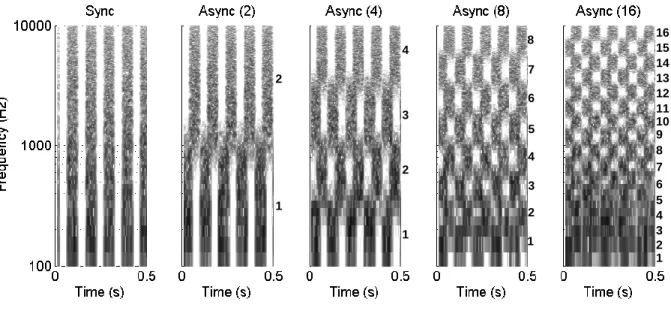
Figure 1.1: Spectrograms of the Sync (left panel) and Async maskers with 2, 4, 8 and 16 filtering bands (from left to right). Dark regions represent masker energy, while white areas indicate regions of masker minima (i.e., dips). Frequency bands are logarithmically equal in bandwidth, and rate of temporal modulation is 10 Hz corresponding to 50-ms dips. Band numbers are indicated along the right-hand side of each Async masker spectrogram.
3
Howard-Jones and Rosen (1993) tested the hypothesis that MR associated with
fluctuating maskers relies on periods of favorable SNR coinciding across frequency. Their innovative design measured speech reception thresholds with background maskers that fluctuated in both time and frequency. The left panel in Figure 1.1 shows the spectrogram of an amplitude-modulated noise in which all masker minima (white regions) at all frequencies occur at the same time. In contrast, the four right panels in Figure 1.1 show the spectrograms of a masker that fluctuate in time and frequency, and consequently, not all masker minima coincide across frequency. In our current study, we refer to this less conventional masker as asynchronously modulated noise (Async), and we refer to the amplitude-modulated noise as synchronously modulated noise (Sync) in order to highlight the relationship between
neighboring frequency regions (i.e., modulated out-of-phase or in-phase, respectively). Howard-Jones and Rosen (1993) found an interesting result for speech identification in the presence of a diotic Async masker.1 Consonant identification was tested in three primary diotic conditions: steady noise, Sync, and Async (with 2, 4, 8, or 16 frequency bands). In Async conditions, there was some MR when noise was filtered into only 2 or 4 frequency bands, but no MR was observed in the 8- or 16-band conditions. This was surprising because the cumulative spectro-temporal glimpsing area – regions of masker minima – appear
physically equivalent across all modulated maskers (Figure 1.1; compare total white area in each panel).
A recent study from our lab (Ozmeral et al., 2012) hypothesized that the MR differences between Sync and Async conditions in Howard-Jones and Rosen’s (1993) study were due to peripheral processing causing energy in masked frequency regions to spread into
neighboring, unmasked frequency regions. Because listeners have been shown to integrate
4
speech information distributed across a large number of asynchronously modulated speech bands under some conditions (Buss et al., 2004), we speculated that Howard-Jones and Rosen (1993) may have failed to show MR at greater numbers of bands because spread of masking degraded the quality of the available speech in the modulation minima. In contrast to the Sync condition, glimpses available to the listeners in the Async conditions are flanked by frequency regions with masker maxima (Figure 1.1; Async dark regions above and below white regions). To relieve listeners of the effects of spread of masking, we adopted an approach that has previously been used in bilateral hearing aid and cochlear implant studies (Loizou et al., 2003; Tyler et al., 2010; Kulkarni et al., 2012; Zhou and Pfingst, 2012), in which the bands were distributed across ears, such that the odd-numbered bands were presented to one ear and the even-bands to the other – termed dichotic stimulation, because each ear received different information. By separating the bands across the ears, the effects of spread of masking were avoided, and listeners had a better opportunity to identify the speech. Ozmeral et al. (2012) showed between 5 and 8 dB greater MR in the dichotic Async
condition than the monaural Async condition with the same number of frequency bands. The purpose of the current study was to characterize hearing-impaired listeners’ abilities to understand speech in a complex background such as the Async noise and to understand the factors that may limit those abilities. Along with reduced audibility, hearing-impaired
5
reduced audibility alone cannot explain all of the difficulties hearing-impaired listeners have in fluctuating noise (e.g., Eisenberg et al., 1995).
1.2 What is Frequency Resolution and Why is it Important?
The sounds that reach a listener’s ears can be the combination of a number of natural and mechanical signals. What allows the listener to detect one particular signal in the presence of another can come down to whether or not the two sounds share overlapping or neighboring frequency components.2 In principle, spectrally neighboring sounds can mask each other because the ear does not have perfect frequency resolution.
By using masking as a tool in the laboratory, researchers have been able to model frequency resolution to predict signal detection in the presence of noise (for a review, see Moore, 1995). For tone detection in the presence of Gaussian noise, it is assumed that perception is based on the SNR at the output of a filter with a center frequency near the tone frequency. When noise power density is held constant for different bandwidths of the noise,3 threshold for the tone can vary depending on the bandwidth of the noise. Thus, for noise bands that are narrower than the filter width, detection thresholds will increase as the noise bandwidth increases because of an increase in the total noise power passed by the filter. However, as long as the noise bandwidth is at least as broad as the filter, the threshold of the tone will not change for wider noise bands because the filter does not pass the noise outside of its passband. The filter width is hence named the “critical bandwidth” because it is
2 Increasing detection thresholds by adding masking energy to shared frequencies is known as energetic
masking, but in some cases, maskers that do not overlap or neighbor the target frequency can also disrupt detection in what is known as informational masking (e.g., Kidd et al., 1994). Unless otherwise stated, the following paper will refer to energetic masking as simply, masking.
6
equivalent to the bandwidth at which detection thresholds will no longer change (Fletcher, 1940).
Fletcher (1940) described basilar membrane function as consisting of many of these overlapping, band-pass auditory filters. For tones with maskers occupying neighboring frequencies, listeners with good frequency resolution are able to make use of narrow filters that pass primarily target information, whereas listeners with poor frequency resolution are more susceptible to effects of masking spread – the phenomenon in which masker frequency components are not overlapping the target, but the auditory filters nonetheless pass their energy along with that of the target.
Auditory filter bandwidths describe a listener’s frequency resolution, and a number of studies have measured normal auditory filter bandwidths at different center frequencies (Patterson, 1976; Dubno and Dirks, 1989; Glasberg and Moore, 1990; Moore et al., 1990; Shailer et al., 1990; Zhou, 1995). From the measured filter bandwidths, Glasberg and Moore (1990) derived a formula that calculates the equivalent rectangular bandwidth (ERB) across the range of frequencies relevant to human hearing:
( ) ( )
where the subscript N refers to the distinction that filter bandwidth corresponds to normal-hearing listeners tested at medium sound levels, and where F is the center frequency of the filter (in kHz). Variability in the predicted ERBN is minimal, but it is less variable in the
7
example, if an auditory filter is modeled by a filter bandwidth that is greater than an ERBN,
the energy passed by the filter is assumed to reflect the output by an auditory filter of a listener with poorer-than-normal frequency resolution.
Until now, we have discussed how auditory filter widths determine the degree of
frequency resolution of the listener, but more importantly, it is of interest to understand how frequency resolution can affect speech perception. If we assume that poor frequency
resolution can degrade the perceived spectral quality of speech, then we can test the effects of poor frequency resolution by purposefully degrading the spectral quality of speech. In some studies, this approach has shown that the spectral quality of speech is not necessarily crucial
in quiet (e.g., Shannon et al., 1995), but others have shown that spectral quality can affect speech perception differently depending on the difficulty of the speech materials (Fu et al., 1998; Smith et al., 2002), and the age – and arguably the amount of language experience – of the listener (Eisenberg et al., 2000). Finally, in cases where noise is present, spectral quality appears to play an important role in speech identification (Rosen and Fourcin, 1986).
Baer and Moore (1993) demonstrated that good frequency resolution is important for speech perception in the presence of interfering background noise. Their experiments
measured speech recognition in quiet and in noise for normal-hearing subjects with simulated reduced frequency resolution. The method employed for their simulations was a previously validated form of spectral smearing (Moore et al., 1992) – a process which blurs the spectral envelope but leaves lower harmonic resolution intact. In quiet, intelligibility of the spectrally smeared speech stimuli was hardly affected, even when simulated filters were effectively six times broader than normal (i.e. an ERBN). However, results for speech presented in noise
8
effects of spectral smearing, as with poor frequency resolution, are more deleterious in noise than in quiet.
1.3 Motivation for Experiments
Hearing-impaired listeners tend to perform worse overall than normal-hearing listeners in spectro-temporally fluctuating noise (Hall et al., 2012), but it is not certain whether poorer performance is solely a result of reduced audibility or also includes another factor, like broader-than-normal auditory filters at the periphery (see Moore, 2007, for a review). A number of studies that have measured the psychophysical tuning curves in both normal-hearing and normal-hearing-impaired listeners have shown broader tuning (Zwicker and Schorn, 1978; Florentine et al., 1980; Festen and Plomp, 1983), and measured filter shapes have also confirmed a general result of broader-than-normal tuning (Tyler et al., 1984; Dubno and Dirks, 1989; Leek and Summers, 1993). A consequence of broader auditory filters is that hearing impairment is often associated with greater effects of spread of masking (Leshowitz, 1977; Florentine et al., 1980; Gagné, 1988), although not all studies have observed
differences (Martin and Pickett, 1970; for a review, see Tyler, 1986).
A common criticism of these reported differences between normal-hearing and hearing-impaired listeners is that stimuli are often not presented at comparable sensation levels4 to each other (Gagné, 1988), so caution must be made when comparing listeners in studies that do not control for the sensation level of the stimuli across groups. It is often impractical, however, to test hearing-impaired listeners at the same sensation levels as normal-hearing listeners because presentations could reach uncomfortable levels for the hearing-impaired listeners. In order to compare across listeners, some studies have included conditions that are
9
meant to equate audibility through manipulation of overall stimulus level (Zurek and
Delhorne, 1987), inclusion of a threshold-elevating background noise (Moore et al., 1995), or other signal-processing strategies (e.g., amplitude expansion; Lum and Braida, 2000).
In an early study on the relationship between frequency resolution and consonant
recognition in quiet, Dubno and Dirks (1989) used the Articulation Index (AI; Galecki et al., 2009) to predict recognition in normal-hearing and hearing-impaired listeners.5 Estimates of auditory filter shapes were collected for all subjects, and speech recognition was measured at presentation levels tailored to each individual’s hearing loss, such that the AI predicted equivalent consonant recognition across listeners. Hearing-impaired listeners performed roughly as the AI model predicted, and frequency resolution did not correlate well with performance differences. The study suggests that hearing-impaired listeners are mostly susceptible to poor speech performance in quiet due to reduced audibility, but the evidence does not rule out that poor frequency resolution in hearing-impaired listeners may have added effects beyond those of reduced audibility for speech in noise (e.g., Baer and Moore, 1993).
The current project tested whether frequency resolution could account for some of the difficulty that hearing-impaired listeners have understanding speech in noise, especially spectro-temporally modulated noise. Generally, hearing-impaired listeners benefit very little from masker modulations when compared to normal-hearing listeners (Carhart and Tillman, 1970; Duquesnoy and Plomp, 1983; Festen and Plomp, 1990; Bronkhorst and Plomp, 1992; Gustafsson and Arlinger, 1994; Eisenberg et al., 1995; Peters et al., 1998). This discrepancy between hearing-impaired and normal-hearing listeners has been attributed to the combined
5 The AI is a tool used for measuring the proportion of a speech signal that is audible (on a range from 0 to 1).
10
effects of reduced audibility – due to audiometric threshold differences between groups (Dubno and Dirks, 1989) – and reduced temporal (Festen and Plomp, 1990; Dubno et al., 2003; George et al., 2006) and frequency (Baer and Moore, 1993; ter Keurs et al., 1993; Baer and Moore, 1994) resolution – which can introduce greater effects of spread of masking.
Evidence from normal-hearing listeners suggests that effects of spread of masking can have deleterious effects on speech reception in Async noise (Howard-Jones and Rosen, 1993; Ozmeral et al., 2012). The current study tested monaural and dichotic maskers, following the same procedures used in our previous experiment evaluating only normal-hearing listeners (Ozmeral et al., 2012), to investigate the effect of spread of masking on asynchronous glimpsing for hearing-impaired listeners. In addition to testing hearing-impaired listeners, normal-hearing listeners were tested using the Baer and Moore (1993) method of spectral smearing in order to dissociate key impairments associated with hearing loss: reduced frequency resolution and reduced audibility. Finally, a computational model based on a glimpsing algorithm (Cooke, 2006) was created to explore the relative roles of reduced audibility and reduced frequency resolution in the asynchronous glimpsing paradigm.
11
for speech perception in spectro-temporally complex backgrounds could lay the foundation for more effective pre-processing procedures in auditory prostheses.
1.4 Outline of Dissertation
Along with the background information put forth in Chapter 1, the following chapters report on three independent but inter-related experiments conducted as part of the author’s degree requirements. In Chapter 2, Experiment 1 is reported. The purpose of this experiment was to test hearing-impaired listeners on speech recognition in the presence of various masking noises. We examined speech recognition in noise that was unmodulated, synchronously modulated, or asynchronously modulated. The asynchronous masker
conditions were of key interest because they reflect the ability to integrate glimpsed speech across time and frequency. Consistent with the view that spread of masking has a negative effect on speech recognition, we expected hearing-impaired listeners to perform poorly in monaural asynchronous conditions. However, separating frequency bands that are associated with out-of-phase masker modulation, via dichotic presentation, should have limited the effects of spread of masking and improved performance. Importantly, the improvement between monaural and dichotic conditions was expected to be comparable to or greater than that found with normal-hearing listeners, to the extent that spread of masking was more detrimental for hearing-impaired listeners.
In Experiment 2 (Chapter 3), we attempted to dissociate the roles of reduced audibility and reduced frequency resolution in hearing-impaired listeners’ performances in the
12
benefit of dichotic presentation in the asynchronous glimpsing task. The relative impact of reduced frequency resolution was assessed by comparing the data between reduced audibility alone and a combination of reduced audibility and spectral smearing, simulating a loss of frequency resolution. Based on findings in the literature and from our first experiment, reduced audibility likely limited the MR achieved in either dichotic or monaural conditions. In addition, benefit from dichotic presentation was expected to be more pronounced for spectrally smeared stimuli than when only reduced audibility was taken into account.
In the final experiment (Experiment 3), reported in Chapter 4, we tested the impact of audibility and frequency resolution in a computational glimpsing model. There has been some success in modeling speech recognition in fluctuating noise based on the combination of sparse glimpses of the signal and prior template learning (Cooke, 2006). Because windows prime for glimpsing are subjected to spread of masking, it follows that a binaural model based on Cooke’s glimpsing model would also account for the benefit of dichotic listening. Consistent with the effect spectral smearing has in noise, it was expected that the glimpsing model would be consistent with the data obtained from normal-hearing listeners and from normal-hearing listeners with reduced presentation levels and spectrally smeared stimuli in the behavioral experiments. However, no attempt was made to account for higher-level processing of the brain, so the possibility of additional cognitive factors remained a possible explanation of the results.
13
CHAPTER 2: EXPERIMENT 1 – EFFECTS OF HEARING IMPAIRMENT
2.1 Introduction
Studies have shown that taking advantage of high SNRs at masker envelope minima, also known as glimpsing, is important to understanding speech in fluctuating noise. Because the spectral regions associated with high SNRs can vary dynamically in time, glimpsing requires the integration of speech cues across both frequency and time (Miller and Licklider, 1950; Howard-Jones and Rosen, 1993; Buss et al., 2004; Cooke, 2006; Hall et al., 2008). Only a few studies have demonstrated hearing-impaired listeners’ abilities to integrate sparse speech cues across frequency and time (Hall et al., 2008; Hall et al., 2012). Hall et al. (2008)
concluded that hearing-impaired listeners did not have an inherent deficiency integrating speech cues across frequency, while Hall et al. (2012) demonstrated less MR for hearing-impaired listeners with spectro-temporally-modulated maskers than for normal-hearing listeners. In the presence of noise, hearing-impaired listeners may have to overcome additional factors which normal-hearing listeners are not susceptible to.
In the following experiment, we test the hypothesis that hearing-impaired listeners can benefit from a dichotic presentation of the Async masker used in our previous study
14
characterized by reduced sensitivity to sound as well as broader auditory filters, and therefore greater susceptibility to spread of masking. As a result, techniques to limit spread of masking may be particularly effective in improving glimpsing of speech for hearing-impaired
listeners. Such an outcome would suggest that attempts to improve hearing-aid technology should include efforts to reduce the effects of peripheral spread of masking.
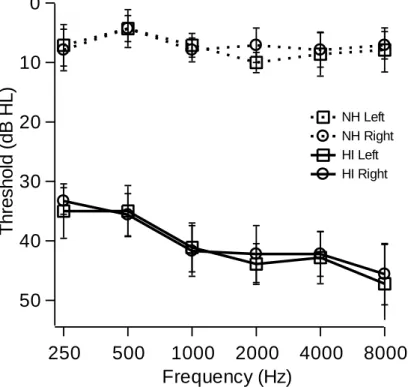
Figure 2.1: Audiograms for normal-hearing (NH; n = 7; dotted lines) and hearing-impaired (HI; n = 9; solid lines) listeners for both left (squares) and right (circles) ears in dB hearing level (HL). HI listeners were screened to have roughly flat and symmetric mild-to-moderate hearing loss. Error bars represent the standard error of the mean.
2.2 Method
2.2.1 Listeners
Sixteen native English-speaking adults were recruited from the local and surrounding communities. Listeners had either normal-hearing (n = 7) with a criterion of 20 dB hearing level or better at octave frequencies from 0.25 to 8 kHz in each ear (ANSI, 2010), or listeners had mild-to-moderate sensorineural hearing loss (n = 9) with mostly flat and symmetric loss
50 40 30 20 10 0 T h re s h o ld ( d B H L )
250 500 1000 2000 4000 8000 Frequency (Hz)
15
no worse than 60 dB hearing level. Ages ranged from 21 to 68 years old and were roughly matched across groups (normal-hearing group: μ = 42.9, s.d. = 14.4; hearing-impaired group: μ = 46.6, s.d. = 18.5). Listeners over the age of 60 yrs (1 normal-hearing and 2 hearing-impaired listeners) were asked to complete a cognitive assessment before completing the experiment (Montreal Cognitive Assessment; Nasreddine et al., 2005). Inclusion criteria were set at a score of 26 or better, and all older subjects who met audiometric criteria for inclusion in the study also passed this assessment. Demographic information is reported in Table 2.1, and Figure 2.1 presents the average audiograms for each group.
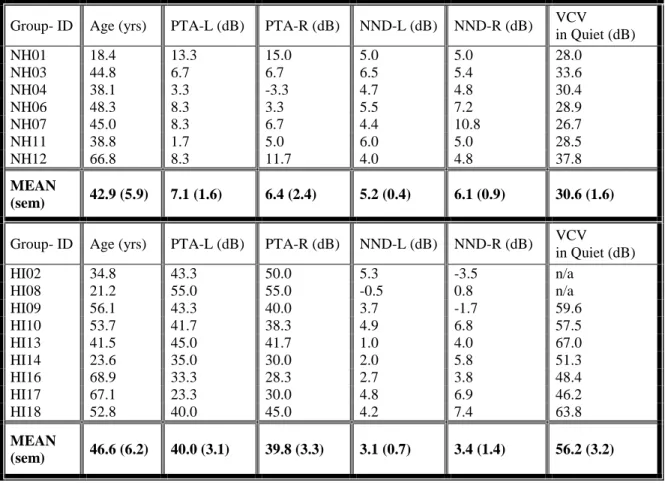
Table 2.1: Normal-hearing (NH) and hearing-impaired (HI) subject information, including age, pure-tone average (PTA) for 0.5, 1, and 2 kHz for the left (L) and right (R) ears, notched-noise differences (NND) for each ear, and speech reception thresholds of vowel-consonant-vowels (VCV) in quiet. In-quiet speech reception thresholds are not available for two hearing-impaired listeners due to a previous version of the training only requiring 100% accuracy of stimuli at a comfortably loud level. Means are displayed under each column for each group with the standard error of the mean in parentheses.
Group- ID Age (yrs) PTA-L (dB) PTA-R (dB) NND-L (dB) NND-R (dB) VCV in Quiet (dB)
NH01 18.4 13.3 15.0 5.0 5.0 28.0
NH03 44.8 6.7 6.7 6.5 5.4 33.6
NH04 38.1 3.3 -3.3 4.7 4.8 30.4
NH06 48.3 8.3 3.3 5.5 7.2 28.9
NH07 45.0 8.3 6.7 4.4 10.8 26.7
NH11 38.8 1.7 5.0 6.0 5.0 28.5
NH12 66.8 8.3 11.7 4.0 4.8 37.8
MEAN
(sem) 42.9 (5.9) 7.1 (1.6) 6.4 (2.4) 5.2 (0.4) 6.1 (0.9) 30.6 (1.6)
Group- ID Age (yrs) PTA-L (dB) PTA-R (dB) NND-L (dB) NND-R (dB) VCV in Quiet (dB)
HI02 34.8 43.3 50.0 5.3 -3.5 n/a
HI08 21.2 55.0 55.0 -0.5 0.8 n/a
HI09 56.1 43.3 40.0 3.7 -1.7 59.6
HI10 53.7 41.7 38.3 4.9 6.8 57.5
HI13 41.5 45.0 41.7 1.0 4.0 67.0
HI14 23.6 35.0 30.0 2.0 5.8 51.3
HI16 68.9 33.3 28.3 2.7 3.8 48.4
HI17 67.1 23.3 30.0 4.8 6.9 46.2
HI18 52.8 40.0 45.0 4.2 7.4 63.8
MEAN
16
2.2.2 Stimuli
Stimuli were identical to the ones found in Ozmeral et al. (2012). The speech material included five recordings each for 12 vowel-consonant-vowels ([b d f g k m n p s t v z] as in /aga/) spoken by an adult female speaker from this lab and recorded at 44.1 kHz sampling rate. Stimulus duration ranged from 528 to 664 ms, with a mean duration of 608 ms. Each token was normalized to equal root-mean-square (rms) level and filtered into 2, 4, 8, or 16 frequency bands using sixth-order Butterworth band-pass filters. For a given number of bands, filter bandwidths were quivalent in logarithmic units, with bands spanning 0.1 to 10 kHz.
Maskers were based on broadband pink noise samples that, by definition, contained equal energy per octave band. Each masker sample was generated digitally with duration equal to the longest possible speech token plus 300 ms (964 ms total duration). Presentations of speech stimuli began 150 ms after the onset of the noise masker. Masker modulation could be performed either synchronously or asynchronously (i.e., in-phase or out-of-phase across frequency, respectively). Sync maskers were modulated in the time-domain with a 10-Hz square wave. To create Async maskers, the pink noise was filtered into 2, 4, 8, or 16 bands using sixth-order Butterworth band-pass filters. Then, a 10-Hz square wave was applied to each noise band via multiplication, with a starting phase alternating between starting on and starting off in neighboring bands. In order to limit spectral energy to the specified frequency region, 10-ms raised cosines were used to smooth these modulation transitions. The level of the full stimulus was fixed at 85 dB SPL. To achieve this, speech and masker were
17
(in dB). Before stimulus presentation, speech and noise signals were up-sampled to 48,828 Hz to conform to hardware specifications.
Either monaural (left [L] or right [R] ear only) or dichotic (D) stimuli were presented in a single block of trials. Dichotic stimulation included the odd-numbered bands of the combined speech and noise to the left ear and even-numbered bands to the right ear. In some cases, masker bands were presented to a single ear without the associated speech bands (see dichotic controls described below).
2.2.3 Procedure and conditions
Procedures were similar to those used by Ozmeral et al. (2012). Speech reception thresholds were measured using an adaptive up-down tracking algorithm estimating 50% correct identification (Levitt, 1971). The adaptive computer-controlled test procedure used a custom graphical user interface administered through Matlab (Mathworks, Inc, Natick, MA) on a personal computer. Stimuli were presented through a pair of insert earphones (Etymotic ER-2, Elk Grove Village, IL), and listeners were seated in a single-wall, sound-treated booth. The initial SNR level was set to 10 dB for each condition, and SNR increased or decreased by 4 dB, depending on whether a response from the listener was incorrect or correct,
18
Listeners first performed the test with no masking (i.e., in quiet). These measures primarily served as a familiarization tool, but data were also included as another measure of hearing ability (results reported in Table 2.1).6 For each noise-masking trial, a speech token was randomly selected with replacement, and a masker was generated and summed with the speech signal. Listeners indicated their response by selecting 1 of 12 buttons on the computer screen using a mouse.
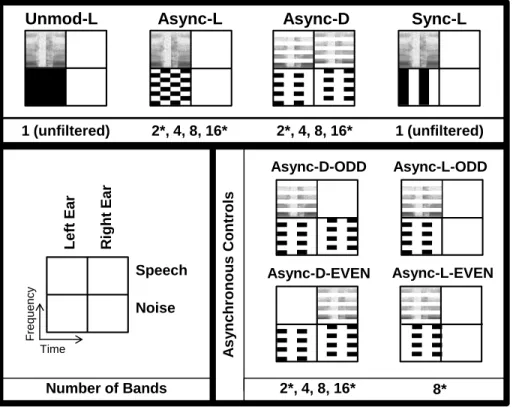
Figure 2.2 illustrates the key features of the 28 total conditions described below. The baseline condition was the unmodulated noise condition and was presented monaurally in each ear (Unmod-L and Unmod-R). The Sync condition was presented monaurally to each ear as well (Sync-L and Sync-R). For each Async monaural and dichotic condition (Async-L, Async-R and Async-D, respectively), stimuli were processed into 2, 4, 8, or 16 bands for a total of twelve Async test conditions. Additionally, there were two types of control condition for the Async-D conditions. The first set of control conditions presented the Async-D masker (with 2, 4, 8, or 16 bands) but included only half of the speech bands: in Async-D-EVEN, the even speech bands were presented to the right ear, and in Async-D-ODD, the odd speech bands were presented to the left ear. These control conditions were intended to reveal whether performance in the Async-D conditions could be accounted for solely by either the even or odd speech bands alone. By including the masker in both ears but speech in only one ear, we were also able to test the possibility that maskers could have an across-ear affect (i.e., contralateral effects). Two additional control conditions in each ear were also run that
removed the possibility of contralateral effects. In these conditions, only half of the Async-D masker and speech bands were presented (either Async-L/R-ODD in which only the left or
6 For the first two hearing-impaired subjects, only 100% accuracy in quiet was required for comfortably loud
19
right ear received odd-numbered frequency bands or Async-L/R-EVEN in which only the left or right ear received even-numbered frequency bands). These conditions were only run using 8 band-pass filters (i.e., 4 bands per ear).
Figure 2.2: Schematic of masker conditions for all experiments. Primary conditions are represented on the top row, and controls are shown below. Only left-ear (L) schematics are visually depicted for
monaural conditions, but right (R) ear conditions were also tested. As the legend indicates, each condition is represented as a 2-by-2 box in which the left and right columns represent stimulation of the left and right ears, respectively, and the top and bottom rows represent the speech and noise stimuli, respectively. In each box, frequency from 0.1 to 10 kHz is represented vertically, and a time span of 200 ms is
represented horizontally. Speech is represented via spectrogram, and noise is represented by black spectro-temporal regions indicating the “on” periods of masker modulation. Amplitude modulation is performed at a rate of 10 Hz, and frequency bands are filtered in equal widths on a logarithmic scale. The order of the primary conditions in the top row is an indication of the expected ranking in thresholds, with the worst performance starting on the left, with the Unmod-L and Unmod-R conditions, and the best performance on the right, with the Sync-L and Sync-R conditions. The numbers of bands tested per condition are given below each condition schematic. Asterisks indicate bands used only in experiment 1.
To simplify the report on the monaural and dichotic controls, data were analyzed for the better of the associated conditions (ODD versus EVEN bands). For instance, on a subject-by-subject basis, the better threshold in either the Async-D-ODD or Async-D-EVEN was the only dichotic control threshold used to assess the performance on control conditions. The
Unmod-L Async-L Async-D Sync-L
Async-D-ODD Async-D-EVEN Async-L-EVEN Async-L-ODD Speech Noise L eft Ear R ig h t Ear Time F req ue nc y A s y nch ron ou s Co ntr ol s
2*, 4, 8, 16* 2*, 4, 8, 16*
2*, 4, 8, 16* 8* Number of Bands
20
better of the dichotic controls is reported in Table 2.3 as Control-D, and the better of the monaural controls is reported as either Control-L or Control-R. We used the lower (better) of the two control thresholds to evaluate performance in the primary Async conditions because it would provide the most conservative measure of integration when all bands were available.
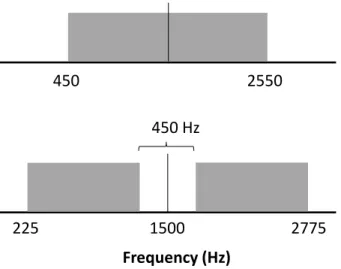
Figure 2.3: Schematic of the frequency spectrum for the notched-noise method for estimating a listener’s frequency resolution. Listeners performed a 3-AFC task in which they needed to detect a tone at 1500 Hz (vertical line) in the presence of a band-pass noise centered at the signal frequency (top; no-notch
condition) or in the presence of two band-pass noises, one on either side of a 450 Hz-wide protected region (bottom; notch condition).
Frequency resolution of each listener was measured by estimating a pure tone threshold in the presence of a either a spectrally contiguous masker or two bands of noise separated by a protected region around the probe frequency (Glasberg and Moore, 1990). Figure 2.3 illustrates the two test conditions. The signal was a 1500-Hz pure tone. In the no-notch condition (top), the masker was a 2100-Hz wide noise centered at the signal frequency. In the notch condition (bottom), a 450-Hz wide protected region centered on 1500 Hz was
introduced, and a 1050-Hz band of noise flanked either side of the protected region. The difference between thresholds in the no-notch and notch conditions (notched-noise
difference) is inversely proportional to the estimated width of the auditory filter at the signal Frequency (Hz)
1500
450 2550
225 2775
21
frequency. A large notched-noise difference would be consistent with relatively good
frequency resolution, whereas a small notched-noise difference would suggest relatively poor frequency resolution. Individual notched-noise difference values for each ear are reported in Table 2.1.
Table 2.2: Mean speech reception thresholds (in dB SNR) from Experiment 1 are reported for each primary test condition. The standard error of the mean for normal-hearing (n = 7) and hearing-impaired (n = 9) groups is shown in parentheses next to the associated mean. Monaural (L and R) thresholds for Unmod. Sync, and Async conditions were averaged and given the labels, Unmod-M, Sync-M, and Async-M, respectively. The dichotic asynchronously modulated noise condition is labeled Async-D. See Figure 2.2 for visual representation of key conditions.
Normal Hearing
Number of Bands
2 4 8 16
Unmod-M -0.3 (0.6) Sync-M -25.5 (1.5)
Async-M -17.8 (1.3) -13.0 (0.6) -4.7 (1.2) -4.1 (0.8) Async-D -24.9 (1.7) -20.8 (1.8) -20.1 (1.7) -18.9 (1.0) Hearing
Impaired
Number of Bands
2 4 8 16
Unmod-M 0.3 (0.5) Sync-M -7.7 (1.2)
Async-M -5.6 (0.9) -3.0 (0.5) -2.1 (0.5) -2.9 (0.4) Async-D -9.1 (1.3) -6.0 (1.4) -5.7 (1.2) -7.1 (1.0)
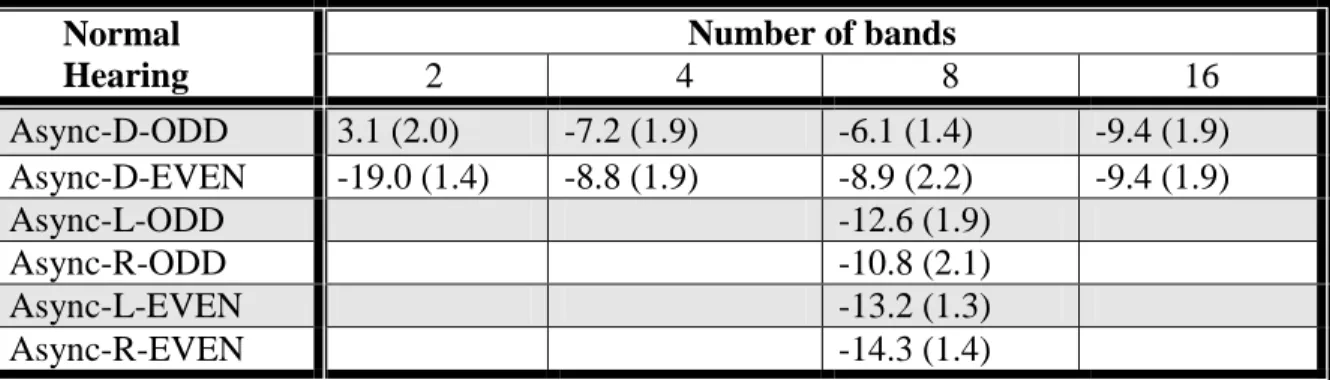
Table 2.3: Mean speech reception thresholds (in dB SNR) for the dichotic and monaural controls in Experiment 1. Control conditions included the same masker as in the primary test condition but only half of the speech bands; for example, the 8-band Async-D-ODD controls included the Async-D masker with odd bands in the left ear and even bands in the right ear, while only the odd speech bands were included in the left ear and no speech was present in the right ear. For the dichotic control conditions, Control-D was the average the lower threshold in the Async-D-ODD and Async-D-EVEN conditions for each subject. For the monaural controls, the better of the Async-L/R-ODD and Async-L/R-EVEN for each subject is given by Control-L and Control-R, respectively. See Figure 2.2 for visual representation of conditions.
Normal Hearing
Number of bands
2 4 8 16
Async-D-ODD 3.1 (2.0) -7.2 (1.9) -6.1 (1.4) -9.4 (1.9) Async-D-EVEN -19.0 (1.4) -8.8 (1.9) -8.9 (2.2) -9.4 (1.9)
Async-L-ODD -12.6 (1.9)
Async-R-ODD -10.8 (2.1)
Async-L-EVEN -13.2 (1.3)
22
Control-D 19.0 (1.4) -10.6 (1.8) -10.7 (1.1) -10.4 (1.7)
Control-L -14.7 (1.5)
Control-R -14.6 (1.4)
Hearing Impaired Number of bands
2 4 8 16
Async-D-ODD 5.0 (2.1) 2.7 (1.6) 5.4 (1.5) -1.4 (0.8) Async-D-EVEN -2.7 (1.8) -1.4 (0.6) -1.2 (0.6) 3.8 (0.8)
Async-L-ODD 4.0 (2.3)
Async-R-ODD 3.0 (1.6)
Async-L-EVEN -4.7 (0.7)
Async-R-EVEN -6.4 (1.2)
Control-D -2.8 (1.8) -2.4 (0.7) -1.2 (0.6) -1.4 (0.8)
Control-L -4.7 (0.7)
Control-R -5.4 (1.4)
Figure 2.4: Mean masking release in Experiment 1 is plotted for modulated noise conditions relative to the unmodulated condition for normal-hearing (left panel) and hearing-impaired (right panel) groups. The differences in mean thresholds relative to the Unmod condition at 2, 4, 8, or 16 bands are plotted for the monaural asynchronous condition (Async-M; circles), the dichotic asynchronous condition (Async-D; triangles), the better of dichotic control conditions (Async-B; bowties), and the mean of the synchronous conditions (Sync-M; straight line). Error bars indicate standard error of the mean (n = 7 for normal-hearing group; n = 9 for normal-hearing-impaired group).
25 20 15 10 5 0 M as k ing R eleas e (dB)
2 4 8 16
Number of Bands
25 20 15 10 5 0 M as k ing R eleas e (dB)
2 4 8 16
Number of Bands Sync-M Async-M Async-D Control-D
23 2.3 Results
2.3.1 Normal-hearing group speech reception thresholds and masking release (MR)
Mean speech reception thresholds for normal-hearing listeners are presented in Table 2.2 (top) for all primary test conditions. The speech reception thresholds for control conditions are presented in Table 2.3 (top). Thresholds in the Unmod-L and Unmod-R were not significantly different (t[6] = -0.4, p > .05), so the average is reported (Unmod-M). Speech reception thresholds in the Sync-R and Sync-L conditions were also not significantly different from each other (t[6] = 0.6, p > .05), so the average of these two conditions is shown in Table 2.2 (Sync-M). The speech reception thresholds in the Async-R and Async-L conditions at each band were not significantly different from each other either (2 band: t[6] = 1.7, p > .05; 4 band: t[6] = -0.4, p > .05; 8 band: t[6] = 0.9, p > .05; 16 band: t[6] = 1.5, p > .05), so the average of threshold for each ear is shown in Table 2.2 for each band number.
To measure the ability to glimpse speech in a fluctuating masker, data were analyzed in terms of MR, quantified as the difference in speech reception thresholds between a condition with modulated noise and the Unmod-M case. The speech reception thresholds for all
24
intermediate for Async-D (ranging from 18.6 to 24.6 dB), and least for Async-M (ranging from 3.9 to 17.5 dB). A two-way repeated-measures analysis of variance (ANOVA) was performed to compare performance in Async-D and Async-M, with two levels of condition and four levels of band number. This analysis yielded a main effect of condition (F[1,6] = 108.8, p < .001), a main effect of the number of bands (F[3,18] = 64.5, p < .001), and an interaction (F[3,18] = 15.1, p<.001). The interaction is explained by the greater separation between conditions as the band number increases. In all, the results replicate the findings in (Ozmeral et al., 2012) that MR is higher in the Async-D than the Async-M conditions at all bands.
2.3.2 Hearing-impaired group speech reception thresholds and masking release (MR)
Mean speech reception thresholds for the hearing-impaired listeners are presented in Table 2.2 (bottom) for all conditions. Thresholds in the Unmod-L and Unmod-R were not significantly different (t[8] = 0.7, p > .05) and were averaged for subsequent analysis. The speech reception thresholds for the Sync-R and Sync-L conditions were also not significantly different (t[8] = 2.1, p > .05), so the average speech reception thresholds of these two
conditions is reported in Table 2.2. Finally, speech reception thresholds in the Async-R and Async-L conditions for each band number were not significantly different either (2 band: t[8] = -0.2, p > .05 ; 4 band: t[8] = 2.1, p > .05; 8 band: t[8] = 1.5, p > .05; 16 band: t[8] = 1.2, p > .05), so the average speech reception thresholds of these two conditions is reported in Table 2.2 for each band number.
Hearing-impaired listeners’ speech reception thresholds for all modulated masker
25
as was also seen with the normal-hearing listeners. Figure 2.4 (right panel) shows MR (in dB) for Async-M, Async-D, Sync-M, and Control-D for the hearing-impaired group, measured relative to the speech reception threshold for the Unmod-M reference. Error bars show one standard error of the mean, and symbols indicate the masker condition, as defined in the legend. The MR for hearing-impaired listeners was greatest for Sync-M (average of 8.0 dB) and for Async-D (ranging from 6.0 to 9.4 dB), while MR was consistently smaller for Async-M (ranging from 2.4 to 5.9 dB). A two-way repeated-measures ANOVA was
performed to compare performance in the Async-D and Async-M conditions, with two levels of condition and four levels of band number. This analysis yielded a main effect of condition (F[1,8] = 10.2, p < .05), a main effect of the number of bands (F[3, 24] = 15.7, p < .001), but no interaction (F[3, 24] = 0.4, p > .05), indicating that thresholds were similarly affected in the two conditions as band number changed, which was contrary to what was seen for normal-hearing listeners. In general, the speech reception was better, as indicated by the larger MR, in the dichotic Async condition than the monaural Async condition (i.e., dichotic advantage), as was the case for the normal-hearing listeners.
2.3.3 Between-group analysis of speech reception thresholds and masking release (MR)
Speech reception thresholds in the Unmod-M case were submitted to a one-way ANOVA. This analysis showed no significant difference between the normal-hearing and hearing-impaired listeners (F[1,14] = 0.53, p = .48), which indicated that at an overall presentation level of 85 dB SPL, hearing-impairment did not affect speech reception in steady noise.
26
one-way ANOVA for the Sync-M case indicated that normal-hearing listeners had significantly greater MR (F[1,14] = 75.8, p < .001).With respect to the Async noise
conditions, data were submitted to a three-way ANOVA with two levels of presentation type (dichotic and monaural), four levels of number of bands (2, 4, 8, and 16), and two levels of listener group (normal-hearing and hearing-impaired). This analysis showed significant main effects of presentation type (F[1,14] = 87.4, p < .001), number of bands (F[3,42] = 77.9, p < .001), and listener group (F[1,14] = 58.1, p < .001). There were also significant interactions between condition and band number (F[3,42] = 12.4, p < .001), between condition and group (F[1,14] = 23.6, p < .001), and between band number and group (F[3,42] = 27.7, p < .001). Lastly, the three-way interaction was significant (F[3,42] = 8.8, p < .001), indicating that effects of band number on the MR in the two Async masker conditions were different between normal-hearing and hearing-impaired listeners. From Figure 2.4, we can see that while normal-hearing listeners tend have less MR in both noise conditions as the number of bands increases, hearing-impaired listeners show relatively flat MR for all numbers of bands. The absence of an effect of band number in the hearing-impaired data may be influenced by the smaller range of MR relative to the normal-hearing listeners.
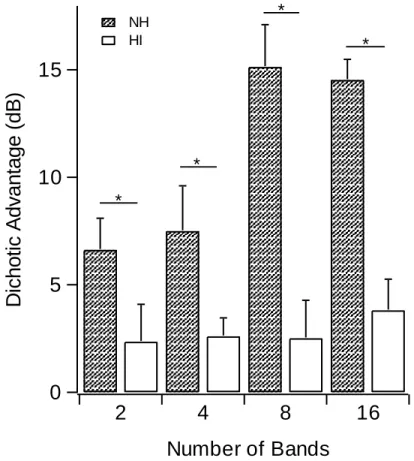
2.3.4 Dichotic advantage between groups
The differences in MR between Async-D and Async-M conditions – referred to as dichotic advantage – is presented in Figure 2.5 for normal-hearing (striped bars) and hearing-impaired (white bars) listeners. For hearing-hearing-impaired listeners, there was a consistent
hearing-27
impaired group. A two-way ANOVA with two levels of group and four levels of number of bands showed a clear between-subjects group effect (F[1,14] = 87.4, p < .001), indicating that the normal-hearing group had significantly greater dichotic advantage than the hearing-impaired group. Using a linear-contrast model, a main effect was found for number of bands (F[1,14] = 25.5, p < .001), and there was an interaction with group (F[1, 14] = 8.8, p < .001) – supporting the observation that the dichotic advantage increased with band number for the normal-hearing group, but did not increase as much (if at all) for the hearing-impaired group.
Figure 2.5: Dichotic advantage (i.e., the difference between Async-D and Async-M conditions) for both normal-hearing (NH) and hearing-impaired (HI) groups. Whereas the dichotic advantage increased significantly for the normal-hearing listeners as band number increased, hearing-impaired listeners received similar benefit at all band numbers. Stars indicate significant differences of means at each band number (p < .001).
15
10
5
0
D
ic
h
o
ti
c
A
d
v
a
n
ta
g
e
(
d
B
)
2
4
8
16
Number of Bands
28
2.3.5 Dichotic advantage and consonant errors
29
present, and therefore, listeners could have used one ear or the other to identify each consonant. If listeners were benefitting from the dichotic presentation due to certain
consonants being easier in a subset of bands, then our interpretation of the dichotic advantage as reflecting integration of glimpses would be undermined. In other words, if the
interpretation in terms of spread of masking is correct, that removing spread of masking would lead to better glimpsing opportunities conducive to better integration, then error patterns would be similar across conditions.
30
were more or less difficult depending on the presentation type. There are less visible instances where that is the case for hearing-impaired listeners, which may explain the three-way interaction. The results of this analysis suggests that for 2, 4, and 16 bands, listeners appear to use similar cues to recognize speech in the Async-D and Async-M conditions, but it is possible, that with 8-bands, normal-hearing listeners were utilizing different cues in the two conditions.
2.3.6 Between-group analysis of controls
31
band conditions in Howard-Jones and Rosen’s (1993) original study, there was some question as to whether listeners were simply attending to half of the frequency bands with modulation in phase, but control data indicated that in the 2-band condition, listeners were integrating glimpses across time neighboring frequencies. However, the same control masker conditions in which one band was modulated and the other was steady resulted in comparable speech reception thresholds for the 4-band condition, suggesting listeners could theoretically rely on a portion of the stimulus and were not necessarily integrating glimpses across time and frequency in the Async condition.
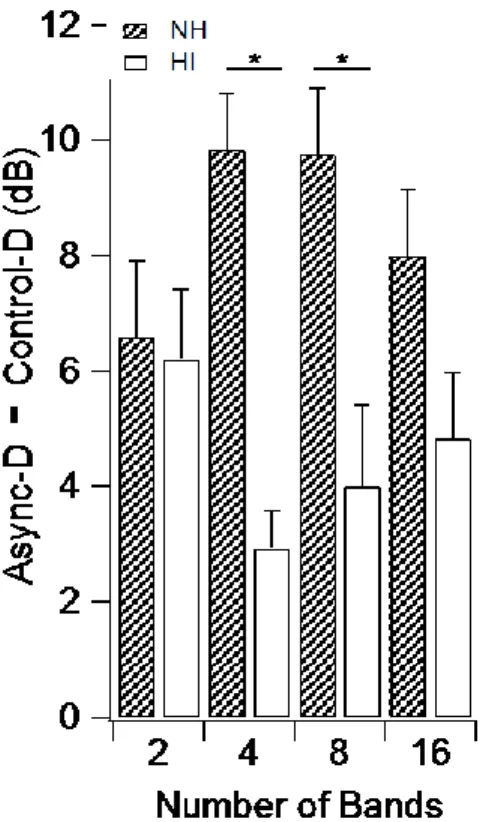
In the current experiment, performance in the Async-D conditions was uniformly better than the either Async-D-ODD or Async-D-EVEN control conditions for both groups. Figure 2.7 presents the difference in MR between Async-D and Control-D (the better of the two dichotic controls) for both groups. Values ranged from 5.9 to 10.2 dB for normal-hearing subjects and from 3.5 to 6.3 dB for hearing-impaired subjects, depending on the number of bands. Two-tailed t-tests indicated that Async-D thresholds were consistently better than Control-D thresholds at each band number (2-tailed t-tests, p < .001), consistent with an interpretation that listeners were making use of information from spectral regions associated with both the even and odd bands.7
Recall that in the Async-D-EVEN and Async-D-ODD conditions, the noise-only ear received bands of noise that were modulated out-of-phase relative to the masker modulation in the ear with a speech signal. We compared the Control-D and Control-L/R measures at 8 bands to assess the effect of having the modulated masker in the opposite ear of the ear with speech. For normal-hearing listeners, the monaural controls had 4 dB greater MR than the
7 Although integration appears to be independent of the number of bands (F[3,42] = 0.4, p = 0.7), there is a main
32
dichotic control. Similarly, hearing-impaired listeners had roughly 4.5 dB greater MR in the monaural controls. From these results, it appears that having a modulated masker in non-overlapping frequency regions in one ear can mask speech in the other ear. This is
remarkable because in most cases, listeners do not achieve as high of MR in the Async-D conditions as they do in the Sync condition, indicating that although the effects of masking spread have been removed in the Async-D condition, there appears to be some other factor limiting performance in the dichotic condition. We will address these other possible factors in the discussion.
2.3.7 Notched-noise test of frequency resolution
To address the role of frequency resolution in the speech perception results, an estimate of frequency resolution was measured for each listener using the notched-noise method. This frequency resolution measure is taken as the difference in threshold between no-notch and notch conditions (in dB). From Table 2.1, it can be seen that the normal-hearing group had an average of roughly 3-dB greater notched-noise difference than the hearing-impaired group, which is consistent with the notion that for a fixed notch-width, hearing-impaired listeners have a greater-than-normal level of masking energy at the output of an auditory filter
33 2.4 Discussion
2.4.1 Energetic masking release for normal-hearing and hearing-impaired groups
Previous studies by Howard-Jones and Rosen (1993) and our lab (Ozmeral et al., 2012) have shown MR for speech in the presence of Async maskers. In the Howard-Jones and Rosen study, speech and maskers were presented diotically (i.e., identical stimuli presented to each ear). In their study, MR was present for two bands and four bands, but not for greater numbers of bands. Ozmeral et al. (2012) aimed to reduce the deleterious effects of spread of masking by presenting neighboring spectral regions in the noise dichotically (i.e., odd-numbered bands in the left ear and even-odd-numbered bands in the right ear). The result was an average of 7.3 dB better speech reception thresholds across all band conditions in the Async-D condition relative to a monaural Async condition, and data from control conditions suggested that the benefit was a result of integrating speech information from both ears across time and frequency. The current study replicated much of the Ozmeral et al. (2012) experiment for normal-hearing listeners and added a hearing-impaired group to determine whether listeners with sensorineural hearing loss could also benefit from dichotic listening in an asynchronous glimpsing task. Because hearing-impaired listeners are known to have poorer-than-normal frequency resolution, it was hypothesized that MR would be severely impaired in a monaural asynchronous masker, so dichotic listening benefit had the potential to be comparable or even greater than in normal-hearing listeners.
As in our previous study (Ozmeral et al., 2012), the current normal-hearing group
34
study. The difference between data from normal-hearing listeners in the current and previous studies could be due to methodological differences. Specifically, the current procedure called for all stimuli to be presented at an overall level of 85 dB SPL, whereas the previous
experiment fixed the target level at 55 dB SPL and varied the masker level to measure
threshold. Because this task has been shown to be susceptible to changes in presentation level (see Experiment 2 in Ozmeral et al., 2012), and sensation level can influence speech
understanding in modulated noise (e.g., George et al., 2006), it is not surprising that we see minor differences in results between the two normal-hearing groups.
The hearing-impaired listeners did not achieve comparable dichotic advantage to normal-hearing listeners in terms of magnitude (only 3.5 dB dichotic advantage on average).
Although this could be seen as being counter to our prediction that hearing-impaired listeners would achieve comparable benefit from dichotic presentation, it is probably inappropriate to make direct comparisons between the dB values of the two groups in the current
Figure 2.8: Similar to Figure 2.4 except masking release (MR; the difference between speech reception thresholds in the modulated masker conditions and the baseline condition) is normalized to the Sync MR for normal-hearing (left) and hearing-impaired (right) listeners.
140 120 100 80 60 40 20 0 M as k ing R eleas e / Sy nc M R (%)
2 4 8 16
Number of Bands
140 120 100 80 60 40 20 0 M ask ing R elea s e / Sy nc M R (%)
2 4 8 16
Number of Bands Async-D Async-M
35
configuration. Not only was dichotic advantage significantly smaller in the hearing-impaired group, MR for all modulated maskers was significantly smaller. This result is generally consistent with previous findings showing that hearing-impaired listeners tend to have smaller MR in fluctuating maskers compared to normal-hearing listeners when stimuli are presented at equal levels (Festen and Plomp, 1990; Bronkhorst and Plomp, 1992; Gustafsson and Arlinger, 1994; Peters et al., 1998; Snell et al., 2002), especially for single syllable stimuli (Jin and Nelson, 2006). Although some of this result may be explained by lower sensation in the masker dips or possibly poorer temporal resolution (cf. George et al., 2006; Jin and Nelson, 2006), it may still be that MR is also limited by poor frequency resolution (Jin and Nelson, 2010). Given the overall difference of MR between the groups across all conditions, it may be instructive to examine group differences in the Async conditions when groups are normalized with respect to MR in the Sync condition.
2.4.2 Normalization to Sync MR
The average dichotic advantage for hearing-impaired listeners was significantly positive, and although it was considerably less than shown by the normal-hearing group, other studies have also shown less MR in hearing-impaired subjects relative to normal-hearing listeners when presentation levels were held constant (e.g., Festen and Plomp, 1990). Therefore, dichotic advantage was also unlikely to reach levels seen in the normal-hearing group because it is associated with the size of the MR in the Async-M and Async-D conditions. In order to interpret dichotic advantage differences between normal-hearing and
36
Figure 2.8 displays the transformed Async-M (circles) and Aync-D (triangles) MR data, plotted as a percent of the MR in the Sync condition for the normal-hearing (left panel) and hearing-impaired (right panel) groups. Figure 2.9 displays the corresponding dichotic advantage for transformed data for both groups. Statistical analysis of the normalized data yields group differences in normalized MR (F[1,14] = 5.1, p < .05) due to overall greater values for hearing-impaired listeners. However, the dichotic advantage was not statistically different (F[1,14] = .004, p = .95), suggesting that each group received a similar benefit with dichotic listening after normalization. The results of this analysis are consistent with an interpretation that while hearing-impaired listeners are limited by their ability to glimpse overall, dichotic stimulation provided a benefit proportionally similar to that achieved by normal-hearing listeners. The consequence of normalization was that, in one way, the two groups could be viewed as having similar benefits of dichotic listening.
2.4.3 Summary
Masking release in all conditions was significantly smaller for hearing-impaired listeners when compared to normal-hearing listeners. The results of Experiment 1, however, indicated that hearing-impaired listeners still benefited from dichotic presentation of stimuli when maskers were asynchronously modulated. Although hearing-impaired listeners appear to have less MR at current stimulus intensities, the amount of benefit from dichotic listening was comparable to that of normal-hearing listeners when analyzed relative to MR in the Sync condition.
37
with sensorineural hearing loss. The evidence suggests that dichotic listening was beneficial for both listening groups. Because hearing-impaired listeners suffer from both reduced audibility and reduced frequency resolution, though, it is difficult to dissociate the roles each have in the current design. In Experiment 2, hearing impairment was simulated in normal-hearing listeners with varying degrees of frequency resolution in order to make this dissociation.
38
CHAPTER 3: EXPERIMENT 2 – EFFECTS OF SIMULATED HEARING LOSS
3.1 Introduction
Early studies of normal speech perception in noise observed that performance was better for amplitude-modulated maskers when compared to steady maskers (i.e., MR; Miller and Licklider, 1950). The ability to take advantage of robust speech cues in fluctuating
backgrounds has been attributed to integration of glimpses – the available speech information associated with spectro-temporal epochs of favorable local SNR (Howard-Jones and Rosen, 1993; Cooke, 2006; Ozmeral et al., 2012). Studies show that MR is typically smaller in hearing-impaired listeners relative to normal-hearing listeners (as in Experiment 1; Carhart and Tillman, 1970; Duquesnoy and Plomp, 1983; Festen and Plomp, 1990; Bronkhorst and Plomp, 1992; Gustafsson and Arlinger, 1994; Peters et al., 1998; Lorenzi et al., 2006; Bernstein and Grant, 2009; Strelcyk and Dau, 2009a). Because fluctuating maskers are common in natural settings, it is unsurprising that hearing-impaired listeners often report problems following conversations where normal-hearing listeners show little difficulty (Peters et al., 1998; Hopkins et al., 2008).
hearing-39
impaired listeners, some studies have included conditions that are meant to simulate hearing loss through manipulation of overall stimulus level (Zurek and Delhorne, 1987), inclusion of a threshold-elevating background masking noise (Moore et al., 1995), or other
signal-processing strategies (e.g., amplutide expansion; Lum and Braida, 2000).
The results of studies that have made efforts to account for differences in audibility between normal-hearing and hearing-impaired listeners have not always been in agreement. For consonant identification in high-pass noise, normal-hearing listeners and normal-hearing listeners with simulated hearing loss were still found to have significantly more MR than hearing-impaired listeners (Eisenberg et al., 1995). In contrast, Bacon et al. (1998) found through hearing-loss simulations via noise masking, that reduced audibility could account for the relatively small MR in some of their hearing-impaired listeners. Moreover, George et al. (2006) found that hearing-impaired listeners mostly performed similar to normal-hearing listeners with artificially elevated thresholds, and both groups performed worse than normal-hearing listeners. However, small MR was shown to persist in normal-hearing-impaired listeners when noise was high-pass filtered, but this was not the case for the normal-hearing listeners with simulated hearing loss. The results of these studies suggest that audibility can only partly account for the reduced MR benefit in hearing-impaired listeners.
Although reduced temporal resolution has been proposed to limit MR in hearing-impaired listeners (Dubno et al., 2003; George et al., 2006), some investigators have suggested that reduced frequency resolution may play a stronger role (Rosen and Fourcin, 1986; Baer and Moore, 1993; ter Keurs et al., 1993; Baer and Moore, 1994; Peters et al., 1998). Baer and Moore described three significant differences between a
40
poorer resolution of harmonics in complex tones and speech; 2) poorer detection and discrimination of spectral features in speech (i.e., formants), due to a smeared spectral envelope at the output of the auditory filter (Leek et al., 1987); and 3) a lower ratio of vowel representation to noise when a wideband noise is centered at the vowel formant energy.
Because the frequency regions associated with high SNRs vary dynamically in time for spectro-temporally complex maskers, glimpsing requires the integration of speech cues across both frequency and time. Our research indicates that spread of masking limits a normal-hearing listener’s ability to fully benefit from glimpses in spectro-temporally complex maskers, and that removing the impact of spread of masking via dichotic
presentation results in improved performance (see Experiment 1 and Ozmeral et al., 2012). Hearing-impairment is characterized by reduced sensitivity to sound and broader auditory filters, and therefore greater susceptibility to spread of masking. As a result, techniques to limit spread of masking in the asynchronous glimpsing task were effective in improving MR in hearing-impaired patients, but overall MR was reduced in Experiment 1 relative to normal-hearing listeners.
Experiment 1 tested normal-hearing and hearing-impaired listeners at the same presentation level, but it was not clear whether the reduced MR in the hearing-impaired group was due to reduced audibility, reduced frequency resolution, or a combination of these factors. The current experiment tested the hypothesis that, for hearing-impaired listeners, small MR in the asynchronous glimpsing task was due to some combination of the reduced audibility and reduced frequency resolution. To assess the effects of reduced audibility alone, normal-hearing listeners were given the asynchronous glimpsing task at a reduced