Practice of Epidemiology
Comparison of Self-Reported Sleep Duration With Actigraphy: Results From the
Hispanic Community Health Study/Study of Latinos Sueño Ancillary Study
Elizabeth M. Cespedes*, Frank B. Hu, Susan Redline, Bernard Rosner, Carmela Alcantara, Jianwen Cai, Martica H. Hall, Jose S. Loredo, Yasmin Mossavar-Rahmani, Alberto R. Ramos, Kathryn J. Reid, Neomi A. Shah, Daniela Sotres-Alvarez, Phyllis C. Zee, Rui Wang, and Sanjay R. Patel
*Correspondence to Dr. Elizabeth M. Cespedes, Departments of Nutrition and Epidemiology, Harvard T.H. Chan School of Public Health, 665 Huntington Avenue, 3rd Floor, Boston, MA 02115 (e-mail: [email protected]).
Initially submitted April 27, 2015; accepted for publication September 8, 2015.
Most studies of sleep and health outcomes rely on self-reported sleep duration, although correlation with objec-tive measures is poor. In this study, we defined sociodemographic and sleep characteristics associated with mis-reporting and assessed whether accounting for these factors better explains variation in objective sleep duration among 2,086 participants in the Hispanic Community Health Study/Study of Latinos who completed more than 5 nights of wrist actigraphy and reported habitual bed/wake times from 2010 to 2013. Using linear regression, we ex-amined self-report as a predictor of actigraphy-assessed sleep duration. Mean amount of time spent asleep was 7.85 (standard deviation, 1.12) hours by self-report and 6.74 (standard deviation, 1.02) hours by actigraphy; corre-lation between them was 0.43. For each additional hour of self-reported sleep, actigraphy time spent asleep increased by 20 minutes (95% confidence interval: 19, 22). Correlations between self-reported and actigraphy-assessed time spent asleep were lower with male sex, younger age, sleep efficiency <85%, and night-to-night variability in sleep duration≥1.5 hours. Adding sociodemographic and sleep factors to self-reports increased the proportion of variance explained in actigraphy-assessed sleep slightly (18%–32%). In this large validation study including Hispanics/Latinos, we demonstrated a moderate correlation between self-reported and actigraphy-assessed time spent asleep. The performance of self-reports varied by demographic and sleep measures but not by Hispanic subgroup.
actigraphy; Hispanic Americans; Latinos; measurement error; sleep; sleep duration; validation studies
Abbreviations: AHI, apnea-hypopnea index; BMI, body mass index; CARDIA, Coronary Artery Risk Development in Young Adults; CI, confidence interval; HCHS/SOL, Hispanic Community Health Study/Study of Latinos; ISI, Insomnia Severity Index; SD, standard deviation.
Accumulating evidence links extremes of sleep duration with chronic diseases, including hypertension, obesity, dia-betes, and cancer (1–3). Simultaneously, racial/ethnic dispar-ities in sleep duration are gaining attention (4–6). Though a majority of studies use questionnaires to assess sleep dura-tion, little research examines the validity of self-reporting against objective measurements such as wrist actigraphy, the objective method of choice for measuring sleep over multiple days. Even fewer studies have included ethnically diverse participants (though those that have done so have detected
racial/ethnic differences in the accuracy of self-reports) (7) or have had sufficient sample sizes to explore sources of sys-tematic bias (7–9). Yet, examining the correlation of self-reported sleep duration with objective measurements in varied populations may be essential to the interpretation of epidemi-ologic studies. First, prior research shows moderate correla-tions (Pearson’sρ= 0.31–0.47) between self-reported sleep duration and actigraphy-measured sleep duration and suggests the presence of both random error and systematic bias in self-reported sleep duration (7–9). Second,findings for subjective
and objective measures of sleep duration do not always agree. For example, the Coronary Artery Risk Development in Young Adults (CARDIA) Study detected sex differences in the association of sleep duration with body mass index (BMI) using self-reported sleep duration (10) but not actigraphy-measured sleep duration (11).
To our knowledge, no prior study has examined the valid-ity of self-reported sleep duration among diverse Hispanics/
Latinos, the largest racial/ethnic minority group in the United States and a population heavily burdened by obesity, diabe-tes, and other diseases linked to sleep duration. With 2,086 participants, the current study is the largest study in any pop-ulation (to our knowledge) to validate self-reported sleep du-ration against wrist actigraphy. This large sample enabled us to examine how well self-reports and actigraphy correlated within subgroups defined by sleep and sociodemographic
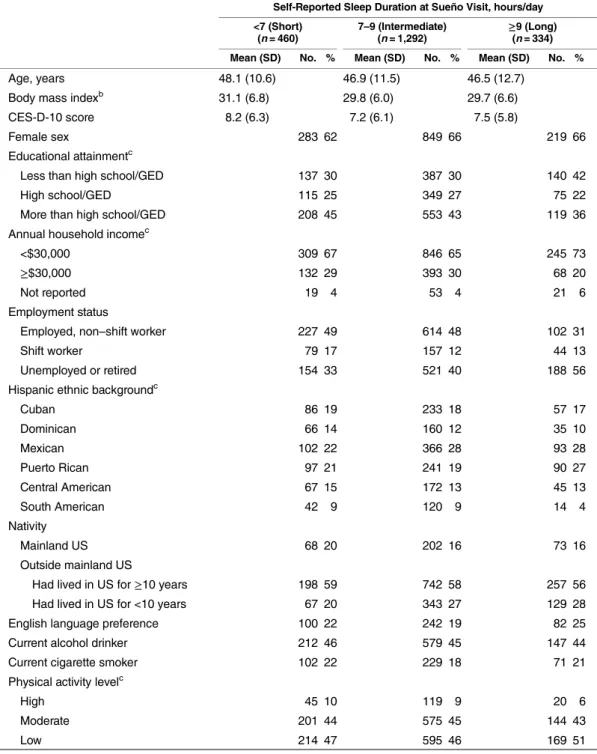
Table 1. Characteristicsaof the Study Sample by Self-Reported Daily Sleep Duration, HCHS/SOL Sueño (n= 2,086), 2010–2013
Self-Reported Sleep Duration at Sueño Visit, hours/day
<7 (Short) (n= 460)
7–9 (Intermediate)
(n= 1,292) ≥ 9 (Long) (n= 334)
Mean (SD) No. % Mean (SD) No. % Mean (SD) No. %
Age, years 48.1 (10.6) 46.9 (11.5) 46.5 (12.7)
Body mass indexb 31.1 (6.8) 29.8 (6.0) 29.7 (6.6)
CES-D-10 score 8.2 (6.3) 7.2 (6.1) 7.5 (5.8)
Female sex 283 62 849 66 219 66
Educational attainmentc
Less than high school/GED 137 30 387 30 140 42
High school/GED 115 25 349 27 75 22
More than high school/GED 208 45 553 43 119 36
Annual household incomec
<$30,000 309 67 846 65 245 73
≥$30,000 132 29 393 30 68 20
Not reported 19 4 53 4 21 6
Employment status
Employed, non–shift worker 227 49 614 48 102 31
Shift worker 79 17 157 12 44 13
Unemployed or retired 154 33 521 40 188 56
Hispanic ethnic backgroundc
Cuban 86 19 233 18 57 17
Dominican 66 14 160 12 35 10
Mexican 102 22 366 28 93 28
Puerto Rican 97 21 241 19 90 27
Central American 67 15 172 13 45 13
South American 42 9 120 9 14 4
Nativity
Mainland US 68 20 202 16 73 16
Outside mainland US
Had lived in US for≥10 years 198 59 742 58 257 56
Had lived in US for <10 years 67 20 343 27 129 28
English language preference 100 22 242 19 82 25
Current alcohol drinker 212 46 579 45 147 44
Current cigarette smoker 102 22 229 18 71 21
Physical activity levelc
High 45 10 119 9 20 6
Moderate 201 44 575 45 144 43
Low 214 47 595 46 169 51
characteristics, including Hispanic/Latino background, and which characteristics contributed to the difference between self-reported and objective sleep measures. This research con-tributes to the interpretation of associations with self-reported sleep duration in epidemiologic studies in general, and it may have particular relevance to Hispanic/Latino health disparities. Differences in self-reported sleep habits between Hispanic sub-groups have been identified (12), and associations of self-reported sleep with chronic diseases may vary by Hispanic/Latino sub-group (6,13–16). Understanding whether the validity of
self-reported sleep duration varies by Hispanic/Latino background or other characteristics is critical to interpreting these results.
METHODS
Study population
The Hispanic Community Health Study/Study of Latinos (HCHS/SOL) enrolled 16,415 self-identified Hispanics/Latinos aged 18–74 years (March 2008–June 2011). Participants were
Table 1. Continued
Self-Reported Sleep Duration at Sueño Visit, hours/day
<7 (Short) (n= 460)
7–9 (Intermediate)
(n= 1,292) ≥ 9 (Long) (n= 334)
Mean (SD) No. % Mean (SD) No. % Mean (SD) No. %
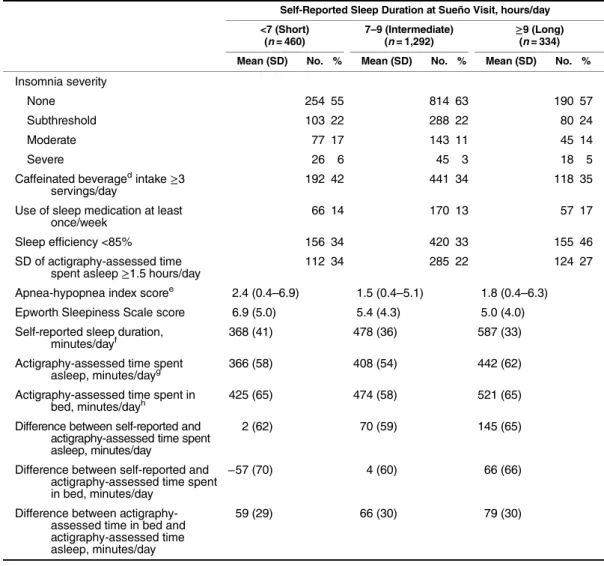
Insomnia severity
None 254 55 814 63 190 57
Subthreshold 103 22 288 22 80 24
Moderate 77 17 143 11 45 14
Severe 26 6 45 3 18 5
Caffeinated beveragedintake ≥3 servings/day
192 42 441 34 118 35
Use of sleep medication at least once/week
66 14 170 13 57 17
Sleep efficiency <85% 156 34 420 33 155 46
SD of actigraphy-assessed time spent asleep≥1.5 hours/day
112 34 285 22 124 27
Apnea-hypopnea index scoree 2.4 (0.4
–6.9) 1.5 (0.4–5.1) 1.8 (0.4–6.3)
Epworth Sleepiness Scale score 6.9 (5.0) 5.4 (4.3) 5.0 (4.0)
Self-reported sleep duration,
minutes/dayf 368 (41) 478 (36) 587 (33)
Actigraphy-assessed time spent asleep, minutes/dayg
366 (58) 408 (54) 442 (62)
Actigraphy-assessed time spent in
bed, minutes/dayh 425 (65) 474 (58) 521 (65)
Difference between self-reported and actigraphy-assessed time spent asleep, minutes/day
2 (62) 70 (59) 145 (65)
Difference between self-reported and actigraphy-assessed time spent in bed, minutes/day
−57 (70) 4 (60) 66 (66)
Difference between actigraphy-assessed time in bed and actigraphy-assessed time asleep, minutes/day
59 (29) 66 (30) 79 (30)
Abbreviations: CES-D-10, 10-item Center for Epidemiologic Studies Depression Scale; GED, General Educational Development; HCHS/SOL, Hispanic Community Health Study/Study of Latinos; SD, standard deviation; US, United States.
aAll characteristics were measured at the Sueño visit of the HCHS/SOL unless otherwise indicated. bWeight (kg)/height (m)2.
c Measured at the HCHS/SOL baseline visit.
dCaffeinated beverages included coffee, tea, soda, and energy drinks. eValues are presented as median (interquartile range).
f Sleep duration was the weighted average of weekend and weekday self-reported habitual bed time minus wake time measured at the Sueño visit.
gActigraph-measured time spent asleep was the weighted average amount of time spent asleep during the main rest period, excluding periods of wakefulness, over weekends and weekdays.
recruited from randomly selected households in 4 US commu-nities (the Bronx, a borough of New York, New York; Chicago, Illinois; Miami, Florida; and San Diego, California). The study was approved by review boards at each participating institution, and written informed consent was obtained from participants. Details of the study design and procedures have been published elsewhere (17,18).
HCHS/SOL Sueño, an ancillary sleep study, enrolled 2,252 HCHS/SOL participants (October 2010–December 2013) aged <65 years without severe sleep disorders (narcolepsy, apnea-hypopnea index (AHI)≥50 events/hour, or use of pos-itive airway pressure). The present analysis included 2,086 eligible individuals with actigraphy and self-reported sleep measurements.
Self-reported sleep duration
Self-reported sleep duration was assessed at the Sueño visit of HCHS/SOL through participant report of habitual bed/ wake times on weekends/weekdays, from which we calculated a weighted average of sleep duration (2/7 × weekends + 5/7 × weekdays), as done in other sleep studies (19). Self-reported sleep duration was examined both continuously and categorized into tertiles and a priori groupings (<7, 7– <9, or≥9 hours/day) based on published literature.
Actigraphy measurements
At the Sueño visit, participants were instructed to wear an Actiwatch Spectrum actigraph (Philips Respironics, Murrys-ville, Pennsylvania) on the nondominant wrist for 7 days and to complete sleep diaries upon awakening each day. Sleep/ wake status was determine in 30-second epochs based on a standardized method (20) using the Actiware 5.59 algorithm, which has been validated against polysomnography on an epoch-by-epoch basis (21,22).
The mean number of valid nights of actigraphy was 7 (standard deviation (SD), 1; range, 5–17 days). We calculated a weighted average (2/7 × weekends + 5/7 × weekdays) of amount of time spent in bed (time between getting into and out of bed) and amount of time spent asleep (time within the in-bed interval scored as sleep). Time spent asleep was treated continuously, in tertiles, and in a priori groupings: <7 hours, 7–<9 hours, and≥9 hours. In secondary analyses, time spent in bed was considered as the actigraphic variable of interest. Sleep efficiency was computed on each night as the pro-portion of time spent asleep between thefirst and last epochs of sleep and then averaged across all nights, dichotomized at 85% (<85%/≥85%). Variability in nightly sleep was defined as the standard deviation of time spent asleep across all re-corded days. Participants in the top quartile (SD >1.5 hours) were considered to have“high”variability in time asleep.
Covariate assessment
As part of the HCHS/SOL baseline examination, partici-pants underwent home sleep apnea monitoring using the ARES Unicorder 5.2 (B-Alert; Advanced Brain Monitoring, Inc., Carlsbad, California) for computation of the AHI, as has been previously described (16). Severity of sleep apnea
was classified as none (AHI <5 events/hour), mild (AHI 5–15 events/hour), or moderate (AHI 15–50 events/hour). The HCHS/SOL baseline examination included interviewer-administered questionnaires in the participant’s preferred lan-guage (Spanish or English) and other measurements described previously (17,18). Information was obtained on demographic factors (Hispanic ethnic background (Cuban, Dominican, Mexican, Puerto Rican, Central American, or South Ameri-can), nativity (mainland United States or elsewhere), education (less than high school, high school diploma, or more than high school), annual household income (<$30,000,≥$30,000, or not reported), cigarette and alcohol use (current or noncurrent), and physical activity (Global Physical Activity Questionnaire: self-reported days/week of recreational, transportation, or work activity; corresponding metabolic equivalent units were cate-gorized as high, moderate, or low (23)).
As part of the Sueño visit, interviewers administered ques-tionnaires about sociodemographic factors, health, and sleep behaviors. Sleep-related symptoms were assessed using the Sleep Heart Health Study Sleep Habits Questionnaire (24), the Epworth Sleepiness Scale (25), and the Insomnia Severi-ty Index (ISI) (26). Daytime sleepiness score on the Epworth Sleepiness Scale was dichotomized as <10 versus≥10, and insomnia was divided into 4 categories: none (ISI score 0– 7), subthreshold (ISI score 8–14), moderate (ISI score 15– 21), and severe (ISI score 22–28). Depressive symptoms were evaluated using the 10-item Center for Epidemiological Stud-ies Depression Scale, with scores dichotomized as <10 versus ≥10 (27,28). Use of sleep medication was categorized as less than once/week versus once/week or more. Participants were asked about employment and work schedules. Nighttime, ir-regular, on-call, or rotating shifts that included late nights or early mornings were considered shift work. Intake of caffein-ated beverages (including coffee, tea, soda, and energy drinks) was categorized as <3 cups/day versus≥3 cups/day. Age was categorized into 18–44 years and 45–64 years. BMI was calcu-lated as measured weight (in kilograms) divided by measured height (in meters) squared and was categorized into underweight (<18.5)/normal weight (18.5–<25), overweight (25–<30), and obese (class I: 30–<35; class II: 35–<40; or class III: 40).
Statistical analysis
actigraphy outcomes predicted by self-reported sleep dura-tion and participant characteristics: age, sex, BMI, insomnia, sleep apnea, sleepiness, efficiency, variability, sleep medica-tion use, employment, educamedica-tion, Hispanic ethnicity, nativity, language, depression, caffeine intake, smoking, alcohol drink-ing, and physical activity. We also considered interaction terms for the interaction of each characteristic with self-reported sleep duration. To identify predictors of actigraphy measurements using self-reports and participant characteristics, we used step-wise regression with 10-fold cross-validation. Candidate var-iables introduced into this procedure included the above characteristics and their interactions with self-reported sleep duration. Interaction terms were entered into the model only with the corresponding main association.
Self-reported sleep duration is often treated categorically be-cause of a U-shaped relationship with many disease outcomes (1). Thus, we assessed the accuracy of ranking by calculatingκ scores and confidence intervals based on tertiles of self-reported and actigraphy-measured sleep duration. We also report the area under the receiver operating characteristic curve for logistic models using tertiles of self-reported sleep duration to predict measured actigraphy-assessed short sleep duration (excluding
“long sleep,”i.e., persons in the top tertile of sleep time) and actigraphy-assessed long sleep duration (excluding“short sleep,” i.e., persons in the bottom tertile of sleep time).
In sensitivity analyses, we excluded participants in the top quartile of variability to assess the influence of variation in night-to-night sleep duration on the correlation between self-reported and actigraphy-assessed sleep duration. Further, we
repeated all analyses using weekday data only. We also com-pared thefits of models with and without nonlinear relation-ships, adding quadratic and cubic terms for self-reported sleep to models, and testing linear and cubic splines. A 2-sidedP value less than 0.05 was used to indicate statistical significance.
RESULTS
Table1shows characteristics of the Sueño sample by cat-egory of self-reported sleep duration. Overall, Sueño sample characteristics were similar to those of the HCHS/SOL parent cohort with respect to key demographic/health variables such as BMI, education, income, and employment (see Web Table 1, available athttp://aje.oxfordjournals.org/). Mean age was 47.1 (SD, 11.5) years, and mean time between the HCHS/SOL base-line and Sueño examinations was 24 (SD, 5) months (range, 4– 30 months). Mean self-reported sleep duration was 7.86 (SD, 1.28) hours; actigraphy-assessed time spent asleep was more than 1 hour shorter (6.74 (SD, 1.02) hours). Participants report-ing short sleep were slightly older, had slightly higher scores for depression, sleepiness, insomnia, sleep apnea, and adiposity, and were more likely to consume 3 or more caffeinated bever-ages per day. Those reporting long sleep were younger and more likely to have incomes under $30,000 per year, to be un-employed, and to engage in no or low physical activity.
Table2shows descriptive statistics for self-reported sleep duration, actigraphy-assessed time spent asleep, and their dif-ference, correlation, and bivariate associations. Overall, the correlation of self-reported sleep duration with time spent
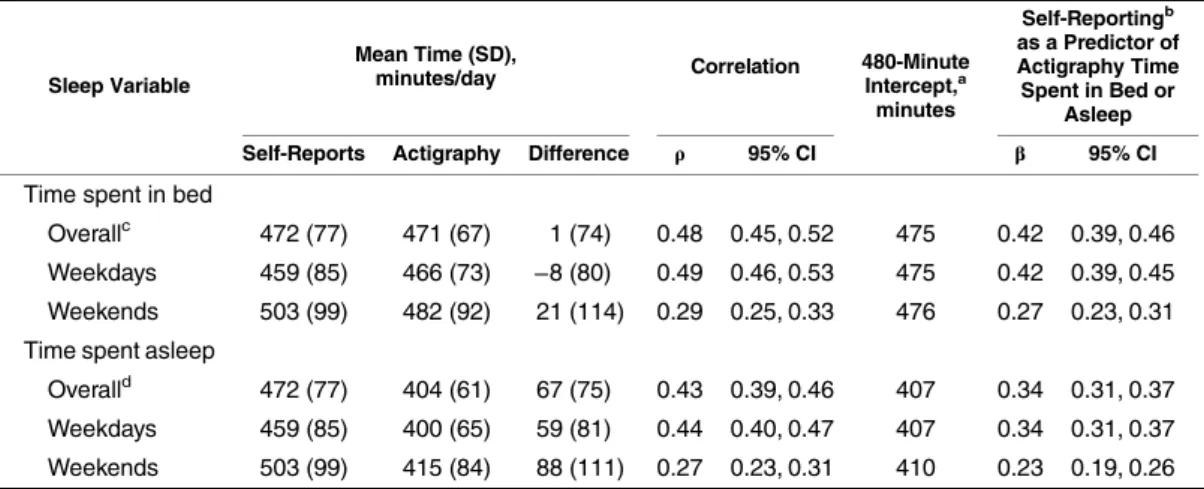
Table 2. Prediction of Sleep-Related Actigraphy Measurements by Self-Reports, HCHS/SOL Sueño (n= 2,086), 2010–2013
Sleep Variable
Mean Time (SD),
minutes/day Correlation 480-MinuteIntercept,a minutes
Self-Reportingb as a Predictor of Actigraphy Time Spent in Bed or
Asleep
Self-Reports Actigraphy Difference ρ 95% CI β 95% CI
Time spent in bed
Overallc 472 (77) 471 (67) 1 (74) 0.48 0.45, 0.52 475 0.42 0.39, 0.46
Weekdays 459 (85) 466 (73) −8 (80) 0.49 0.46, 0.53 475 0.42 0.39, 0.45 Weekends 503 (99) 482 (92) 21 (114) 0.29 0.25, 0.33 476 0.27 0.23, 0.31 Time spent asleep
Overalld 472 (77) 404 (61) 67 (75) 0.43 0.39, 0.46 407 0.34 0.31, 0.37
Weekdays 459 (85) 400 (65) 59 (81) 0.44 0.40, 0.47 407 0.34 0.31, 0.37
Weekends 503 (99) 415 (84) 88 (111) 0.27 0.23, 0.31 410 0.23 0.19, 0.26
Abbreviations: CI, confidence interval; HCHS/SOL, Hispanic Community Health Study/Study of Latinos; SD, standard deviation.
aThe regression intercept represents bias, the disparity between subjects
’reported sleep duration and their actigraphy-measured values. If subjective and objective reports of sleep matched perfectly, there would be no bias and the intercept would be 0 minutes. We report the intercept at the average of 480 minutes (or 8 hours) of self-reported sleep.
bOverall self-reported sleep duration was the weighted average of weekend and weekday self-reported habitual time in bed minus wake time measured at the Sueño visit of the HCHS/SOL.
c Overall actigraph-measured time spent in bed was the weighted average duration of the main rest period, including periods of wakefulness, over weekends and weekdays.
asleep was 0.43 (95% confidence interval (CI): 0.39, 0.46), with higher correlations for weekdays (Pearson’sρ= 0.44) versus weekends (Pearson’sρ= 0.27).
Before multivariable adjustment, actigraphy-assessed time spent asleep increased by 20 minutes (95% CI: 19, 22) for each additional hour of self-reported sleep duration. When
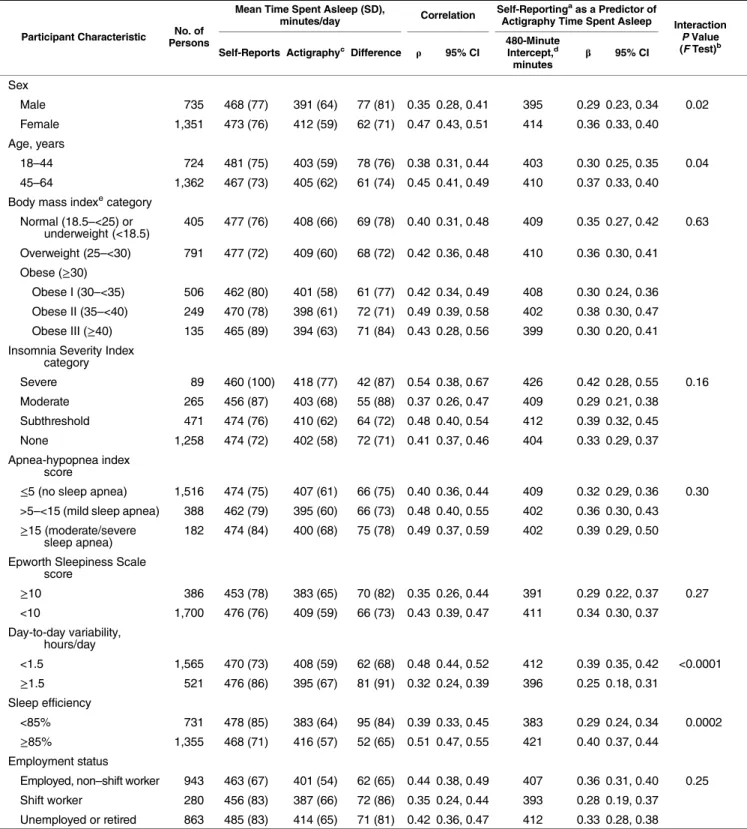
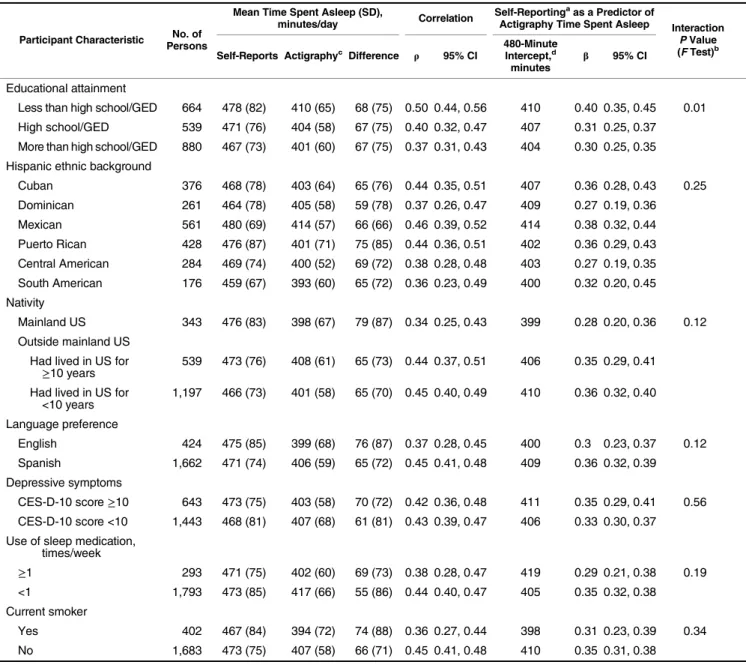
Table 3. Actigraphy-Assessed Amount of Time Spent Asleep Each Day as Predicted by Self-Reported Sleep Duration, According to Participant Characteristics, HCHS/SOL Sueño (n= 2,086), 2010–2013
Participant Characteristic No. of Persons
Mean Time Spent Asleep (SD),
minutes/day Correlation
Self-Reportingaas a Predictor of
Actigraphy Time Spent Asleep Interaction
PValue (FTest)b Self-Reports Actigraphyc Difference ρ 95% CI 480-MinuteIntercept,d
minutes β
95% CI
Sex
Male 735 468 (77) 391 (64) 77 (81) 0.35 0.28, 0.41 395 0.29 0.23, 0.34 0.02
Female 1,351 473 (76) 412 (59) 62 (71) 0.47 0.43, 0.51 414 0.36 0.33, 0.40
Age, years
18–44 724 481 (75) 403 (59) 78 (76) 0.38 0.31, 0.44 403 0.30 0.25, 0.35 0.04
45–64 1,362 467 (73) 405 (62) 61 (74) 0.45 0.41, 0.49 410 0.37 0.33, 0.40
Body mass indexecategory Normal (18.5–<25) or
underweight (<18.5)
405 477 (76) 408 (66) 69 (78) 0.40 0.31, 0.48 409 0.35 0.27, 0.42 0.63
Overweight (25–<30) 791 477 (72) 409 (60) 68 (72) 0.42 0.36, 0.48 410 0.36 0.30, 0.41 Obese (≥30)
Obese I (30–<35) 506 462 (80) 401 (58) 61 (77) 0.42 0.34, 0.49 408 0.30 0.24, 0.36 Obese II (35–<40) 249 470 (78) 398 (61) 72 (71) 0.49 0.39, 0.58 402 0.38 0.30, 0.47 Obese III (≥40) 135 465 (89) 394 (63) 71 (84) 0.43 0.28, 0.56 399 0.30 0.20, 0.41 Insomnia Severity Index
category
Severe 89 460 (100) 418 (77) 42 (87) 0.54 0.38, 0.67 426 0.42 0.28, 0.55 0.16
Moderate 265 456 (87) 403 (68) 55 (88) 0.37 0.26, 0.47 409 0.29 0.21, 0.38
Subthreshold 471 474 (76) 410 (62) 64 (72) 0.48 0.40, 0.54 412 0.39 0.32, 0.45
None 1,258 474 (72) 402 (58) 72 (71) 0.41 0.37, 0.46 404 0.33 0.29, 0.37
Apnea-hypopnea index score
≤5 (no sleep apnea) 1,516 474 (75) 407 (61) 66 (75) 0.40 0.36, 0.44 409 0.32 0.29, 0.36 0.30 >5–<15 (mild sleep apnea) 388 462 (79) 395 (60) 66 (73) 0.48 0.40, 0.55 402 0.36 0.30, 0.43 ≥15 (moderate/severe
sleep apnea)
182 474 (84) 400 (68) 75 (78) 0.49 0.37, 0.59 402 0.39 0.29, 0.50
Epworth Sleepiness Scale score
≥10 386 453 (78) 383 (65) 70 (82) 0.35 0.26, 0.44 391 0.29 0.22, 0.37 0.27
<10 1,700 476 (76) 409 (59) 66 (73) 0.43 0.39, 0.47 411 0.34 0.30, 0.37
Day-to-day variability, hours/day
<1.5 1,565 470 (73) 408 (59) 62 (68) 0.48 0.44, 0.52 412 0.39 0.35, 0.42 <0.0001
≥1.5 521 476 (86) 395 (67) 81 (91) 0.32 0.24, 0.39 396 0.25 0.18, 0.31
Sleep efficiency
<85% 731 478 (85) 383 (64) 95 (84) 0.39 0.33, 0.45 383 0.29 0.24, 0.34 0.0002
≥85% 1,355 468 (71) 416 (57) 52 (65) 0.51 0.47, 0.55 421 0.40 0.37, 0.44
Employment status
Employed, non–shift worker 943 463 (67) 401 (54) 62 (65) 0.44 0.38, 0.49 407 0.36 0.31, 0.40 0.25
Shift worker 280 456 (83) 387 (66) 72 (86) 0.35 0.24, 0.44 393 0.28 0.19, 0.37
Unemployed or retired 863 485 (83) 414 (65) 71 (81) 0.42 0.36, 0.47 412 0.33 0.28, 0.38
results were stratified by sociodemographic, sleep, and health characteristics (Table3), the association of self-reported sleep duration with measured time asleep differed significantly by sex (P= 0.02), age (P= 0.04), sleep efficiency (P= 0.0003), nightly sleep variability (P< 0.0001), and education (P=
0.01), with weaker associations among males, younger par-ticipants, those with sleep efficiency <85%, and those with nightly variability≥1.5 hours or greater education. We found no evidence that the association varied by Hispanic/Latino background (Pfor interaction > 0.05).
Table 3. Continued
Participant Characteristic No. of Persons
Mean Time Spent Asleep (SD),
minutes/day Correlation
Self-Reportingaas a Predictor of
Actigraphy Time Spent Asleep Interaction
PValue (FTest)b Self-Reports Actigraphyc Difference ρ 95% CI 480-MinuteIntercept,d
minutes β
95% CI
Educational attainment
Less than high school/GED 664 478 (82) 410 (65) 68 (75) 0.50 0.44, 0.56 410 0.40 0.35, 0.45 0.01 High school/GED 539 471 (76) 404 (58) 67 (75) 0.40 0.32, 0.47 407 0.31 0.25, 0.37 More than high school/GED 880 467 (73) 401 (60) 67 (75) 0.37 0.31, 0.43 404 0.30 0.25, 0.35 Hispanic ethnic background
Cuban 376 468 (78) 403 (64) 65 (76) 0.44 0.35, 0.51 407 0.36 0.28, 0.43 0.25
Dominican 261 464 (78) 405 (58) 59 (78) 0.37 0.26, 0.47 409 0.27 0.19, 0.36
Mexican 561 480 (69) 414 (57) 66 (66) 0.46 0.39, 0.52 414 0.38 0.32, 0.44
Puerto Rican 428 476 (87) 401 (71) 75 (85) 0.44 0.36, 0.51 402 0.36 0.29, 0.43
Central American 284 469 (74) 400 (52) 69 (72) 0.38 0.28, 0.48 403 0.27 0.19, 0.35 South American 176 459 (67) 393 (60) 65 (72) 0.36 0.23, 0.49 400 0.32 0.20, 0.45 Nativity
Mainland US 343 476 (83) 398 (67) 79 (87) 0.34 0.25, 0.43 399 0.28 0.20, 0.36 0.12
Outside mainland US Had lived in US for
≥10 years
539 473 (76) 408 (61) 65 (73) 0.44 0.37, 0.51 406 0.35 0.29, 0.41
Had lived in US for <10 years
1,197 466 (73) 401 (58) 65 (70) 0.45 0.40, 0.49 410 0.36 0.32, 0.40
Language preference
English 424 475 (85) 399 (68) 76 (87) 0.37 0.28, 0.45 400 0.3 0.23, 0.37 0.12
Spanish 1,662 471 (74) 406 (59) 65 (72) 0.45 0.41, 0.48 409 0.36 0.32, 0.39
Depressive symptoms
CES-D-10 score≥10 643 473 (75) 403 (58) 70 (72) 0.42 0.36, 0.48 411 0.35 0.29, 0.41 0.56 CES-D-10 score <10 1,443 468 (81) 407 (68) 61 (81) 0.43 0.39, 0.47 406 0.33 0.30, 0.37 Use of sleep medication,
times/week
≥1 293 471 (75) 402 (60) 69 (73) 0.38 0.28, 0.47 419 0.29 0.21, 0.38 0.19
<1 1,793 473 (85) 417 (66) 55 (86) 0.44 0.40, 0.47 405 0.35 0.32, 0.38
Current smoker
Yes 402 467 (84) 394 (72) 74 (88) 0.36 0.27, 0.44 398 0.31 0.23, 0.39 0.34
No 1,683 473 (75) 407 (58) 66 (71) 0.45 0.41, 0.48 410 0.35 0.31, 0.38
Abbreviations: CES-D-10, 10-item Center for Epidemiologic Studies Depression Scale; CI, confidence interval; GED, General Educational Development; HCHS/SOL, Hispanic Community Health Study/Study of Latinos; SD, standard deviation; US, United States.
aActigraph-measured time spent asleep was the weighted average over weekends and weekdays of the time spent asleep during the main rest period, excluding periods of wakefulness.
bInteraction
Pvalue for the product of the participant characteristic and self-reported habitual sleep duration.
c Self-reported sleep duration was the weighted average of weekend and weekday self-reported habitual amount of time spent in bed minus wake time measured at the Sueño visit of the HCHS/SOL.
dThe regression intercept represents bias, the disparity between subjects
’reported sleep duration and their actigraphy-measured values. If subjective and objective reports of sleep matched perfectly, there would be no bias and the intercept would be 0 minutes. We report the intercept at the average of 480 minutes (or 8 hours) of self-reported sleep.
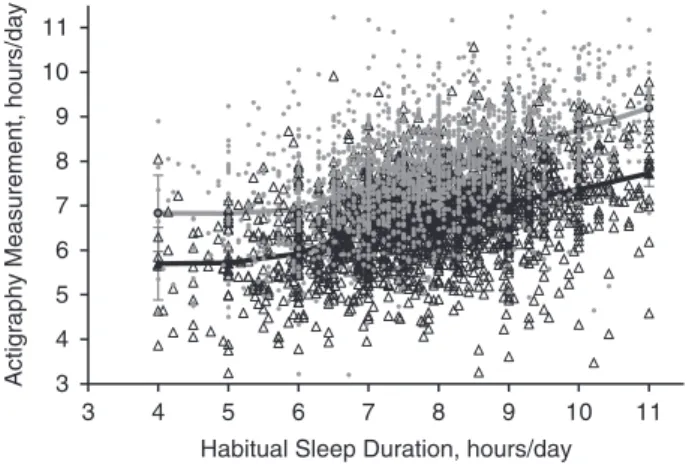
Self-report measurements did not uniformly overestimate actigraphy-assessed time spent asleep; self-reports underesti-mated actigraphy-assessed time asleep for 17% of participants. On average, self-reports of≤6 hours were underestimates of actigraphy-assessed time spent asleep, while self-reports of >6 hours were overestimates (Figure1). However, sensitivity analyses provided no evidence of nonlinear associations of self-reported sleep duration with actigraphy measurements (likelihood ratio test:P> 0.05).
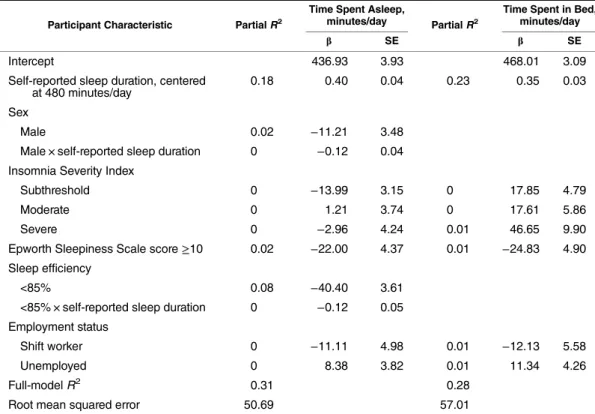
As shown in Web Table 2, we then tested multivariable-adjusted regression models for actigraphy-assessed time asleep and time in bed. Self-reported sleep duration made the largest contribution to the overall modelR2( partialR2= 0.18), with minimal additional variance being explained by sociodemographic, health, or sleep characteristics (R2rising to 0.32). Bias (the intercept) at a self-reported sleep duration of 8 hours was almost 1 hour. Holding self-reported sleep du-ration and other characteristics constant, males, participants with daytime sleepiness, persons with sleep efficiency <85%, persons with BMI≥35, shift workers, and current smokers and drinkers spent 6–36 fewer minutes asleep per day. Persons who had insomnia, used sleep medication at least once per week, or were unemployed spent 7–22 more minutes asleep per day.
Table4shows results of a stepwise selection procedure using internal cross-validation to identify predictors of actig-raphy-assessed time spent asleep given self-reported habitual sleep duration. From the list of candidate variables shown in Table3and Web Table 2, sex, daytime sleepiness, sleep ef-ficiency, insomnia severity, and employment were selected as predictors of time asleep. The interaction of sex and sleep
efficiency with self-reported sleep duration were also entered into the model. Results indicated that little information was added to the models by sociodemographic, health, and sleep character-istics, precluding the development of calibration models.
Table5showsκscores indicating the level of agreement among subjects ranked in the low, medium, or high tertile of actigraphy-assessed time asleep given the participant’s ter-tile of self-reported sleep duration, overall and by subgroup. Agreement between actigraphy and self-reported sleep dura-tion was poor (κvalues ranged from 0.17 to 0.33).
Web Figure 1 shows the receiver operating characteristic curves predicting tertile of actigraphy-assessed sleep duration from tertile of self-reported sleep duration, with and without adjustment for covariates. The probability that a randomly se-lected individual would be correctly classified as having an actigraphy-assessed sleep time in the lowest tertile (short sleep) based on tertile of self-reported sleep duration was 0.62. The corresponding probability for actigraphy-assessed sleep time in the highest tertile (long sleep) was 0.64. Both proba-bilities increased slightly, to 0.68, with addition of the covar-iates shown in Table3.
In Sueño, sleep duration was reported as bed time minus wake time. However, not all time in bed is spent asleep; to as-sess the influence of this on our results, we repeated all anal-yses using actigraphy-measured time in bed in place of time asleep. As anticipated, mean actigraphy-assessed time in bed was longer than time asleep and was similar to self-reported sleep duration at 7.85 (SD, 1.12) hours/day (Table1). How-ever, the correlation with self-reported sleep duration was only slightly higher than that for time asleep, atr= 0.48 (95% CI: 0.45, 0.52), and for each additional hour of self-reported sleep duration, time in bed increased by 25 minutes (95% CI: 24, 27) (Table2). The addition of covariates to self-reported sleep duration improved the overall modelR2only slightly, from 0.23 to 0.30 (Web Table 2). In the stepwise selection procedure, at the same level of self-reported sleep duration, shift workers and participants with daytime sleepiness spent less time in bed, while those who had insomnia or were un-employed spent more time in bed (Table4).
DISCUSSION
Study findings
In this diverse cohort of US Hispanics/Latinos, we found moderate correlations between self-reported habitual sleep du-ration and actigraphy-assessed time spent asleep (r= 0.43). To our knowledge, this is the largest study of sleep duration in Hispanics/Latinos to date and the only study we know of to identify predictors of actigraphy measurements from self-reported sleep duration in Hispanics/Latinos. Other studies have also observed moderate correlations between reported and actigraphy-assessed sleep, ranging from 0.31 to 0.47, but with few exceptions (7,29), those studies have recruited older (8) and non-Hispanic white (9,30,31) populations.
One of the few studies examining racial/ethnic differences in the correlation between self-reported and actigraphy-measured sleep duration is CARDIA, which found higher correlations among white participants (r= 0.56, 95% CI: 0.44, 0.68) than among black participants (r= 0.29, 95% CI: 3
4 5 6 7 8 9 10 11
3 4 5 6 7 8 9 10 11
Habitual Sleep Duration, hours/day
Actigraphy Measurement,
hours/day
0.10, 0.48), suggesting the presence of important racial dif-ferences. In our study, the correlation between self-reports and actigraphy in a Hispanic/Latino population was intermediate to correlations reported for whites and blacks. Furthermore, the correlations did not differ significantly among Hispanic/ Latino subgroups. This is important in interpreting the re-ported differences in the relationship between self-rere-ported sleep duration and chronic disease outcomes. For example, in the National Health and Nutrition Examination Survey, the relationship between hypertension and self-reported short sleep duration was seen only amongnon-Mexican Hispanics/ Latinos (32), while in the Hispanic Health and Nutrition Ex-amination Survey, short sleep duration was associated with larger body size only among Mexican Americans (14).
In interpreting ourfindings, it is important to note that while some studies (e.g., CARDIA) based sleep self-assessments on a single question about the actual number of hours of sleep ob-tained on a typical night, habitual bed and wake times are com-monly used to measure sleep duration in epidemiologic studies because participants may more easily report these habits than their hours of actual sleep (33,34). However, not all time in bed is spent asleep. Consistent with this, the unadjusted differ-ence between measured time asleep and self-reported sleep
duration in our study exceeded 1 hour, while the difference be-tween objectively measured time in bed and self-reported sleep duration was only 1 minute (though with substantial variation). Yet, correlations of actigraphy-assessed time asleep and time in bed with self-reported sleep duration were close (Pearson’s ρ:ρ= 0.43 andρ= 0.48), indicating that the measurement ap-proach for self-reported sleep duration did not fully explain dis-crepancies between self-report and actigraphy assessments.
We observed higher correlations for weekdays than for weekends, perhaps due to consistent weekday routines en-abling more accurate reporting. However, fewer nights of ac-tigraphy recording were collected on weekends (median of 5 weekday nights of actigraphy vs. 2 weekend nights), which weakened the correlation with self-reported sleep duration.
Self-reported sleep duration made the largest contribution to the overall variance in actigraphy-assessed time spent asleep among all the variables we considered but only accounted for 18% of this variance; the modelR2rose to 32% with the ad-dition of sociodemographic, sleep, and health characteristics. Thus, the addition of covariates to self-reported habitual sleep duration did not result in a model that explained suffi -cient variation in actigraphy, making it challenging to de-velop calibration equations.
Table 4. Beta Coefficients andR2Values for Predictors of Actigraphy-Assessed Daily Amounts of Time Spent Asleep and in Bed, HCHS/SOL Sueño (n= 2,086), 2010–2013a,b,c
Participant Characteristic PartialR2
Time Spent Asleep,
minutes/day PartialR2
Time Spent in Bed, minutes/day
β SE β SE
Intercept 436.93 3.93 468.01 3.09
Self-reported sleep duration, centered at 480 minutes/day
0.18 0.40 0.04 0.23 0.35 0.03
Sex
Male 0.02 −11.21 3.48
Male × self-reported sleep duration 0 −0.12 0.04 Insomnia Severity Index
Subthreshold 0 −13.99 3.15 0 17.85 4.79
Moderate 0 1.21 3.74 0 17.61 5.86
Severe 0 −2.96 4.24 0.01 46.65 9.90
Epworth Sleepiness Scale score≥10 0.02 −22.00 4.37 0.01 −24.83 4.90
Sleep efficiency
<85% 0.08 −40.40 3.61
<85% × self-reported sleep duration 0 −0.12 0.05 Employment status
Shift worker 0 −11.11 4.98 0.01 −12.13 5.58
Unemployed 0 8.38 3.82 0.01 11.34 4.26
Full-modelR2 0.31 0.28
Root mean squared error 50.69 57.01
Abbreviations: HCHS/SOL, Hispanic Community Health Study/Study of Latinos; SE, standard error.
aEach column (time asleep and time in bed) represents a separate statistical model with adjustment for all of the variables in the column. Theβcoefficients were estimated through stepwise selection with the full list of candidate variables plus the interaction of each variable with self-reported sleep duration.
bReference categories for selected variables were: female sex; Epworth Sleepiness Scale score <10; no clinical insomnia; and employed non–shift worker.
c All terms were statistically significant at the
When investigators conducting prior research in nutrition at-tempted to improve the accuracy of self-report measures of diet (compared with an objective measure such as a biomarker), often the addition of participant characteristics to the model substantially increasedR2(35,36). For example, in the Wom-en’s Health Initiative, the addition of characteristics such as BMI and age increased the modelR2value for total energy in-take from 4% for the food frequency questionnaire alone to 42% (36). One possibility is that the skills needed to report diet (e.g., portion estimation) are more complex than those needed to report habitual bed/wake times, leading to a less dramatic
increase inR2with the addition of participant characteristics to the model for actigraphy-assessed time spent asleep. Difficulty in estimating habitual sleep duration may arise, in part, from night-to-night variability. In keeping with this hypothesis, the correlation between self-reported and actigraphy-assessed sleep duration was lower among persons in the highest quartile of night-to-night variability (Pearson’sρ= 0.32), while participants in the lowest variability quartile (<0.8 hours) had the highest correlation (ρ= 0.54). However, when high-variability partici-pants were excluded from sensitivity analyses, self-reporting was still only able to explain 31% of the variation in time spent
Table 5. Scores for Agreement Between Tertilesaof Actigraphy-Assessed Time Spent Asleep and Self-Reported Sleep Duration, According to Selected Participant Characteristics, HCHS/SOL Sueño (n= 2,086), 2010–2013b
Participant Characteristic
Total No. of Persons
Time Spent Asleep Time Spent in Bed
Observed Agreement
κ 95% CI
Observed Agreement
κ 95% CI No. of
Persons %
No. of Persons %
Overall 2,086 0.23 0.20, 0.27 0.27 0.24, 0.31
Sex
Male 735 129 54 0.19 0.14, 0.24 381 52 0.28 0.22, 0.33
Female 1,351 682 50 0.26 0.22, 0.30 694 51 0.27 0.23, 0.31
Age, years
18–44 724 337 47 0.2 0.15, 0.25 347 48 0.22 0.16, 0.27
45–64 1,362 685 50 0.25 0.21, 0.29 728 53 0.3 0.26, 0.34
Body mass indexc category
Obese (≥30) 890 454 51 0.26 0.21, 0.31 462 52 0.28 0.23, 0.33
Nonobese (<30) 1,196 568 47 0.21 0.17, 0.25 613 51 0.27 0.23, 0.31
Insomnia severity
Severe 89 49 55 0.33 0.18, 0.47 51 57 0.36 0.22, 0.51
Nonsevere 1,997 973 49 0.23 0.20, 0.26 1,024 51 0.27 0.24, 0.30
Day-to-day variability, hours
≥1.5 521 232 45 0.17 0.11, 0.23 234 45 0.18 0.11, 0.24
<1.5 1,565 790 50 0.26 0.22, 0.29 841 54 0.31 0.30, 0.34
Sleep efficiency
<85% 731 328 45 0.18 0.13, 0.23 368 50 0.25 0.20, 0.30
≥85% 1,355 694 51 0.27 0.23, 0.31 707 52 0.28 0.24, 0.32
Educational attainment Less than high school
diploma/GED
664 348 52 0.28 0.23, 0.34 355 53 0.3 0.24, 0.36
High school diploma/ GED or more
1,422 674 47 0.21 0.17, 0.25 720 51 0.26 0.22, 0.30
Abbreviations: CI, confidence interval; GED, General Educational Development; HCHS/SOL, Hispanic Community Health Study/Study of Latinos; SD, standard deviation.
a
Mean values for low, intermediate, and high tertiles were as follows: for self-reported habitual sleep duration, 6.47 (SD, 0.73), 7.86 (SD, 0.29), and 9.24 (SD, 0.66) hours/day; for actigraph-assessed amount of time spent asleep, 5.64 (SD, 0.64), 6.78 (SD, 0.23), and 7.81 (SD, 0.55) hours/day; and for actigraph-assessed amount of time spent in bed, 6.65 (SD, 0.65), 7.85 (SD, 0.25), and 9.05 (SD, 0.64) hours/day.
b
Self-reported sleep duration was calculated as the weighted average of weekday and weekend habitual amounts of time spent in bed minus wake time; actigraphy-measured amounts of time spent in bed and in sleep were also weighted averages of weekend and weekday measurements.
c
asleep. Restricting the data to weekdays (when night-to-night sleep may be more consistent) yielded correlations (ρ= 0.44 vs.ρ= 0.43) andκvalues (κ= 0.26 vs.κ= 0.23) similar to those of the weighted average results.
The association of self-reported sleep duration with actigraphy-assessed time spent asleep varied by sociodemo-graphic, health, and sleep characteristics. Other studies have also observed overreporting of sleep duration relative to ac-tigraphy, with greater discrepancies among men and per-sons with poor sleep quality (7,29,30). In our study, the difference between measured time asleep and self-reported sleep duration did not vary by sleep apnea severity or BMI. In contrast, there were differences identified by age, sex, nightly variability, sleep efficiency, sleep medication use, and smoking.
Other studies have noted that persons with higher BMI, sleep apnea, sleepiness, and depression report shorter sleep durations, which reduces the discrepancy between self-reported and actigraphy-assessed sleep duration (7,31). In keeping with this, we found that after controlling for self-reported sleep duration, males, shift workers, persons with BMI≥35, low sleep efficiency, and excessive daytime sleep-iness, current smokers, and current drinkers slept for fewer minutes each night, while those who were unemployed, had insomnia, or used sleep medication weekly or more often slept a greater number of minutes per night.
Strengths and limitations
To our knowledge, no prior study has validated self-reported sleep duration in such a large sample or among a diverse group of US Hispanics/Latinos. Compared with other validation stud-ies, the active exclusion of participants with severe sleep apnea and the use of a state-of-the-science actigraphy device with a light sensor and off-wrist detection for increased accuracy rep-resent important strengths (7). Additionally, we included more than 5 days of actigraphy and measured key sleep characteris-tics, including insomnia, sleep apnea severity, and sleep med-ication use. The fact that our study population was comprised entirely of Hispanics/Latinos addresses an important gap in sleep research, but it could limit generalizability to other ethnic groups if cultural attitudes or home/neighborhood environ-ments modify reporting of sleep duration relative to actigraphy. Notably, while total sleep time measured by actigraphy and polysomnography have good agreement (r= 0.90) (37,38), actigraphy is not itself a gold standard measure and may mis-interpret inactivity during wake time as sleep, or vice versa. However, polysomnography over the course of multiple nights is impractical in large studies because of the participant burden and expense (39). Additionally, we used an average of 7 nights of actigraphy to estimate habitual sleep duration. Though 7 nights is considered to have reasonable reliability, nightly var-iation in sleep or episodic varvar-iation in sleep duration (e.g.,
“good weeks”and“bad weeks”) undoubtedly weakens the cor-relation with self-reported sleep duration, which is based on questions asking explicitly about habitual or“usual”sleep pat-terns (40). Finally, we asked participants to report bed/wake times but not sleep-onset latency, which may limit comparabil-ity with studies in which participants estimated the actual hours of sleep.
Conclusions
In this cohort of US Hispanics/Latinos, the correlation be-tween self-reported sleep duration and actigraphy-assessed sleep duration was moderate. We confirmed the presence of systematic bias in self-reported sleep duration and showed that participant characteristics (including sex, age, sleep effi -ciency, and night-to-night variability) influence the associa-tion of self-reported sleep duraassocia-tion with actigraphy-measured time spent asleep. However, adding these and other charac-teristics to models provided little additional information to explain the variation in actigraphy-assessed sleep. Future re-search comparing associations of subjectively and objec-tively measured sleep duration with health outcomes and/or using actigraphy measurements in a subset of participants to correct measurement error would be informative as to the de-gree to which reporting bias influences the observed relation-ship between sleep duration and health.
ACKNOWLEDGMENTS
Zee); and Institute for Minority Health Research, University of Illinois at Chicago, Chicago, Illinois (Phyllis C. Zee).
The Sueño ancillary sleep study was supported by a Na-tional Heart, Lung, and Blood Institute (NHLBI) grant (HL098297) to Brigham and Women’s Hospital. The His-panic Community Health Study/Study of Latinos was carried out as a collaborative study supported by contracts between the NHLBI and the University of North Carolina (N01-HC65233), the University of Miami (N01-HC65234), Albert Einstein College of Medicine (N01-HC65235), Northwestern University (N01-HC65236), and San Diego State University (N01-HC65237). The following institutes/centers/offices con-tributed to the Hispanic Community Health Study/Study of Latinos through a transfer of funds to the NHLBI: the National Institute on Minority Health and Health Disparities, the National Institute on Deafness and Other Communication Dis-orders, the National Institute of Dental and Craniofacial Re-search, the National Institute of Diabetes and Digestive and Kidney Diseases, the National Institute of Neurological Disor-ders and Stroke, and the National Institutes of Health Office of Dietary Supplements. E.M.C. was supported by grant T32 DK007703 from the National Institute of Diabetes and Diges-tive and Kidney Diseases.
Conflict of interest: none declared.
REFERENCES
1. Kurina LM, McClintock MK, Chen JH, et al. Sleep duration and all-cause mortality: a critical review of measurement and associations.Ann Epidemiol. 2013;23(6):361–370.
2. Schmid SM, Hallschmid M, Schultes B. The metabolic burden of sleep loss.Lancet Diab Endocrinol. 2015;3(1):52–62. 3. Zhao H, Yin JY, Yang WS, et al. Sleep duration and cancer risk:
a systematic review and meta-analysis of prospective studies. Asian Pac J Cancer Prev. 2013;14(12):7509–7515.
4. Jackson CL, Redline S, Kawachi I, et al. Association between sleep duration and diabetes in black and white adults.Diabetes Care. 2013;36(11):3557–3565.
5. Jackson CL, Hu FB, Redline S, et al. Racial/ethnic disparities in short sleep duration by occupation: the contribution of immigrant status.Soc Sci Med. 2014;118:71–79.
6. Hall MH, Matthews KA, Kravitz HM, et al. Race andfinancial strain are independent correlates of sleep in midlife women: the SWAN Sleep Study.Sleep. 2009;32(1):73–82.
7. Lauderdale DS, Knutson KL, Yan LL, et al. Self-reported and measured sleep duration: how similar are they?Epidemiology. 2008;19(6):838–845.
8. Patel SR, Blackwell T, Ancoli-Israel S, et al. Sleep characteristics of self-reported long sleepers.Sleep. 2012;35(5):641–648. 9. Girschik J, Fritschi L, Heyworth J, et al. Validation of
self-reported sleep against actigraphy.J Epidemiol. 2012;22(5): 462–468.
10. St-Onge MP, Perumean-Chaney S, Desmond R, et al. Gender differences in the association between sleep duration and body composition: the Cardia Study.Int J Endocrinol. 2010;2010: 726071.
11. Lauderdale DS, Knutson KL, Rathouz PJ, et al. Cross-sectional and longitudinal associations between objectively measured sleep duration and body mass index: the CARDIA Sleep Study. Am J Epidemiol. 2009;170(7):805–813.
12. Patel SR, Sotres-Alvarez D, Castañeda SF, et al. Social and health correlates of sleep duration in a US Hispanic population: results from the Hispanic Community Health Study/Study of Latinos.Sleep. 2015;38(10):1515–1522.
13. Grandner MA, Buxton OM, Jackson N, et al. Extreme sleep durations and increased C-reactive protein: effects of sex and ethnoracial group.Sleep. 2013;36(5):769–779e.
14. Knutson KL. Association between sleep duration and body size differs among three Hispanic groups.Am J Hum Biol. 2011; 23(1):138–141.
15. Loredo JS, Soler X, Bardwell W, et al. Sleep health in U.S. Hispanic population.Sleep. 2010;33(7):962–967.
16. Redline S, Sotres-Alvarez D, Loredo J, et al. Sleep-disordered breathing in Hispanic/Latino individuals of diverse
backgrounds. The Hispanic Community Health Study/ Study of Latinos.Am J Respir Crit Care Med. 2014;189(3): 335–344.
17. Sorlie PD, Avilés-Santa LM, Wassertheil-Smoller S, et al. Design and implementation of the Hispanic Community Health Study/Study of Latinos.Ann Epidemiol. 2010;20(8): 629–641.
18. Lavange LM, Kalsbeek WD, Sorlie PD, et al. Sample design and cohort selection in the Hispanic Community Health Study/ Study of Latinos.Ann Epidemiol. 2010;20(8):642–649. 19. Gottlieb DJ, Redline S, Nieto FJ, et al. Association of usual
sleep duration with hypertension: the Sleep Heart Health Study. Sleep. 2006;29(8):1009–1014.
20. Patel SR, Weng J, Rueschman M, et al. Reproducibility of a standardized actigraphy scoring algorithm for sleep in a US Hispanic/Latino population.Sleep. 2015;38(9):1497–1503. 21. Kushida CA, Chang A, Gadkary C, et al. Comparison of
actigraphic, polysomnographic, and subjective assessment of sleep parameters in sleep-disordered patients.Sleep Med. 2001; 2(5):389–396.
22. Marino M, Li Y, Rueschman MN, et al. Measuring sleep: accuracy, sensitivity, and specificity of wrist actigraphy compared to polysomnography.Sleep. 2013;36(11): 1747–1755.
23. Hoos T, Espinoza N, Marshall S, et al. Validity of the Global Physical Activity Questionnaire (GPAQ) in adult Latinas. J Phys Act Health. 2012;9(5):698–705.
24. Lind BK, Goodwin JL, Hill JG, et al. Recruitment of healthy adults into a study of overnight sleep monitoring in the home: experience of the Sleep Heart Health Study.Sleep Breath. 2003; 7(1):13–24.
25. Johns MW. A new method for measuring daytime sleepiness: the Epworth Sleepiness Scale.Sleep. 1991;14(6):540–545. 26. Bastien CH, Vallières A, Morin CM. Validation of the Insomnia
Severity Index as an outcome measure for insomnia research. Sleep Med. 2001;2(4):297–307.
27. Radloff LS. The CES-D Scale: a self-report depression scale for research in the general population.Appl Psychol Meas. 1977; 1(3):385–401.
28. Andresen EM, Malmgren JA, Carter WB, et al. Screening for depression in well older adults: evaluation of a short form of the CES-D (Center for Epidemiologic Studies Depression Scale). Am J Prev Med. 1994;10(2):77–84.
29. Lemola S, Ledermann T, Friedman EM. Variability of sleep duration is related to subjective sleep quality and subjective well-being: an actigraphy study.PLoS One. 2013; 8(8):e71292.
31. Silva GE, Goodwin JL, Sherrill DL, et al. Relationship between reported and measured sleep times: the Sleep Heart Health Study (SHHS).J Clin Sleep Med. 2007;3(6):622–630. 32. Grandner MA, Chakravorty S, Perlis ML, et al. Habitual sleep
duration associated with self-reported and objectively determined cardiometabolic risk factors.Sleep Med. 2014;15(1):42–50. 33. Hasler G, Buysse DJ, Klaghofer R, et al. The association
between short sleep duration and obesity in young adults: a 13-year prospective study.Sleep. 2004;27(4):661–666. 34. Miller CB, Gordon CJ, Toubia L, et al. Agreement between
simple questions about sleep duration and sleep diaries in a large online survey.Sleep Health. 2015;1(2):133–137. 35. Mossavar-Rahmani Y, Shaw PA, Wong WW, et al. Applying
recovery biomarkers to calibrate self-report measures of energy and protein in the Hispanic Community Health Study/Study of Latinos.Am J Epidemiol; 2015;181(12):996–1007.
36. Prentice RL, Mossavar-Rahmani Y, Huang Y, et al. Evaluation and comparison of food records, recalls, and frequencies for energy and protein assessment by using recovery biomarkers. Am J Epidemiol. 2011;174(5):591–603.
37. Sadeh A, Acebo C. The role of actigraphy in sleep medicine. Sleep Med Rev. 2002;6(2):113–124.
38. Ancoli-Israel S, Cole R, Alessi C, et al. The role of actigraphy in the study of sleep and circadian rhythms.Sleep. 2003;26(3): 342–392.
39. Curcio G, Ferrara M, Piergianni A, et al. Paradoxes of thefirst-night effect: a quantitative analysis of antero-posterior EEG topography.Clin Neurophysiol. 2004;115(5): 1178–1188.