Practice of Epidemiology
An Illustration of Inverse Probability Weighting to Estimate Policy-Relevant
Causal Effects
Jessie K. Edwards*, Stephen R. Cole, Catherine R. Lesko, W. Christopher Mathews, Richard D. Moore, Michael J. Mugavero, and Daniel Westreich
*Correspondence to Dr. Jessie K. Edwards, 2101 McGavran-Greenberg Hall, CB 7435, Chapel Hill, NC 27599 (e-mail: [email protected]).
Initially submitted April 30, 2015; accepted for publication December 4, 2015.
Traditional epidemiologic approaches allow us to compare counterfactual outcomes under 2 exposure distribu-tions, usually 100% exposed and 100% unexposed. However, to estimate the population health effect of a proposed intervention, one may wish to compare factual outcomes under the observed exposure distribution to counterfactual outcomes under the exposure distribution produced by an intervention. Here, we used inverse probability weights to compare the 5-year mortality risk under observed antiretroviral therapy treatment plans to the 5-year mortality risk that would had been observed under an intervention in which all patients initiated therapy immediately upon entry into care among patients positive for human immunodeficiency virus in the US Centers for AIDS Research Network of Integrated Clinical Systems multisite cohort study between 1998 and 2013. Therapy-naïve patients (n= 14,700) were followed from entry into care until death, loss to follow-up, or censoring at 5 years or on December 31, 2013. The 5-year cumulative incidence of mortality was 11.65% under observed treatment plans and 10.10% under the intervention, yielding a risk difference of−1.57% (95% confidence interval:−3.08,−0.06). Comparing outcomes under the intervention with outcomes under observed treatment plans provides meaningful information about the potential consequences of new US guidelines to treat all patients with human immunodeficiency virus regardless of CD4 cell count under actual clinical conditions.
antiretroviral therapy; causal inference; epidemiologic methods; HIV; intervention studies; policy; treatment guidelines
Abbreviations: AIDS, acquired immune deficiency syndrome; CI, confidence interval; CNICS, Centers for AIDS Research Network of Integrated Clinical Systems; HIV, human immunodeficiency virus.
Epidemiologists are called upon to estimate the population health effects of interventions for public health practitioners, policy makers, and economists. For example, cost-effectiveness studies require estimates of the effect of an intervention on pop-ulation health as one of many inputs in decision analyses (1). Because randomized trials of such interventions are frequently infeasible or unethical, epidemiologists must often use observa-tional data to estimate the health effects of these interventions. Traditional epidemiologic approaches are used to estimate the effects of exposures that may be targeted by interventions to improve health outcomes in a target population. For exam-ple, to examine the effect of an intervention to prevent a harmful exposure on mortality, a traditional analysis may be used to compare the risk of mortality between those who
are exposed and those who are unexposed. However, even with no confounding, this contrast does not estimate the effect of the intervention under consideration because the intervention would produce only 1 of these counterfactual scenarios (i.e., re-moval of exposure); a more useful approach might be to com-pare the risk of mortality in the population of interest under the observed exposure distribution with the risk of mortality in the population of interest under the counterfactual exposure distri-bution produced by the intervention.
Methods for such approaches are well established. When the contrast of interest is between the risk of the outcome in the observed population and the risk of the outcome under complete removal of exposure, it is sometimes known as a population attributable contrast (2); the population attributable
fraction is a special case of this contrast (3). Recent work has extended methods for estimating the population attributable fraction to situations with time-varying confounding and selec-tion bias (4–6).
An emerging set of epidemiologic questions centers on the effects of policies under consideration that would regulate harmful exposures (e.g., pollutants) or foster beneficial expo-sures (e.g., treatments or healthy behaviors). With these ques-tions comes demand for methods to estimate the effects of population interventions, including simple removal of exposure and beyond (2,7). In recent studies, investigators have used the parametric g-formula to compare the risk of an outcome in the observed data with the risk under an intervention on 1 or more exposures (2,8–14). Althoughflexible, the parametric g-formula requiresfitting parametric models for all time-varying covariates and outcomes, each of which is typically subject to parametric modeling assumptions. Semiparametric methods exist to estimate both the population attributable frac-tion and other populafrac-tion intervenfrac-tion effects (4,5,7,15). However, with a few notable exceptions (16–20), these semi-parametric methods have not been broadly applied to estimate population intervention effects in the epidemiologic literature. Here, we illustrate a semiparametric approach using in-verse probability weightsfirst described by Hubbard and Van Der Laan (7) to estimate the effect of an intervention to change the distribution of an exposure in a target popula-tion. As an example of this approach, we estimate the effect of a change in human immunodeficiency virus (HIV) treatment guidelines in the United States.
SAMPLE AVERAGE EFFECTS VERSUS POPULATION INTERVENTIONS
In many epidemiologic studies, investigators are focused on estimating the sample average causal effect of an expo-sure. Briefly, estimating the sample average causal effect in-volves comparing the potential outcomes (or the outcomes that would have been observed) had all study participants im-mediately become exposed with the potential outcomes that would have been observed had no study participants become exposed throughout follow-up. The sample average causal effect fornsubjects can be thought of as the average ofn subject-specific causal effects or the contrast between an intervention in which all participants are exposed and an intervention in which all participants are prevented from becoming exposed. Estimating the sample average causal effect requires estimating incidence of the outcome under 2 counterfactual exposure sce-narios (all patients becoming exposed at study entry and all pa-tients abstaining from exposure throughout follow-up), neither of which is observed.
Thefields of epidemiology and causal inference have de-veloped a suite of methods to use when estimating the sample average causal effect from complex longitudinal data in the presence of threats to validity from confounding (21–24), selection (25), and measurement error (26–29). However, we can rarely imagine implementing both an intervention to expose the entire population and an intervention to prevent exposure among everyone in the population.
The approach outlined here differs from traditional ap-proaches to estimate the sample average causal effect of
expo-sure in that we compare outcomes under a counterfactual ex-posure distribution (all participants follow exex-posure plana) with outcomes under the observed factual distribution of ex-posure ( participants follow their observed exex-posure plans). This contrast is analogous to the contrast estimated in an ac-tive comparator trial, in which the treatment under investiga-tion is compared with the current standard of care.
Tofix ideas, assume we are interested in comparing the risks of mortality in 2 different scenarios: one in which exposureAis set to plana according to some intervention (the intervention exposure plan) and one in which exposure is unchanged from the value it assumes in the real world (the factual exposure plan). The risk under the factual exposure plan is sometimes known as the natural course in analyses using the g-formula. We define risk for the factual scenario as the cumulative distri-bution function for the time to death,R(t) =P(T≤t) (30). We define the risk for the counterfactual intervention scenario as the cumulative distribution function for the potential time to death under exposure plana;orRaðtÞ ¼PðTatÞ:The
pa-rameters of interest then include risk differences at timet(i.e., RaðtÞ RðtÞ) and risk ratios at timet(i.e.,RaðtÞ=RðtÞ).
ESTIMATION OF INTERVENTION EFFECTS USING INVERSE PROBABILITY WEIGHTS
In this section, we describe one technique for estimating the desired contrast between RaðtÞandR(t) using inverse
probability weights. Other estimation procedures are possi-ble, including algorithms using the parametric g-formula (31) or doubly robust estimators, such as targeted minimum loss estimators (7,18).
Suppose we observe follow-up to timeYiini= 1, . . .,n in-dividuals, whereYiis the minimum ofTi, the time from study entry until the outcome of interest, andCiis the time from study entry until censoring due to loss to follow-up or administrative reasons. Letδirepresent an indicator of experiencing the out-come during the study:δi= 1(Ti<Ci).The unique event times are indexed byj. Capital letters will typically represent random variables and lower case variables will typically represent re-alizations of random variables or constants. We will suppress participant-specific indices where possible below.
Estimating risk under the factual exposure plans
The risk of mortality under the factual exposure plan,R(t), is simply the cumulative distribution function of the time to death,P(T≤t). Under the assumptions of no outcome mea-surement error, no informative censoring, and no competing risks, we can estimateR(t) using the complement of the Kaplan-Meier estimator of the survival function. This estimator can be written as
^
RðtÞ ¼1Y
tj<t 1
PN
i¼11ðYi¼tjÞδi PN
m¼11ðtjYmÞ
( )
;
where tj indexes the unique ordered event times,
PN
i¼11ðYi¼tjÞδi is the number of events at time tj, and
PN
m¼11ðtjYmÞis the number at risk at timetj.
censoring is independent of the outcome, given measured co-variates. When censoring is affected by measured predictors of the outcome, the complement of the weighted Kaplan-Meier estimator of the survival function is a consistent esti-mator ofR(t) (32):
^
RðtÞ ¼1Y
tj<t 1
PN
i¼11ðYi¼tjÞδiπCiðtjÞ PN
m¼11ðtjYmÞπCmðtjÞ
( )
;
where PNi¼11ðYi¼tjÞδiπCiðtjÞ is the weighted number of
events andPNm¼11ðtjYmÞπCmðtjÞis the weighted number
at risk at timetj(33,34). Weights are the inverse probability of remaining uncensored through timetand are estimated as
^
πcðtÞ ¼Y⌊ t⌋
k¼0
PfCðkÞ ¼0jCðk1Þ ¼0g
PfCðkÞ ¼0jCðk1Þ ¼0; L;ZðkÞg;
wherekindexes months after study entry,C(t) =I(Ci≤t),Lis a vector of covariate history ( possibly including the variable to be intervened upon) through timek(32). Further-refined ap-proaches exist to estimate risk of an outcome in the presence of competing risks (35) and outcome measurement error (36).
Estimating counterfactual risks under interventions
Next, we estimate the risk of the outcome under the inter-vention exposure plana; RaðtÞ. If exposure history were
ran-domized in our data, we could estimateRaðtÞ ¼PðTatÞas PðTtjA¼aÞunder the assumption of unconditional ex-changeability (i.e., the assumption that the observed outcomes among exposed patients can accurately reflect the outcomes that would have been observed for unexposed patients had they been treated). Under the assumption of unconditional exchangeabil-ity between exposed and unexposed participants,RaðtÞis the complement of the survival function estimated among partici-pants withA(t) =a.
However, when exposure is not randomly assigned, it is rare that participants who did not follow exposure plana would have the same potential outcome under the interven-tion to impose exposure planaas participants who naturally followed exposure plana. Using the inverse probability of ex-posure weights allows us to make the weakened assumption of conditional exchangeability. That is, we assume exposure as-signment was independent of potential outcomes, given a set of measured covariates; conditional exchangeability requires positivity, or a probability of receiving exposureabetween 0 and 1 for every strata of this set of covariates. As in standard inverse probability–weighted marginal structural models (22), the exposure weights are given by
πEðtÞ ¼Y
⌊t⌋
k¼0
ffAðkÞjAðk1Þg
fðAðkÞjAðk1Þ; L;ZðkÞÞ;
wheref{·j·} is the conditional density function evaluated at the observed covariate values. The counterfactual risk function under interventionacan be estimated as
^
RaðtÞ ¼1Y
tj<t 1
PN
i¼11½Yi¼tj;AðtjÞ ¼aδiπiðtjÞ PN
m¼11½tjYm; AðtjÞ ¼aπmðtjÞ
( )
;
where the weights π^ðtÞ are the product of these exposure weights and the censoring weights, ^πðtÞ ¼^πEðtÞ ×^πCðtÞ,
PN
i¼11½Yi¼tj; AðtjÞ ¼aδiis the number of events with
ex-posureaat timetj, and
PN
m¼11½tjYm;AðtjÞ ¼ais the
num-ber at risk with exposure aat time tj. The numerators and denominators of the censoring and exposure weights can be es-timated using pooled logistic regression (37,38) or ensemble learning approaches (39,40).
EXAMPLE
To illustrate the use of inverse probability weights to esti-mate the effects of population interventions, we use an example from HIV epidemiology. The parameter of interest is the differ-ence between the estimated 5-year cumulative inciddiffer-ence of mortality under immediate initiation of antiretroviral therapy upon entry into HIV care for all patients (the“intervention”) and the 5-year cumulative incidence of mortality under the ob-served treatment patterns (the“factual exposure plan”).
Antiretroviral therapy is known to be effective in extending life expectancy for people living with HIV (23,41–43), and previous guidelines recommended therapy initiation for patients with CD4 cell counts below some threshold and for patients with acquired immune deficiency syndrome (AIDS)-defining illnesses. With increasing evidence that early therapy initiation reduces morbidity and prevents the transmission of HIV (44), recent guidelines have recommended that patients with HIV re-ceive therapy immediately upon entry into HIV-related medical care. We compare estimated mortality under these recent guide-lines to mortality under the observed treatment plans in place between 1998 and 2013 in the Centers for AIDS Research Net-work of Integrated Clinical Systems (CNICS) cohort.
Using the method described here, rather than a traditional marginal structural model in which we compare potential outcomes between universal treatment and no treatment, is appealing in this example. An intervention to treat all patients immediately upon study entry is reasonable, but there has been no point since 1998 when we would consider an inter-vention that would deny life-saving treatment to the entire study population throughout follow-up.
Study sample
The study sample for the present analysis included 14,700 patients who enrolled in CNICS before initiation of antiretrovi-ral therapy and had an unsuppressed viantiretrovi-ral load (>500 copies/ mL) at cohort entry between January 1, 1998, and December 30, 2013. Therapy initiation was defined as the date on which a patient wasfirst prescribed 3 or more antiretroviral agents (for at least 30 days), and patients were considered to be unexposed to therapy until the date of therapy initiation. Unexposed pa-tients may have received monotherapy or dual therapy.
The outcome of interest was all-cause mortality. Deaths were obtained through clinic sources, death certificates, and the Social Security Death index, which is regularly queried by investigators at the CNICS sites.
Statistical methods
Patients were followed from entry into care at a CNICS site until death, loss to follow-up, or administrative censoring 5 years after study entry or on December 31, 2012. Because of missing information on treatment and time-varying covariates,
patients were considered to be lost to follow-up after thefirst 12 months without a documented clinic visit to a CNICS site.
We compared the 5-year risk that would have occurred had all patients initiated treatment immediately upon entry into care with the 5-year cumulative incidence of mortality under the factual treatment plans (i.e., no intervention on treatment). As described above, we estimated the risk of mortality under the factual treatment plans,R(t) =P(T≤t), as the complement of the inverse probability of censoring–weighted Kaplan-Meier estimator of the survival function, in which the denominator of the censoring weights included time-fixed covariates (race, sex, and HIV transmission factor, as well as age, year, and CD4 cell count at study entry) and time-varying covariates (treatment his-tory, AIDS diagnosis, monotherapy or dual therapy use, CD4 cell count, and an indicator of detectable viral load (>500 copies/mL)). The numerator and denominator of the censor-ing weights were estimated uscensor-ing pooled logistic regression, and all continuous variables were modeledflexibly using re-stricted quadratic splines (46).
We estimated the risk of mortality under the intervention to treat all patients immediately,Ra¼1ðtÞ ¼PðTa¼1tÞas the
complement of the Kaplan-Meier estimator of the survival function, estimated among treated patients and weighted to represent the total study sample. Weights ^πðtÞwere the product of the exposure and censoring weights,^πðtÞ ¼^πEðtÞ×
^
πCðtÞ:
The denominator of the exposure weights included the same sets of time-fixed and time-varying covariates that were included in the censoring weights. Again, all continuous vari-ables were modeledflexibly using restricted quadratic splines (46). To summarize treatment history, we follow convention and letAðk1Þ ¼1 if the patient had initiated treatment through timek−1 andAðk1Þ ¼0 otherwise. By definition,
Therapy Initiation, %
0 20 40 60 80 100
Time After Study Entry, years
0 1 2 3 4 5
Figure 1. Cumulative incidence of antiretroviral therapy initiation
under observed treatment plans (also known as the“natural course”) among 14,700 patients at 8 sites in the United States, Centers for AIDS Research Network of Integrated Clinical Systems cohort, 1998–2013.
Table 1. Demographic and Clinical Characteristics of 14,700
Patients at Study Entrya, Centers for AIDS Research Network of Integrated Clinical Systems Cohort, 1998–2013
Characteristic
Patients at Study Entry (n= 14,700)
Person-Years of Follow-Up (n= 47,832), %
No. %
Male sex 11,951 81 81
Black race 5,831 40 39
Hispanic ethnicity 1,604 11 11
Injection drug user 2,413 16 16
MSM 8,801 60 60
AIDS 3,103 21 27
Year at study entry
1998–2002 4,854 33 35
2003–2007 5,003 34 38
2008–2013 4,843 33 27
CD4 cell count, copies/mL
<200 5,148 35 19
200–350 3,165 22 22
351–500 2,872 20 24
501–750 2,472 17 16
>750 1,043 7 7
Suppressed viral loadb 0 0 45
On therapy 0 0 66
Abbreviations: AIDS, acquired immune deficiency syndrome; MSM, man who has sex with men.
aPatients were linked to care at a Centers for AIDS Research Network of Integrated Clinical Systems site between January 1, 1998, and December 31, 2013, at 8 US clinical sites and followed for death for up to 5 years.
PfAðkÞ ¼1jAðk1Þ ¼1g ¼1 under an observational ana-log of the intent to treat assumption (47).
To calculate the numerator and denominator of the inter-vention weights, wefit pooled logistic regression models to estimate the probability of initiating treatment at each time point. The logistic regression model for the denominator,fit only for records in whichAðk1Þ ¼0 had the form
PðAðkÞ ¼1jAðk1Þ; L;ZðkÞÞ
¼expitfβ0þβ1gðtÞ þβ2Lþβ3ZðkÞg;
where expit (·) = exp(·)/{1 + exp(·)}.
We compared the cumulative incidence of mortality under the intervention to immediately treat all patients with the cu-mulative incidence of mortality under no intervention on treat-ment plan using risk ratios and risk differences at 5 years. The 5-year risk differences were estimated asRa¼1ð5Þ Rð5Þ, and
5-year risk ratios were estimated asRa¼1ð5Þ=Rð5Þ. Ninety-five percent confidence intervals for risk differences and risk ratios were calculated using standard errors estimated by the standard deviation of the effect measures in 200 nonparametric bootstrap samples with replacement from the original study sample size with equal probability (11). Statistical analyses were performed using SAS, version 9.4 (SAS Institute, Inc., Cary, North Caro-lina). We could alternatively compare the time to death between the intervention scenario and the natural course using hazard ratios. Details on implementation of this approach in a Cox pro-portional hazards model are provided in the Appendix. We compared results from this analysis to results from a traditional marginal structural model in which we compared interventions to treat all patients immediately and to withhold treatment from all patients throughout follow-up (22,37,38).
Example results
Between 1998 and 2013, a total of 14,700 antiretroviral therapy–naïve patients with a detectable viral load enrolled
in HIV care at a CNICS site. Table1describes the character-istics of the study sample at study entry and over 47,852 person-years of follow-up. Of the 14,700 patients included in the study, 81% were male, 40% were black, and 60% were men who have sex with men. The median CD4 cell count at study entry was 343 cells/mm3(interquartile range, 154–552). A very small proportion of patients entered care with a CD4 cell count higher than 750 cells/mm3(7%).
Over the 5-year study period, 10,035 patients initiated therapy, and the cumulative incidence of therapy initiation
Table 2. Weighted Number of Deaths, Number of Person-Years, and 5-Year Cumulative Incidence of Mortality
Under the Observed Treatment Plans and 2 InterventionsaAmong 14,700 Patientsb, Centers for AIDS Research Network of Integrated Clinical Systems Cohort, 1998–2013
Interventionc No. of Deaths
No. of Person-Years
5-Year
Mortality RR 95% CI RD 95% CI
No intervention 1,185 47,852 11.65 1.00 Referent 0.00 Referent
Initiate treatment at entry into care
530 28,026 10.10 0.87 0.75, 1.00 −1.57 −3.08,−0.06
Never treat 1,162 16,494 30.20 1.00 Referent 0.00 Referent
Initiate treatment at entry into care
530 28,026 10.10 0.33 0.22, 0.50 −20.12 −31.44,−8.80
Abbreviations: CI, confidence interval; RD, risk difference; RR, risk ratio. a
An intervention to initiate treatment immediately upon entry into care and an intervention to prohibit treatment throughout follow-up.
b
Patients received care at a Centers for AIDS Research Network of Integrated Clinical Systems site between January 1, 1998, and December 31, 2013, at 8 US clinical sites and were followed for death for up to 5 years.
c
In the“no intervention”arm, deaths, person years and cumulative incidence estimates were weighted to account for informative censoring. In the“immediate treatment”and“never treatment”arms, quantities were weighted to account for informative censoring and confounding. The means of the censoring weights and exposure weights were 1.00.
Cum
u
lativ
e
Incidence of Mor
tality
, %
0 5 10 15 20 25 30
Time After Study Entry, years
0 1 2 3 4 5
Observed Treatment Plans
Always on Therapy
Figure 2. Weighted cumulative incidence of mortality under
was 82% (Figure1). One-fourth of all patients initiated ther-apy immediately upon entry into care, and half of the patients initiated therapy within 6 months of entry into care. Web Fig-ure 1 (available athttp://aje.oxfordjournals.org/) depicts the cumulative incidence of therapy initiation by baseline CD4 cell count. Under the observed treatment plans, 1,185 deaths occurred over the 5-year study period, and the 5-year cumu-lative risk of mortality was 11.65%. Web Figure 2 shows the risk of death over time by baseline CD4 cell count.
Table2shows a comparison mortality under the observed treatment plans with mortality under the intervention plans. Under the intervention of immediate therapy initiation, the es-timated 5-year cumulative incidence of mortality was 10.10%, yielding a risk difference of‒1.57% (95% confidence interval (CI):‒3.08, ‒0.06) and a risk ratio of 0.87 (95% CI: 0.75, 1.00). The estimates of 5-year mortality under the natural course and the intervention scenario are presented in Figure2.
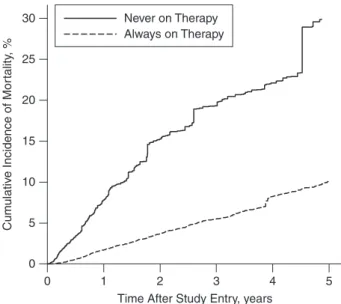
Table2also shows a comparison of the mortality under the intervention in which therapy is initiated immediately upon entry into care with an unrealistic intervention in which treatment is prohibited for all patients throughout follow-up. Under this second intervention, the estimated 5-year cumulative incidence of mortality was 30.20%. This comparison yielded a risk difference of‒20.12% (95% CI:‒31.44,‒8.80) and a risk ratio of 0.33 (95% CI: 0.22, 0.50). Figure3presents the esti-mated cumulative incidence of mortality under each of these interventions.
DISCUSSION
Recent US guidelines recommend treating all patients en-rolled in HIV clinical care with antiretroviral therapy. In the
example, we estimated that 5-year mortality among patients in care for HIV between 1998 and 2013 would have been 10.1% under such an intervention, compared with 11.7% under the observed treatment plans during this time period.
Although treatment with antiretroviral therapy is known to be effective in reducing the mortality risk among people with HIV (41,42,47,48), the effect of changing a treatment guide-line or policy is often unknown. In recent years, large observa-tional cohort studies have been used to study the optimal CD4 cell count at which to begin therapy (49–52) by comparing mortality risks under various hypothetical thresholds for CD4 cell counts. Here, we estimated mortality risk under the most recent treatment guideline (i.e., treat at entry into care) and com-pared this estimated mortality with the observed mortality under the guidelines in place between 1998 and 2013.
To identify the risk under the factual treatment plans, we assumed no error in outcome ascertainment, conditional ex-changeability between patients lost to follow-up and patients who remained in the study (25), and correct specification of the models used to create the censoring weights. To identify risk under the intervention, we additionally assumed no interfer-ence (53), treatment version irrelevance (54), no measurement error in exposure or covariates (28), conditional exchangeability between treated and nontreated patients, positivity (55), and cor-rect specification of the logistic models used to build the expo-sure weights. These assumptions have been described in more depth previously (30).
The example used to illustrate this approach to estimating policy effects had several limitations that should be noted. First, treatment policies and regimens changed dramatically over the study period, leading to ambiguity regarding the in-tervention. For example, patients were considered to have fol-lowed the intervention if they were on any type of combined antiretroviral therapy regimen, without regard to whether that regimen would be prescribed in the future. In addition, this example did not account for changes in HIV testing, care-seeking behavior, and retention in care that may be seen under the guideline recommending immediate treatment for all people living with HIV.
To estimate the effect of the new treatment guidelines, we were required to censor patients at loss to follow-up because of missing treatment data after loss to follow-up. In doing so (and applying the inverse probability of censoring weights), we estimated the risks under the intervention and the natural course that would have been seen had all patients remained in care at a CNICS site, which of course was not the case. From a public health perspective, we may actually be interested in the total effect of having all patients initiate antiretroviral treat-ment immediately upon entry into care, which might include improvements in life expectancy due to the indirect effects of therapy, such as improved retention in care. Unfortunately, this total effect is not directly estimable using these data. In the CNICS cohort, however, mortality was similar (5-year risk ratio = 1.2, 95% CI: 0.9, 1.5) before and after loss to follow-up at a CNICS site (56), suggesting that the total effect of a pro-posed intervention to provide immediate treatment was likely similar to the effect we estimated that was conditional on reten-tion in care at a CNICS site.
Although the cumulative incidence of loss to follow-up was high (46% at 5 years), prior work showing similar mortality
Cum
u
lativ
e
Incidence of Mor
tality
, %
0 5 10 15 20 25 30
Time After Study Entry, years
0 1 2 3 4 5
Never on Therapy Always on Therapy
Figure 3. Weighted cumulative incidence of mortality under an
risks before and after loss to follow-up (56) after accounting for the variables used in the censoring weights suggests that any se-lection bias induced by the high incidence of drop out is likely to be modest. Results were similar with and without application of the censoring weights. Web Figure 3 depicts the cumulative incidence of loss to follow-up by CD4 cell count at baseline, which was a variable included in the denominator of the censor-ing weights.
Because the indicators for treatment with antiretroviral therapy have been well described, we have likely captured many of the important covariates for the intervention weights. However, if an unmeasured predictor of mortality, such as in-come or an unrecorded comorbid condition, were associated with therapy initiation, our results could include bias due to un-measured confounding.
In the example, we assumed that a policy that recom-mended immediate treatment for patients presenting to care with HIV would result in treatment initiation by the patient’s second clinic visit. This assumption could be relaxed by allow-ing a grace period for patients to be initiated on therapy under the intervention. Use of a grace period in inverse probability– weighted marginal structural models has been illustrated by Cain et al. (57).
Because patients who come to CNICS before initiating ther-apy routinely present to care with CD4 cell counts below 500 copies/mL, many patients were treated soon after enrollment in the cohort under their observed treatment plans. For this rea-son, the intervention to treat all patients immediately upon entry into care did not produce a drastic change in the distribu-tion of treatment. Therefore, although therapy is known to re-duce mortality, the incremental effect of transitioning from the existing treatment policies from 1998 to 2013 to a policy to treat all patients in CNICS at entry into care is modest. How-ever, in a hypothetical cohort in which patients were enrolled at HIV seroconversion, we would expect the effect of a policy to provide universal immediate treatment to be much larger.
As outlined above, an inverse probability–weighted esti-mator can be used to estimate the risk of an outcome under counterfactual distributions of exposure(s) produced by pub-lic health or treatment interventions under a set of identifi ca-tion assumpca-tions (30,38). We could have alternatively used the parametric g-formula to estimate the risk under various interventions on exposure (23,58). Both inverse probability weighting and parametric g-formula approaches are suscepti-ble to model misspecification, though the models one is re-quired to specify correctly differ between the approaches. A doubly robust estimator for population intervention effects that offers some protection against model misspecification (i.e., the estimator is consistent if models for treatment assign-ment or outcome are correct) has been described (7), and theory suggests it would improve efficiency over the estimator in which inverse probability weighting is used alone, although the present approach provides a consistent estimator when the identification assumptions hold.
Here, rather than compare potential outcomes under 2 counterfactual exposure distributions, we compared the po-tential outcomes under the intervention to the popo-tential out-comes under the observed exposure distribution—a factual, rather than counterfactual, exposure distribution. The factual exposure distribution is an appealing and informative referent
because it is a clear and realistic alternative to the interven-tion; it is simply the descriptive epidemiology for the out-come of interest. By comparing outout-comes of feasible (or proposed) interventions with outcomes under the status quo, we can produce results from epidemiologic studies that are more directly relevant to public health practice.
ACKNOWLEDGMENTS
Author affiliations: Department of Epidemiology, Gillings School of Global Public Health, University of North Carolina at Chapel Hill, Chapel Hill, North Carolina (Jessie K. Edwards, Stephen R. Cole, Daniel Westreich); Department of Epidemi-ology, Bloomberg School of Public Health, Johns Hopkins University, Baltimore, Maryland (Catherine R. Lesko); School of Medicine, University of California, San Diego, La Jolla, California (W. Christopher Mathews); School of Medicine, Johns Hopkins University, Baltimore, Maryland (Richard D. Moore); and School of Medicine, University of Alabama, Birmingham, Alabama (Michael J. Mugavero).
This work was supported in part by National Institutes of Health grants R01AI100654, R24AI067039, DP2HD084070, P30AI094189, and P30AI50410.
Conflict of interest: none declared.
REFERENCES
1. Walensky RP, Sax PE, Nakamura YM, et al. Economic savings versus health losses: the cost-effectiveness of generic antiretroviral therapy in the United States.Ann Intern Med. 2013;158(2):84–92.
2. Westreich D. From exposures to population interventions: pregnancy and response to HIV therapy.Am J Epidemiol. 2014; 179(7):797–806.
3. Poole C. A history of the population attributable fraction and related measures.Ann Epidemiol. 2015;25(3):147–154. 4. Brinkley J, Tsiatis A, Anstrom KJ. A generalized estimator of
the attributable benefit of an optimal treatment regime.
Biometrics. 2010;66(2):512–522.
5. Sjölander A. Estimation of attributable fractions using inverse probability weighting.Stat Methods Med Res. 2011;20(4): 415–428.
6. Sjölander A, Vansteelandt S. Doubly robust estimation of attributable fractions.Biostatistics. 2011;12(1):112–121. 7. Hubbard AE, Van Der Laan MJ. Population intervention
models in causal inference.Biometrika. 2008;95(1):35–47. 8. Taubman SL, Robins JM, Mittleman MA, et al. Intervening on
risk factors for coronary heart disease: an application of the parametric g-formula.Int J Epidemiol. 2009;38(6):1599–1611. 9. Lajous M, Willett WC, Robins J, et al. Changes infish
consumption in midlife and the risk of coronary heart disease in men and women.Am J Epidemiol. 2013;178(3):382–391. 10. Danaei G, Pan A, Hu FB, et al. Hypothetical midlife
interventions in women and risk of type 2 diabetes.
Epidemiology. 2013;24(1):122–128.
11. Cole SR, Richardson DB, Chu H, et al. Analysis of
occupational asbestos exposure and lung cancer mortality using the G formula.Am J Epidemiol. 2013;177(9):989–996. 12. Ahern J, Hubbard A, Galea S. Estimating the effects of potential
step-by-step illustration of causal inference methods.Am J Epidemiol. 2009;169(9):1140–1147.
13. Edwards JK, McGrath LJ, Buckley JP, et al. Occupational radon exposure and lung cancer mortality: estimating intervention effects using the parametric g-formula.Epidemiology. 2014; 25(6):829–834.
14. Patel MR, Westreich D, Yotebieng M, et al. The impact of implementationfidelity on mortality under a CD4-stratified timing strategy for antiretroviral therapy in patients with tuberculosis.Am J Epidemiol. 2015;181(9):714–722. 15. Taguri M, Matsuyama Y, Ohashi Y, et al. Doubly robust
estimation of the generalized impact fraction.Biostatistics. 2012;13(3):455–467.
16. Snowden JM, Mortimer KM, Kang Dufour M-S, et al. Population intervention models to estimate ambient NO2health effects in children with asthma.J Expo Sci Environ Epidemiol. 2015;25(6):567–573.
17. Fleischer NL, Fernald LC, Hubbard AE. Estimating the potential impacts of intervention from observational data: methods for estimating causal attributable risk in a cross-sectional analysis of depressive symptoms in Latin America.
J Epidemiol Community Health. 2010;64(1):16–21. 18. Padula AM, Mortimer K, Hubbard A, et al. Exposure to
traffic-related air pollution during pregnancy and term low birth weight: estimation of causal associations in a semiparametric model.Am J Epidemiol. 2012;176(9):815–824.
19. Odden MC, Tager IB, Gansevoort RT, et al. Hypertension and low HDL cholesterol were associated with reduced kidney function across the age spectrum: a collaborative study.Ann Epidemiol. 2013;23(3):106–111.
20. Rocca CH, Doherty I, Padian NS, et al. Pregnancy intentions and teenage pregnancy among Latinas: a mediation analysis.
Perspect Sex Reprod Health. 2010;42(3):186–196. 21. Robins J. A new approach to causal inference in mortality
studies with a sustained exposure period? Application to control of the healthy worker survivor effect.Math Model. 1986; 7(9-12):1393–1512.
22. Robins JM, Hernán MA, Brumback B. Marginal structural models and causal inference in epidemiology.Epidemiology. 2000;11(5):550–560.
23. Westreich D, Cole SR, Young JG, et al. The parametric g-formula to estimate the effect of highly active antiretroviral therapy on incident AIDS or death.Stat Med. 2012;31(18): 2000–2009.
24. Hernán MA, Cole SR, Margolick J, et al. Structural accelerated failure time models for survival analysis in studies with time-varying treatments.Pharmacoepidemiol Drug Saf. 2005;14(7): 477–491.
25. Hernán MA, Hernández-Díaz S, Robins JM. A structural approach to selection bias.Epidemiology. 2004;15(5): 615–625.
26. Cole SR, Jacobson LP, Tien PC, et al. Using marginal structural measurement-error models to estimate the long-term effect of antiretroviral therapy on incident aids or death.Am J Epidemiol. 2010;171(1):113–122.
27. Goetghebeur E, Vansteelandt S. Structural mean models for compliance analysis in randomized clinical trials and the impact of errors on measures of exposure.Stat Methods Med Res. 2005; 14(4):397–415.
28. Edwards JK, Cole SR, Westreich DJ. All your data are always missing: incorporating bias due to measurement error into the potential outcomes framework.Int J Epidemiol. 2015;44(4): 1452–1459.
29. Edwards JK, Cole SR, Westreich D, et al. Multiple imputation to account for measurement error in marginal structural models.
Epidemiology. 2015;26(5):645–652.
30. Cole SR, Hudgens MG, Brookhart MA, et al. Risk.Am J Epidemiol. 2015;181(4):246–250.
31. Keil AP, Edwards JK, Richardson DB, et al. The parametric g-formula for time-to-event data: intuition and a worked example.Epidemiology. 2014;25(6):889–897.
32. Robins JM, Rotnitzky A. Recovery of information and adjustment for dependent censoring using surrogate markers. In: Jewell M, Dietz K, Farewell V, eds.AIDS Epidemiology— Methodological Issues. Boston, MA: Birkhäuser;
1992:297–331.
33. Xie J, Liu C. Adjusted Kaplan-Meier estimator and log-rank test with inverse probability of treatment weighting for survival data.Stat Med. 2005;24(20):3089–3110.
34. Westreich D, Cole SR, Tien PC, et al. Time scale and adjusted survival curves for marginal structural cox models.Am J Epidemiol. 2010;171(6):691–700.
35. Cole SR, Lau B, Eron JJ, et al. Estimation of the standardized risk difference and ratio in a competing risks framework: application to injection drug use and progression to AIDS after initiation of antiretroviral therapy.Am J Epidemiol. 2015; 181(4):238–245.
36. Bakoyannis G, Yiannoutsos CT. Impact of and correction for outcome misclassification in cumulative incidence estimation.
PLoS One. 2015;10(9):e0137454.
37. Hernán MA, Brumback B, Robins JM. Marginal structural models to estimate the causal effect of zidovudine on the survival of HIV-positive men.Epidemiology. 2000;11(5): 561–570.
38. Cole SR, Hernán MA. Constructing inverse probability weights for marginal structural models.Am J Epidemiol. 2008;168(6): 656–664.
39. Lee BK, Lessler J, Stuart EA. Improving propensity score weighting using machine learning.Stat Med. 2010;29(3): 337–346.
40. Gruber S, Logan RW, Jarrín I, et al. Ensemble learning of inverse probability weights for marginal structural modeling in large observational datasets.Stat Med. 2015;34(1):106–117. 41. Hammer SM, Squires KE, Hughes MD, et al. A controlled trial
of two nucleoside analogues plus indinavir in persons with human immunodeficiency virus infection and CD4 cell counts of 200 per cubic millimeter or less. AIDS Clinical Trials Group 320 Study Team.N Engl J Med. 1997;337(11):725–733. 42. Cole SR, Hernán MA, Robins JM, et al. Effect of highly active
antiretroviral therapy on time to acquired immunodeficiency syndrome or death using marginal structural models.Am J Epidemiol. 2003;158(7):687–694.
43. Palella FJ Jr, Delaney KM, Moorman AC, et al. Declining morbidity and mortality among patients with advanced human immunodeficiency virus infection. HIV Outpatient Study Investigators.N Engl J Med. 1998;338(13):853–860. 44. Cohen MS, Chen YQ, McCauley M, et al. Prevention of HIV-1
infection with early antiretroviral therapy.N Engl J Med. 2011; 365(6):493–505.
45. Kitahata MM, Rodriguez B, Haubrich R, et al. Cohort profile: the Centers for AIDS Research Network of Integrated Clinical Systems.Int J Epidemiol. 2008;37(5):948–955.
46. Howe CJ, Cole SR, Westreich DJ, et al. Splines for trend analysis and continuous confounder control.Epidemiology. 2011;22(6):874–875.
47. Cole SR, Hernán MA, Margolick JB, et al. Marginal structural models for estimating the effect of highly active antiretroviral therapy initiation on CD4 cell count.Am J Epidemiol. 2005; 162(5):471–478.
structural left-censored mean model.Am J Epidemiol. 2007; 166(2):219–227.
49. Sterne JAC, May M, Costagliola D, et al. Timing of initiation of antiretroviral therapy in AIDS-free HIV-1-infected patients: a collaborative analysis of 18 HIV cohort studies.Lancet. 2009; 373(9672):1352–1363.
50. Cain LE, Logan R, Robins JM, et al. When to initiate combined antiretroviral therapy to reduce mortality and AIDS-defining illness in HIV-infected persons in developed countries: an observational study.Ann Intern Med. 2011;154(8): 509–515.
51. Young JG, Cain LE, Robins JM, et al. Comparative effectiveness of dynamic treatment regimes: an application of the parametric g-formula.Stat Biosci. 2011;3(1):119–143. 52. Kitahata MM, Gange SJ, Abraham AG, et al. Effect of early
versus deferred antiretroviral therapy for HIV on survival.
N Engl J Med. 2009;360(18):1815–1826.
53. Tchetgen Tchetgen EJ, VanderWeele TJ. On causal inference in the presence of interference.Stat Methods Med Res. 2012; 21(1):55–75.
54. VanderWeele TJ. Concerning the consistency assumption in causal inference.Epidemiology. 2009;20(6):880–883. 55. Westreich D, Cole SR. Invited commentary: positivity in
practice.Am J Epidemiol. 2010;171(6):674–677.
56. Edwards JK, Cole SR, Westreich D, et al. Loss to clinic and
five-year mortality among HIV-infected antiretroviral therapy initiators.PLoS One. 2014;9(7):e102305.
57. Cain LE, Robins JM, Lanoy E, et al. When to start treatment? A systematic approach to the comparison of dynamic regimes using observational data.Int J Biostat. 2010;6(2): Article 18.
58. Edwards JK, Cole SR, Westreich D, et al. Age at entry into care, timing of antiretroviral therapy initiation, and 10-year mortality
among HIV-seropositive adults in the United States.Clin Infect Dis. 2015;61(7):1189–1195.
APPENDIX
Estimation of Hazard Ratios
To estimate hazard ratios comparing mortality under an in-tervention to treat all patients immediately upon entry into care with the observed mortality, weights were created as de-scribed above. Briefly, the reference group simply comprises the observed data. All records in the reference group receive a weight of 1. A second copy of the data is weighted as de-scribed in the body of the paper to represent the experience of the study population under the intervention. These 2 data sets are concatenated, and an indicator is assigned denot-ing whether each record is from the reference group (here, INT = 0) or the intervention group (INT = 1).
Next, a Cox proportional hazards model is used to maxi-mize the weighted partial likelihood
LðθÞ ¼Y
N
i¼1
expfθ×INTg
PN
j¼1IðyjyiÞ×expfθ×INTg×wjðyiÞ
( )δi×wjðyiÞ
;