Policy instrument design to reduce financing costs in renewable energy technology projects
Ecofys International BV P.O. Box 8408 NL-3503 RK Utrecht Kanaalweg 16-G NL-3526 KL Utrecht The Netherlands W: www.ecofys.com T: +31 (0)30 280 83 00 F: +31 (0)30 280 83 01 E: [email protected]
David de Jager and Max Rathmann with contributions from
Corinna Klessmann, Rogier Coenraads, Chiara Colamonico, and Marco Buttazzoni
October 2008
PECSNL062979 by order of the:
IEA Implementing Agreement on Renewable Energy Technology Deployment (RETD)
www.iea-retd.org
Policy instrument design to reduce
financing costs in renewable energy
technology projects
S u m m a r y
This report concerns the role of policies and policy instrument design in reducing the financing cost of renewable energy technology projects. What are key elements of successful policy schemes? What conditions should be set for successful design of future policies? What risk management measures can be included in policy schemes to mitigate or transfer risks away from investors and therewith reduce the cost of financing RES and can we apply this to other policy schemes in other countries?
These questions are answered by presenting the interactions of risks and policy design in general, and by considering the specific project finance case of four large-scale renewable energy project cases in more detail: a 20 MWe onshore wind energy project, a 100 MWe offshore wind energy project, a 0.5 MWe solar
photovoltaic energy plant, and a 10 MWe / 26 MWth biomass co-generation plant. Their financial performance was evaluated under different representative policy support schemes (Germany, France, Netherlands, United Kingdom, California, and Québec).
Ensure long-term commitment towards renewable energy
Before looking at the exact design of the various elements in the support schemes, a clear political and societal long-term commitment towards renewable energy is required. Based on this, a stable and reliable support mechanism can be designed, that effectively meets the policy goal, at acceptable levels of investor risk, and at acceptable social costs. Commitment, stability, reliability and predictability are all elements that increase confidence of market actors, reduce regulatory risks, and hence significantly reduce cost of capital. A proper translation of this commitment in the design and timeframe of the support instruments, is the key challenge in this respect.
This effect can be significant: as compared to a support scheme with no particular attention to risk mitigation, the levelised cost of electricity can be reduced by 10 to 30%, with different values for different technologies. Countries with feed-in tariff schemes (Germany, France, and tender procedures in California and Québec) are
10%
to
30%
Good policy instrument design can reduce the cost of renewable electricity by 10 to 30%.
believed to have already realised a significant part of this reduction potential for on- and offshore wind energy and solar photovoltaic energy (e.g. more than 20%).
Remove risks by removing barriers
Policies that improve the success rate of the project development phase will reduce the project investment and hence levelised energy costs of renewable energy technologies. This refers to amongst others:
• improve permitting procedures (e.g. pre-planning, streamlining and
simplification of procedures, one-stop agencies, maximum response periods), and
• improve grid connection procedures (e.g. technical and operational standards, transparent procedures, non-discriminatory access).
The overall effect on the cost of capital of removing barriers is hard to quantify. The direct effect on the levelised cost of electricity can be in the range of 5 to 10% due to increased project cost. But a poor development climate will also result in a higher required return on equity, which could result in a cost increase of the same order of magnitude.
Remove risk by sharing risk
Although not encountered in the case studies, the following instruments can significantly reduce the cost of capital:
• Government loan guarantees
By underwriting all or part of the debt for a project, lenders have significant lower risk in case of default or underperformance of the project. This risk reduction is translated in lower interest rates (e.g. 1-2%, resulting in reductions upto 5-10% in the levelised cost of electricity), but potentially also in longer debt terms and more favourable debt service requirements with even higher reductions in the cost of capital.
• Government project participation and/or investments in infrastructure
Government project participation, for instance by investing in large-scale electrical infrastructure solutions for offshore wind energy, can reduce levelised cost of electricity by for instance 15% or more (with about one third as a direct effect of a reduction in the cost of capital).
Investment subsidies: for demonstration and market introduction
Investment subsidies are believed to be more effective at the demonstration and market introduction phase, than during the deployment phase with a larger emphasis on stimulating production of renewable energy. Investment grants could be converted in equity (government participation) or debt after successful
commissioning of a project. Doing so the effect on the government budget can be kept to a minimum. 5% to 20% 5% to 15%
Debt measures: provide low interest loans and align the debt term with the technical lifetime
Policies that anticipate on risk assessment practices by lenders can reduce costs of capital significantly by creating market conditions and designing support schemes that result in debt terms being close to technical lifetimes (e.g. longer duration of production support and power purchase agreements (PPAs)). Low-interest loans, with discounts on interest rate that are typically in the range of 1-2%, can contribute to this. The direct overall effect of these kind of debt schemes is upto 5-10% on levelised cost of electricity. But indirectly they can affect other key financial parameters used by investors and other lenders, such as the economic lifetime, debt term and debt service conditions. The alignment of the debt period in the German low-interest government loan (e.g. KfW Umwelt Program) with the period of the feed-in tariff scheme, both contribute to significantly lower cost of capital.
Fiscal measures
Fiscal measures can have a significant impact on the levelised cost of electricity of a project. Investment tax deduction, production tax deduction, and flexible or accelerated depreciation schemes reduce levelised cost of electricity from several percent upto 10-20% in the examined cases. Not all projects and finance models will be able to reap the tax benefits of these schemes. A critical issue is the dependency on policies as the fiscal measures result in lower tax income.
Production support
An improved design of current production support schemes, and notably a good alignment with other support policies, can result in additional cost reductions in the range of 2-30%. The high end concerns projects with relative high project risk, such as offshore wind energy or biomass co-generation. For onshore wind energy, these potential improvements are smaller (several percentages to 10-15%), notably for some feed-in tariff and -premium schemes.
Feed-in tariff (FIT) and -premium (FIP) schemes: The most important element of FIP and FIT schemes is that they fully (FIT) or partially (FIP) remove the market risks of a project during a fixed period of time. The longer this period of guaranteed prices, the lower the cost of capital. Because of this, FIT/FIP have in general a relatively large debt schare. For the technologies considered in this report a timeframe of 15 to 20 years is preferred. In feed-in premium schemes the risk of variations in electricity market prices is reflected by a premium in the tariff in the purchase power agreement. It may be hard to acquire a PPA with the same 15 to 20 year tenure at reasonable risk premium levels.
5% to 10% 2% to 20% 2% to 30%
Other production incentives: In some schemes a certain production incentive is given for each unit of renewable electricity produced over a given period of time (e.g. 10 CAN$/MWh over 10 year, in the EcoENERGY for Renewable Power in Canada). This production incentive is not intended to fully bridge the gap between electricity market prices and the price of renewable electricity, but apart from generating additional revenues, it contributes to removing part of the market risks for a project.
Tendering schemes: The tendering schemes discussed in this report (Québec, California) all result in guaranteed project-specific contract prices for a specific period of time. The tendering process is used to let the market determine what the required level of support should be. After winning the tender, a project developer has certainty about his operating income and can use and negotiate favourable financing terms. The project development phase has higher risks, as not all bids will be successful.
Obligation schemes: The cost of capital will generally be higher for obligation schemes due to both higher market risks and perceived regulatory risks. The certificate market - by its design - can not offer a fixed price directly as is the case in FIT/FIP schemes. Furthermore, the level and timeframe of the obligation as well as other key design parameters (e.g. penalties, issuing of certificates), are set by government policies and hence susceptible to policy changes. This results in lower contract periods in the PPA, lower debt terms and higher debt reserve conditions, or, in other words, in a higher levelised cost of electricity.
Reducing the cost of capital in quota obligation schemes can be achieved via various routes, but is not as easily done as with FIT and FIP schemes. A strong government commitment towards the scheme is essential in this respect. Changes in the scheme can seriously affect the continuity of existing projects and have to be applied with specific care. Increasing the economic lifetime, the contract period in the PPA, and the debt maturity will reduce the cost of capital. This could be achieved via the instruments discussed above: by seting favourable conditions in loan guarantees, (low-interest) government loans and/or government participation. The government can also oblige obligated parties to offer long-term contracts. This will be reflected in a risk premium, but – provided that a competitive market is functioning – this premium can be minimised. The main advantage is that the financing cost will be reduced due to the increased security.
General observations
Continuously improve the policy design
Policies that reduce the required return on equity by investors potentially have significant cost reduction implications. Improved design of existing policy support schemes may be more effective in this respect, than a switch to a different policy scheme. Reducing the required return on equity encompasses a wide range of measures that create stability and predictability of markets, amongst others:
(i) long-term and sufficiently ambitious targets should be set,
(ii) the policy instrument should remain active long enough to provide sta-ble planning horizons and for a given project, the support scheme should not change during its lifetime,
(iii) stop-and go policies are not suitable and a country’s ‘track record’ in renewable energy policies probably influences perceived stability very much.
Keep the financing of the support scheme outside the government budget In general, it is recommended that the financing of the support scheme is kept outside the government budget, especially when a country has a track record of multiple changes in policy design and/or allocation of budgets.
Anticipate for different financing models in the policy instrument design In designing new policy instruments and schemes, the changing landscape of renewable energy financing solutions should be closely monitored and incorporated in this design. In designing support schemes, all market actors should be involved. Especially investment funds and banks will be able to provide feedback on the risks related to the design of these instruments.
Table of contents
S u m m a r y i i i
1 I n t r o d u c t i o n 5
1.1 Scope of the report 5
1.2 Objectives 5
1.3 Report structure 6
2 F i n a n c i n g r i s k s o f r e n e w a b l e e n e r g y
p r o j e c t s 7
2.1 Policies affect cost 7
2.2 Risk classes 8
2.3 Risks and the project cycle 9
2.3.1 Project development and financial closure 10
2.3.2 Construction 12
2.3.3 Operation 13
2.3.4 Decommissioning 15
2.3.5 Conclusion 15
2.4 Financing renewable energy projects 15
2.4.1 Project finance 17
2.4.2 Corporate finance 19
2.4.3 Sensitivity of renewable energy costs for changes in key
financial parameters 20
3 O v e r v i e w o f p o l i c i e s a n d m e a s u r e s i n
s e l e c t e d I E A c o u n t r i e s 3 3
3.1 Policy types and general design aspects 33
3.2 Feed-in tariffs and premium tariffs 37
3.3 Quota obligations 38
3.4 Tendering schemes 39
3.5 Fiscal and other support incentives 40
3.6 Policies to reduce administrative and grid barriers 44
4 A n a l y s i s o f s e l e c t e d p o l i c i e s a n d m e a s u r e s w i t h r e s p e c t t o c o s t o f f i n a n c e 4 7
4.1 Introduction 47
4.2 Renewable energy technologies and policy support schemes
for detailed analysis 49
4.3 Technology characterisations 51 4.4 Country characterisations 53 4.4.1 Germany 53 4.4.2 France 60 4.4.3 Netherlands 65 4.4.4 United Kingdom 69 4.4.5 California 76 4.4.6 Québec 91 5 C o m p a r a t i v e a s s e s s m e n t 9 7
5.1 Generic financial assumptions 97
5.2 Onshore wind energy (20 MW) 100
5.3 Offshore wind energy (100 MW) 108
5.4 Solar photovoltaic energy (0.5 MW) 112
5.5 Solid biomass co-generation (10 MWe and 26 MWth) 114
6 C o n c l u s i o n s a n d r e c o m m e n d a t i o n s 1 1 9
6.1 Long-term commitment 119
6.2 Removing risk by removing barriers 120
6.3 Removing risk by sharing risk 121
6.4 Investment subsidies 123 6.5 Debt measures 124 6.6 Fiscal measures 125 6.7 Production support 127 6.8 General observations 129 R e f e r e n c e s 1 3 1
A n n e x e s( s e p a r a t e d o c u m e n t , a v a i l a b l e a t w w w . i e a - r e t d . o r g) A n n e x 1 : C o u n t r y s h e e t s Canada Denmark France Germany Ireland Italy Japan Netherlands Norway Portugal Spain United Kingdom USA A n n e x 2 : E c o f y s c a s h f l o w m o d e l
1
I n t r o d u c t i o n
1 . 1 S c o p e o f t h e r e p o r t
Making investments comes with a cost: both investor and lender have financial criteria that have to be met, resulting in increased project costs as compared to a situation where capital is freely available. The assessment of the associated risk of a project has a major impact on this cost of capital. Higher (perceived) risks will result in applying more stringent criteria, and hence higher cost of capital. As with all investments, investing in renewable energy technologies1 (RES) is not without risk. Apart from possible inherent risks of the specific technology, the policy and social context can be perceived to be or actually be an important risk factor. Most RES still require policy support (both financial and regulatory) and when investors and lenders consider this support as inadequate, unreliable, or too risky in general, this will increase the cost of capital and thus the overall project cost. In turn, this might hinder the further deployment of renewable energy, or result in too high (societal) cost.
1 . 2 O b j e c t i v e s
This report concerns the role of policies and policy instrument design in reducing the financing cost of renewable energy technology projects. What are key elements of successful policy schemes? What conditions should be set for successful design of future policies? What risk management measures can be included in policy schemes to mitigate or transfer risks away from investors and therewith reduce the cost of financing RES and can we apply this to other policy schemes in other countries?
The objectives are to:
• identify design elements in policy instruments reducing perceived risks,
• give best practice examples of implemented international, national or regional
policy designs reducing perceived risks, and
• make concrete recommendations for policy design.
1 In this document renewable energy sources and technologies will be referred to as RES. RES-E refers to production of renewable electricity, RES-H to heat, and RES-F to fuels.
These objectives will be met by presenting the interactions of risks and policy design in general, and by considering the specific project finance of four large-scale RES project cases in more detail:
• a 20 MWe onshore wind energy project,
• a 100 MWe offshore wind energy project,
• a 0.5 MWe solar photovoltaic energy plant, and
• a 10 MWe biomass co-generation plant.
Their financial performance will be evaluated under different representative policy support schemes (Germany, France, Netherlands, United Kingdom, California, and Québec). This should generate more detailed insight in the interplay of the various elements of these support schemes, and contribute to the formulation of more generic recommendations.
1 . 3 R e p o r t s t r u c t u r e
The report has the following outline:
• Financing risks of renewable energy projects (chapter 2)
Introduction to the key elements that contribute to risk and uncertainty in financing RES. This introduction will frame the subsequent assessment and discussion of policies.
• Overview of policies and measures in selected IEA countries (chapter 3 and
Annex 1)
Which policy schemes and instruments have been implemented? What are key uncertainties and risks with respect to financing? What are key success factors that reduce financing cost? What generic lessons can be learned for other policy schemes?
• Analysis of selected policies and measures with respect to the cost of finance (chapter 4 and 5)
What can be learned from a more detailed analysis of a selected set of policy instruments? What are specific risks and uncertainties and how can they be mitigated? What specific lessons can be learned for other policy schemes?
• Conclusions and recommendations: Options for policy designs that reduce the financing cost for RES, including opportunities of coordinating internationally different support policies (chapter 6)
What recommendations can be made regarding policy designs that reduce the financing cost for RES?
2
F i n a n c i n g r i s k s o f r e n e w a b l e e n e r g y
p r o j e c t s
This chapter will discuss the risks that affect renewable energy projects, their effect on financial variables and overall cost of capital.
2 . 1 P o l i c i e s a f f e c t c o s t
There is no straight cause-and-effect chain that perfectly describes how policies affect the cost of renewable energy. However, the following model helps to illustrate several elements that are of importance to the development of renewable energy technologies that currently can not compete with conventional energy conversion technologies on existing markets (see Figure 2-1). In the next section we will provide more detail for each phase of the project cycle.
Political setting
(commitment towards RES)
Policies and measures
(RETs, climate, energy)Risks and Risk perception
•Financial parameters •Costs of capitalCosts of renewable energy
Costs of
technology
Political setting
(commitment towards RES)
Policies and measures
(RETs, climate, energy)Risks and Risk perception
•Financial parameters •Costs of capitalCosts of renewable energy
Costs of
technology
F i g u r e 2 - 1 P o l i c i e s a f f e c t c o s t s o f r e n e w a b l e e n e r g y
It starts with the political setting: is there commitment towards renewables and if so, how is this being substantiated? RES can contribute to the security and reliability of the energy supply system, reduce emissions of greenhouse gases and other air-pollutants, enforce the position of national industries and create jobs, and so on. What is the key driver? And is this commitment felt by all actors in society or only by a restricted group? E.g. on a national versus regional or municipal institutional level, in one or all government departments, by energy companies, by society and its individual citizens, et cetera.
In cases where there is some kind of political commitment, this may be substantiated in policies and measures. This could be in the form of concrete objectives for the share of RES in total energy consumption or for the total installed capacity of RES, via financial support schemes, dedicated standards or legislation, energy market restructuring, or in dedicated administrative procedures. In general, the policies and measures aim to reduce or eliminate the main barriers that RES are confronted with, such as perceived higher costs, or licensing issues.
Project developers, equity investors and debt lenders will assess the technical and financial performance of a RES project. In this assessment they will incorporate both the specific risks associated with the technology, and risks associated with the policy context. This is being translated in the specific financial terms that are being applied in the project financing. Higher risks will result in higher cost of capital and hence higher project costs and resulting energy costs. Policies and measures that reduce (regulatory) risks, generally reduce the (societal) cost of renewable energy.
2 . 2 R i s k c l a s s e s
In this section we will briefly present the risks associated with renewable energy technology projects, both in general terms and related to the phase in the project cycle. In general we can talk about six levels of risk which can affect the cost of capital for a project1:
• Project level risk
Project level risk concerns the risk that is specific to the selected technology and project, notably during the construction and operation phase. This risk level will be discussed in more detail in the next section for each project phase.
• Regulatory risk
Regulatory or institutional risk concerns the risk of adverse changes in the policy context discussed earlier. Policies and measures might change during the project cycle which may have significant impacts on the profitability of a project. Examples are changes to or even ending of policy support schemes or changes to the market design. As most markets for renewables are being regulated under policy schemes, this risk is of particular importance to renewable energy technologies.
1 There are other risk elements that can affect the success and profitability of a project. Within the scope of this report they are not - or less - important.
• Financial risk and Market risk
Financial risk relates to the risk of adverse changes in financial and/or
economic parameters, such as interbank offered interest rates (e.g. EURIBOR, LIBOR, TIBOR) which are the basis for interest rates offered to the market, currency exchange rates, and inflation rates. Market risk concerns variations in prices of commodities, such as prices of biomass and electricity market prices.
• Legal risk
The legal system of a country forms the basis of agreements and contracts between parties. The legal risk comprises the risk that enforcement of these contract obligations is not completely ensured by the legal system.
• (Geo)Political risk
The political risk concerns the risk of major changes in key economic areas, such as a change in foreign-exchange rates by a central bank (sovereign risk).
• Force Majeure risk
Force Majeure risk concerns the risk of any natural catastrophes (e.g. extreme weather, flooding) or human induced calamities (e.g. war or strike).
Project level risk and regulatory risk are of particular relevance to the deployment of RES, with a significant role for policies. Financial or market risk may be important as well, but the mechanisms are similar to or the same as for conventional energy projects. The remaining risk categories are less important for RES in most OECD countries. The weight given to each risk category differs for each technology, country or even region.
A wide range of instruments is available to transfer these risks to other parties which can help to reduce the overall cost of capital or to make the project bankable. Contracts with equipment suppliers or with service companies including
performance guarantees over the project lifetime are an example. Furthermore, insurances and other financial derivatives are available to reduce risks for both investor and lender to the project.
2 . 3 R i s k s a n d t h e p r o j e c t c y c l e
The project cycle of the large-scale renewable energy projects that are covered in this report, generally have the (simplified) structure as depicted in Figure 2-2. Each phase has its own risks, risk management opportunities and sensitivity for policy changes.
Project development
- Project feasibility - Contracting - Siting / Permitting - Engineering designFinancial closure
Construction
Operation
Decommissioning
F i g u r e 2 - 2 T y p i c a l p r o j e c t c y c l e f o r r e n e w a b l e e n e r g y t e c h n o l o g i e s 2 . 3 . 1 P r o j e c t d e v e l o p m e n t a n d f i n a n c i a l c l o s u r e Project development covers a range of activities that are required to realise a financial closure of the project. It encompasses the assessment of the technical and institutional feasibility, preparation of contracts with suppliers of equipment and services and with purchasers of the produced energy, acquisition of land, acquisition of various permits, and (pre-)engineering of the project. All of these elements have to be completed successfully in order to come to an investment decision.This phase already may require significant investments, typically in the order of several percentages of total project cost. A project developer will hence assess the investment climate and weigh each of the risk factors in order to have a maximum chance of reaching financial closure. Typically the following risk factors will be assessed: What is the average lead time for this type of project (which could range from 1 to over 10 years)? Will it be possible to get a permit and a good power purchase agreement (PPA)? Will there be a financial support scheme when the project is ready for financial closure? Will the project be bankable after all, and under what conditions? What can be done to improve these conditions from the equity perspective?
An investor may be willing to take some risk as he will benefit from any upswings in project returns, but lenders are much more risk averse and will demand for several securities that ensure the payment of debt and interest. This is being translated in the financial parameters that lenders apply, such as debt term, interest rate, and debt service coverage ratio (see section 2.4). At the stage of financial
closure, the risk assessment will concern the remaining phases of the project cycle only.
The following risks may be encountered during the project development phase2: Project development phase towards financial closure
Risks: • Acquisition of permits is not successful.
• Connection to the electricity grid is impossible or too expensive.
• Energy purchase agreement is not reached or does not meet the conditions posed by lenders (e.g. the contract period is too short).
• Delay in project development due to legal or institutional procedures, resulting in the project being not viable due to:
- Higher costs of equipment and services
- Unfavourable changes to or elimination of policy support schemes Risk
mitigation:
Providing information to stakeholders and/or offering the opportunity to participate in the project can increase the chance of acquiring permits. Role of
policies:
The role of policies is of crucial importance for the project development phase. The regulatory risk can be reduced by creating a stable and reliable policy framework, for instance by formulating long-term targets, with policy schemes that have sufficient long lifetimes.
The political commitment towards RES needs to be embodied in the complete government organisation. If legal and institutional procedures are geared to a smooth but responsible introduction of renewable energy technologies, the lead time and success rate of projects can be improved, resulting in a faster deployment at lower project costs. This asks for supportive legislation, a facilitating bureaucracy and a fair and transparent organisation of the (energy) markets.
Investment subsidies and/or fiscal measures can contribute to the bankability of a project by reducing the debt leverage.
By making energy resource data available to the market, more certainty in predicted energy yields can be provided to financers resulting in lower cost of capital. As an example: wind speed data could be made available to project developers.
Impact on costs:
The impact on overall project costs can be significant. Delays in the project development phase can increase total project costs even above 10%, in cases with long legal procedures under changing market conditions. The market value of projects that successfully have completed the development phase can be high in a context where only few project initiatives reach this stage, after longer average lead times. This results in higher overall project costs.
The impact on the cost of capital is medium, as the cost of capital at this stage is mainly determined by the risks of the subsequent phases. Specific to
RES:
Given the major impact of policies on the success rate of the project development phase, this is very specific to RES.
2 . 3 . 2 C o n s t r u c t i o n
The construction phase concerns the actual construction of the project, usually by several subcontractors, either subcontracted individually or as a consortium. The construction phase has several risks with potentially high impacts, which are generally not specific to renewable energy projects. It concerns for example cost and/or time overruns which negatively affect the cash flow of the project. Another risk is that subcontractors or suppliers are not able to meet the agreed technical specifications or underperform in other ways. Several generic risk mitigation strategies can be applied, such as insurances and specific contract conditions. The role of policies in reducing the risk during the construction phase is limited, as all permits should have been acquired in the project development phase. However, for new technologies that not yet have an institutional track-record, new institutional barriers might occur during construction. Some governments provide (export) credit facilities to suppliers in order to remove the risk of non-compliance by the supplier due to financial constraints. The perceived effectiveness of the risk mitigation measures is a crucial element in the determination of the financial parameters that are being applied by investors and lenders to the project. Construction phase
Risks: Construction risk
- Time and/or cost overrun
- Technical specifications are not met - Assumptions prove to be not realistic Counterparty risk
Risk mitigation:
• Insurance
• Turnkey contract
• Performance guarantees
• Liquidated damages on non-performance
• Due diligence process for subcontractors and suppliers
Role of policies:
Limited. Some government reduce risks for project investors by providing credit facilities to suppliers.
Impact on costs:
High, given the potential high impact on the cash flow of the project.
Specific to RES:
The risks of this phase are in general not specific to renewable energy technologies. However, some technologies might be more sensitive for particular incidents. For example construction of offshore wind energy projects might suffer delays from (severe) weather conditions.
2 . 3 . 3 O p e r a t i o n
During the operation phase the project will have to generate the net positive cash flow that should provide the required return on equity after payment of debt services and taxes. In renewable energy projects the main contribution to the positive cash flow comes from energy sales. Any disturbance in the production of energy (electricity and/or heat, or fuels) will result in lower income and potentially liquidation of the project. As can be seen from the listing below, several risk types are relevant to the operation phase.
Operation phase
Risks: Performance risk
- Underperformance of installation
- Underperformance of operation and maintenance (O&M) - Theft / damage
Resource risk (incl. fuel supply)
- Variable availability of resource (e.g. windspeed profile or solar irradiation)
- Disturbance in logistics of biomass supply Market risk
- Demand risk (uncompetitive pricing policy of renewable energy projects)
- Price risk (changes in market prices of energy carriers and/or certificates for climate change abatement or renewable energy production)
Regulatory risk
- Design of policy support scheme
cash flow of the project Credit risk
Counterparty risk (e.g. of subcontractor responsible for operation and maintenance (O&M))
Risk mitigation:
Performance risk
- Outsourcing of O&M: e.g. to same EPC (Engineering, Procurement and Construction) contractor, incorporating incentives to perform optimally - Equipment warranties
- Insurances Resource risk
- Insurances, e.g. weather insurance and weather derivatives for wind energy projects
- Long-term biomass supply contracts
- Multi-fuel input concepts for bioenergy projects - Biomass storage
Market risk
- Long-term power purchase agreements (PPA) - Long-term contracts for renewable energy certificates Role of
policies:
Policies can help to reduce the regulatory and market risks for a project, by optimising the following parameters:
• Design of renewable energy policies and/or targets
• Design of support schemes (e.g. feed-in, feed-in premium, quota) • Stability of policy context
• Energy market design
• Role of transmission system operator (TSO) • Role of regulator
Impact on costs:
The impact on costs and cost of finance are high (see section 2.4.3).
Specific to RES:
Given the important role of policy support schemes during the operation phase, this is very specific to the deployment of RES.
The risk profile of the operation phase is again a crucial element in the
determination of the financial parameters at financial closure. Several generic and RES-specific risk mitigation strategies can be applied, which reduce risks or remove them from the project. Examples are weather insurances or weather derivates. Apart from the effectiveness of the risk mitigation measures, the design and perceived stability of the policy support scheme is a key parameter (this is illustrated in section 3.1).
2 . 3 . 4 D e c o m m i s s i o n i n g
The risks of the decommissioning phase are in general low as in many cases the scrap value of the installation is higher than the decommissioning costs. In many cases national regulations ask for the creation of some kind of decommissioning fund, which should be filled during the operation phase or at the beginning of the project.
Decommissioning phase
Risks: No budget available Risk
mitigation:
Decommissioning fund
Role of policies:
Create level playing field for RES and other technologies (e.g. no difference in procedures for decommissioning funds)
Impact on costs: Low Specific to RES: No 2 . 3 . 5 C o n c l u s i o n
As illustrated above, the project development phase and operation phase have significant risks that are or can be affected by policies, and hence have significant impact on project cost and cost of finance. Policies affecting the project
development phase have notably impact on the project cost and market value of the project, and to some extent on the financing cost. The policy and market context of the operation phase are crucial for the financing cost. In the next chapters we will present the policy schemes of selected IEA countries in more detail, and point at the key policy design parameters that can reduce risks and hence financing cost.
2 . 4 F i n a n c i n g r e n e w a b l e e n e r g y p r o j e c t s
In the previous section we’ve illustrated how policies affect risk. In this section we will illustrate how risk affects financial parameters and hence financing cost of RES. In the next chapters an overview will be given of several support schemes in place, and the abovementioned relation between policies and financing cost will be assessed in more detail, but first the key elements and sensitivities of financing renewable energy projects will be presented. As a start, it is good to understand how and by whom RES can be financed. The following types of capital typically can be used to finance a project: loans (debt), equity, and investment grants (subsidy).
A loan or debt is the amount of money that is provided to the project by a third party under the condition that this will be (entirely or partially) repaid during or at the end of the agreed debt term. Furthermore, interest has to be paid at regular intervals over the amount of money that is borrowed. Loans are typically provided by banks, but also individuals or organisations can directly or indirectly (via funds) act as lenders. There are many types of loans, each differently incorporating and securing (perceived) risk, such as senior debt, junior or subordinate debt, or lease finance.
Equity is capital from investors or shareholders that receive dividends from the project in regular intervals (from the so-called free cash flow, the profits after debt service of both senior and junior debt, and after tax payment). The accumulation of dividends over the lifetime of the project should significantly outweigh the initial investment in order to be attractive for investors. The risk for equity providers is much higher than for lenders, resulting in higher costs of finance expressed in the required return on equity (RoE, after tax) being much higher than the interest rate asked by lenders. Equity can be provided by different type of investors, such as individuals or companies providing their own capital, private equity funds, venture capital funds, and shareholders that acquire shares via stock markets. Each have their own risk strategies and will hence apply their own criteria for return on investment.
Often projects are financed with so-called mezzanine capital (or mezzanine debt), which is a hybrid form of finance incorporating a wide variety of both debt and equity arrangements. Typically mezzanine finance will consist of a subordinated debt with additional securities, preference shares, or convertible bonds.
Investment grants (or subsidies), typically provided by governmental organisations, do not need to be repaid and require no payment of dividends. Grants are typically provided to projects that are not commercially feasible or bankable. Sometimes the conditions of the grant may involve conversion into debt or equity in case of commercial success.
There are different financing models that can be used: project finance and corporate (on-balance sheet) finance being the most predominant. But several other models can be used, such as lease financing. Within this study we will concentrate on project finance. For large RES projects with investments ranging from several tens to hundreds of million euros, the project initiator often has not enough capital available to finance the project on its balance sheet and therefore project finance is used.
2 . 4 . 1 P r o j e c t f i n a n c e
In project finance, the cash flow of the project itself determines the structure of the financing model and its key financial parameters. In this section we will illustrate this using an example of a 20 MW onshore wind project in an arbitrary country with no particular support scheme. Assumptions on the key technical, cost, fiscal and financial parameters are given in Table 2-1. The technical parameters
determine the total annual energy production and hence the positive cash flow into the project that can be attained by selling the electricity to the market and/or by acquiring production related fees from RES support schemes. The negative cash flow is mainly determined by the operation cost and preventive and reconstructive maintenance cost, the debt service to lenders (i.e. interest and amortization of the debt), and tax payments.
T a b l e 2 - 1 S i m p l i f i e d p r o j e c t p a r a m e t e r s o f a t y p i c a l 2 0 M W o n s h o r e w i n d p r o j e c t i n a n a r b i t r a r y c o u n t r y w i t h n o s u p p o r t s c h e m e f o r r e n e w a b l e e n e r g y
Technical parameters Financing parameters
Capacity 20 MW Equity parameters
Full load hours 2000 h - Equity shareb 25 %
Technical lifetime 15 yr - Return on equity (RoE) 15 %
Cost parameters - Equity term 15 yr
Investment 22 M€ Debt parameters (annuity)
Operation & Maintenance 0.8 M€/yr - Debt shareb 75 %
Inflation ratea 0 %/yr - Interest rate 6 %/yr
Power purchase agreement - Debt term 10 yr
Electricity tariff 50 €/MWh - Debt Service Coverage Ratioc 1.35
PPA term 10 yr WACCd 6.9 %
Fiscal parameters
Corporate tax 30 %
Tax loss carry-forward no
Depreciation type linear (10 yr) Nominal levelised cost (15 yr) 96 €/MWh
a
In this example, with the inflation rate set at 0%/yr, nominal costs equal real costs.
b The shares of equity and debt are the result of on optimisation routine in the cash flow analysis. At this equity/debt ratio levelised costs are at a minimum, while total project costs have a net present value of zero, and the minimum debt service coverage ratio condition is fulfilled.
c
Annually constrained. d
WACC: Weighted Average Cost of Capital
d e Corporatetax R E D D R E D E WACC ∗ − ∗ + + ∗ + = (1 )
The data of Table 2-1 are used as input to a generic cash flow model (see Annex 2), in essence similar to the one described by Wiser and Kahn (1996)3. The cash flow model incorporates all relevant technical, economic and fiscal variables, and allows for a sophisticated analysis of different policy schemes and technologies4. If the net present value of the free cash flow over the project lifetime is larger than or equal to zero, valued against the return on equity required by the investor, the project basically is viable from the equity perspective. However, in cases where part of the project investment cost is to be covered by debts, the lenders (typically banks) will ask for securities to minimise risks during the operation phase of the project. As discussed in the previous section, several risk mitigation strategies can be applied to satisfy the demands of the lender. But in the end, the lender will lend money against financing conditions that further reduce the risk of non-compliance by the project. Elements of these conditions are the debt term, the debt interest rate and the minimum required debt service coverage ratio (DSCR)5.
The DSCR is the total net operating income divided by the debt service. If DSCR equals unity, all net operating income is used for repayment of interest and amortization, provided that the project exactly performs as described in the business plan. Hence, lenders ask for a DSCR larger than unity, in order to ensure fulfilment of the debt service in cases where the project performs less than projected, for instance due to lower actual wind speeds or reconstructive
maintenance. For renewable energy projects, the DSCR typically ranges from 1.3 to 2, depending on the maturity of the technology and other risk factors. If the net operating income of the project is too low to meet the DSCR requirements, the size of the debt fraction has to be reduced and more equity is required.
The nominal levelised cost of electricity presented in Table 2-1, is the minimum price of the generated electricity that would be required to make the project viable from the equity perspective (net present value of free cash flow ≥ 0) and bankable from the lenders perspective (DSCR ≥ 1.35 in this particular example). This price (including an electricity price growth rate (here taken as 0%/year)) is assumed to be paid for the electricity over the full economic lifetime of the project. Because of the debt service requirements, there is a direct relation with the debt/equity ratio, as illustrated in Figure 2-3. In this particular example the optimum is at about 25% equity. At higher rates, the levelised cost increases as the cost of equity is higher than that of debt (15% versus 6% in this example). At lower rates, the minimum debt service requirement demands higher operating income and hence shows higher levelised cost. Figure 2-3 also illustrates the effect of applying different values for the DSCR. Higher DSCRs result in a shift towards higher equity shares and a
3 Wiser and Kahn (1996)
4 The Ecofys cash flow model for analysis of renewable energy projects has been developed since 1996. For a short description see Annex 2.
higher levelised cost of electricity. The DSCR determines the minimum levelised cost of electricity and the related equity share that can be attained. At higher equity shares, the DSCR can allways be met and is not constraining the debt/equity ratio. In this example, the levelised cost at 25% equity is about 96 €/MWh for a period of 15 years, whereas the power purchase agreements in this example covers only an income of 50 €/MWh over a 10 year period. It is clear that without additional financial support this project will not be feasible.
90 100 110 120 130 0% 20% 40% 60% 80% 100%
Equity (% of total investments)
L e v e li s e d c o s t (€ /M W h e ) DSCR: 1.6 1.5 1.4 1.3 1.35 F i g u r e 2 - 3 L e v e l i s e d c o s t o f e l e c t r i c i t y f o r t h e 2 0 M W o n s h o r e w i n d e n e r g y r e f e r e n c e p r o j e c t : a s a f u n c t i o n o f e q u i t y f r a c t i o n , a n d d e b t s e r v i c e c o v e r a g e r e q u i r e m e n t ( D S C R ) 2 . 4 . 2 C o r p o r a t e f i n a n c e
For comparison we shortly address the case of corporate finance, where the project is financed on the balance sheet of a company. The main implication is that the financing of the project is based on the risk profile of the company as a whole, and not of the particular project. With larger, utility-like companies this usually results in lower risk factors and hence lower cost of capital: Debt rates and debt terms are generally more favourable, and the required return on equity by the company is often lower. Furthermore, there are no restrictions on the debt service of the particular project. This generally results in a reduction of the levelised cost of electricity. The design of both the general fiscal regime and the specific renewable energy support schemes in place, determine the overall difference in levelised cost of project versus corporate finance.
2 . 4 . 3 S e n s i t i v i t y o f r e n e w a b l e e n e r g y c o s t s f o r c h a n g e s i n k e y f i n a n c i a l p a r a m e t e r s
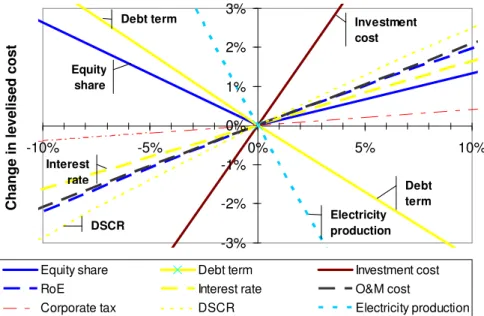
Figure 2-4 illustrates the sensitivity of the levelised cost for changes in several financial parameters for the 20 MW wind energy reference project (with default parameters as presented in Table 2-1). Most of these parameters are directly related to risks and risk perception, and hence touch upon the core topic of this report: how can policies reduce risks and hence cost of capital?
-3% -2% -1% 0% 1% 2% 3% -10% -5% 0% 5% 10% Change in variable C h a n g e i n l e v e li s e d c o s t
Equity share Debt term Investment cost
RoE Interest rate O&M cost
Corporate tax DSCR Electricity production
Debt term Electricity production Investment cost Debt term Equity share DSCR Interest rate F i g u r e 2 - 4 S e n s i t i v i t y o f n o m i n a l l e v e l i s e d c o s t o f e l e c t r i c i t y ( y - a x i s ) f o r c h a n g e s i n k e y f i n a n c i a l p a r a m e t e r s ( x - a x i s ) f o r t h e 2 0 M W o n s h o r e w i n d e n e r g y r e f e r e n c e p r o j e c t
Changes in electricity production and investment have the largest impact on levelised cost, followed by the operation and maintenance (O&M) cost, the key variables of the debt conditions and the required return on equity (RoE), which are directly related to project risks.
Investment and operation and maintenance (O&M) costs
Changes in investment and operation and maintenance costs have significant impacts on levelised cost. For bioenergy projects, with typically lower specific investment costs but higher operation costs due to fuel consumption, the
importance of these O&M costs is even more prominent than shown here for the wind energy case.
As discussed before, investment costs are partly related to policies and measures via the success rate of project development. The lower this rate, the higher the market value of developed projects, which is translated in higher investment costs and/or higher required return on equity (see below). Impacts on levelised cost are significant. In this particular example a 10% higher investment results in an 8% higher levelised cost. At financial close the investment costs are known. During construction cost overruns might occur, but as indicated before several risk mitigation strategies can be applied to reduce the impact on overall project performance.
Operation and maintenance costs are generally less affected by policies. One exception concerns the use of biomass in bioenergy projects. Changes in policies affecting the key drivers of different biomass markets (e.g. for biofuels, electricity and/or heat, materials) will affect biomass prices and hence operation costs of these type of projects. This may concern changes in biomass sustainability criteria, targets for biofuels, and so on. This uncertainty will be reflected in the debt and equity parameters and hence contribute to a higher cost of capital.
Based on the above, the following generic statements can be made (see also OPTRES (2007)):
Debt parameters
The key debt parameters are debt term, interest rate, minimum required debt service coverage ratio (DSCR), and debt share. Figure 2-5 shows the levelised cost of electricity and the equity share as a function of the former three parameters (see also Figure 2-3). The dependency is straightforward: higher debt terms, lower interest rates and lower debt service requirements will result in lower levelised cost. In project finance the debt term is typically related to the terms of energy purchase contracts and/or support schemes, restricted by the technical lifetime of the
Policies that improve the success rate of the project development phase will reduce the project investment and hence energy costs of renewable energy technologies. This refers to amongst others:
Improving permitting procedures (e.g. pre-planning, streamlining and simplification of procedures, one-stop agencies, maximum response periods)
Improving grid connection procedures (e.g. technical and operational standards, transparent procedures, non-discriminatory access)
A stable and predictable long-term policy context will contribute to this improved success rate and reduce both investment cost and cost of capital.
technology but rarely larger than 15 year. Hence, energy market characteristics and renewable energy policies have a direct and strong impact on this parameter. In this particular example an extension of the debt term from 10 to 15 years will reduce levelised cost by 12%. It should be noted that (large) projects can often be refinanced after a period of satisfactory operation. With more uncertainties being eliminated (the project operates as expected, or even better) more favourable debt conditions can often be negotiated.
The interest rate that lenders negotiate with the project owners reflects many general economic conditions (such as interbank interest rates) as well as project related technical and situational aspects. This includes an assessment of the effectiveness of various risk mitigation measures (see section 2.3) and of the maturity of the renewable energy technology or the practices and technologies used for construction and operation of this technology (notably relevant for offshore wind or geothermal energy projects). If detailed site-specific resource and risk conditions are well known and understood, this will reduce cost of capital by improved debt conditions. For instance, the availability of wind speed data can reduce negotiated interest rates by several tens of percent points in particular cases. A reduction of the interest rate from 6% to 5% will result in cost reductions of about 3% in the current example.
The debt service coverage ratio shows a similar reflection of the risk-assessment by lenders as is the case for the interest rate. New, unproven technologies will
generally encounter a higher DSCR value than proven technologies (typically 2 or higher). In our example, an increase in the DSCR from 1.35 to 2 will result in a cost increase of 10%. A reduction from 1.35 to 1.3 results in a cost reduction of 1%. If debt reserves can be created, annual DSCR constraints can be partly covered by banking the surplus of previous years. This increases the leverage of a project. As discussed before, the equity/debt ratio is typically the result of finding the optimum configuration of financial parameters. In our (simplified) case this means achieving the highest return on investment, while at the same time meeting the debt service requirements, which is clearly shown in Figure 2-3. In actual project finance cases this optimisation will concern many more parameters.
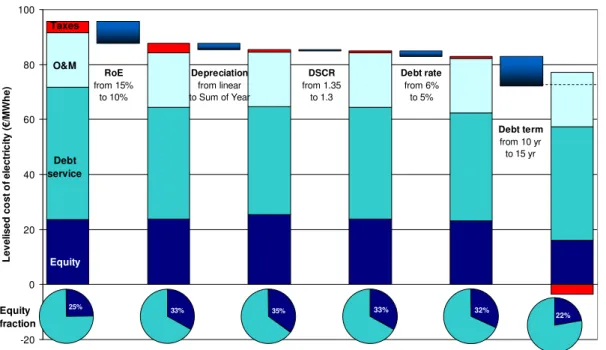
A reduction in (perceived) risks typically affects more than one of the debt parameters at the same time. The combined effect of the above changes in debt parameters for the wind energy example (debt rate 5%, debt term 15 year, DSCR = 1.3) can be larger than the sum of the individual effects: the combined cost
F i g u r e 2 - 5 L e v e l i s e d c o s t o f e l e c t r i c i t y f o r t h e 2 0 M W o n s h o r e w i n d e n e r g y r e f e r e n c e p r o j e c t : a s a f u n c t i o n o f d e b t t e r m ( t o p ) , i n t e r e s t r a t e ( m i d d l e ) , a n d d e b t s e r v i c e c o v e r a g e r a t i o ( b o t t o m ) 0 20 40 60 80 100 120 140 0% 5% 10% 15% 20%
Interest rate (%/year)
L e v e li s e d c o s t (€ /M W h e ) 0% 20% 40% 60% 80% 100% E q u it y ( % ) 0 20 40 60 80 100 120 140 5 10 15
Debt term (year)
L e v e li s e d c o s t (€ /M W h e ) 0% 20% 40% 60% 80% 100% E q u it y ( % ) 0 20 40 60 80 100 120 140 1.0 1.1 1.2 1.3 1.4 1.5 1.6 1.7 1.8 1.9 2.0
Minimum debt service coverage ratio (-)
L e v e li s e d c o s t (€ /M W h e ) 0% 20% 40% 60% 80% 100% E q u it y ( % ) Levelised cost Equity
The policy implications can be summarised as follows:
Equity parameters
The most important equity parameters are the required return on equity after taxes (RoE) by the investor, and the equity share. As illustrated in Figure 2-3, the latter is closely related to the conditions of the lender, such as the debt service coverage ratio.
Figure 2-6 shows that a higher required return on equity results in a shift from equity to debt. In order to meet debt service requirements, the levelised cost needs to increase at the same time. If the required return on equity decreases from 15% to 10% the levelised cost declines by about 8% in this example.
Policies that anticipate on risk assessment practices by lenders can reduce costs of capital significantly:
Create market conditions and design support schemes that result in debt terms being close to technical lifetimes (e.g. longer duration of production support and PPAs).
For large investments in infrastructure (e.g. offshore electricity grids with technical lifetimes of components ranging from 20 to 40 year), this could imply investments by transmission system operators (TSOs) based on corporate finance at more favourable debt conditions (much longer term, lower interest rate due to lower risk, et cetera).
Take measures that result in lower interest rates, e.g.: - offer low (state bank) interest rates
- offer tax deductions for investments in renewable energy funds - facilitate the collection and disclosure of site-specific resource and other
relevant data, such as meteorological, geological or bathymetric data (e.g. wind, solar, wave and tidal energy resource)
Facilitate the demonstration of new technologies that will result in improved knowledge on the risk profiles of these technologies and hence reduce the debt service requirements and required return on equity for future projects.
Reduce risks, e.g. by offering bank guarantees, or by participating as co-investor in projects.
0 20 40 60 80 100 120 140 5% 10% 15% 20% 25%
Required Return on Equity (%)
L e v e li s e d c o s t (€ /M W h e ) 0% 20% 40% 60% 80% 100% E q u it y ( % ) F i g u r e 2 - 6 L e v e l i s e d c o s t o f e l e c t r i c i t y f o r t h e 2 0 M W o n s h o r e w i n d e n e r g y r e f e r e n c e p r o j e c t : a s a f u n c t i o n o f r e q u i r e d r e t u r n o n e q u i t y
What value of the required return on equity is being used by equity providers? An investor can choose amongst different investments, with different profiles in terms of risk, maturity, and payment of dividend and return of principal. Dunlop (2006)6 and stakeholders interviewed for this study state that large RES projects compete for capital with listed asset classes related to infrastructure (e.g. water supply, shipping, harbours, conventional electricity supply, real estate). These listed asset classes have similar financial characteristics as many RES projects, and typically have an internal rate of return (IRR) of about 7-9% (post-tax). The return on equity for RES projects is then typically the sum of7:
• a risk-free rate (e.g. 3-5% for 10 year government bonds);
• an equity risk premium related to the performance of similar listed asset classes
as discussed above (e.g. a premium of 4-5% to compare with the IRR of 7-9%);
• in case the equity is provided via a fund, management fees add 2% or more to the equity rate, and an illiquidity premium of about 3% may be incorporated by the investor for the fact that the shares can not be sold as easily as stock exchange listed funds;
• a technology or “esoteric asset class” premium for new and unproven
technologies or institutional situations (e.g. 3-15%); and
• a regulatory risk premium reflecting the risks of the energy markets and renewable energy support schemes (e.g. a -3% reduction for low-risk to +3% extra for schemes with higher risk).
6 Dunlop (2006)
Depending on the investment strategy of the equity provider (and the actual macro-economic parameters) the required return on equity will vary from about 12-15% for proven technologies (such as onshore wind energy) in markets with no additional regulatory risk. As mentioned, one of the aspects affecting the required return on equity is the regulatory context and the renewable energy support scheme in place.
Following a slightly different approach, the European Wind Energy Association8 has derived estimates for the Weighted Average Cost of Capital (WACC) for renewable electricity projects in Europe under different support schemes. From this the required return on equity can be derived9 which results in similar results, as shown in Figure 2-7.
The figure shows that the values are lowest for in schemes, followed by feed-in premium and tenderfeed-ing schemes, obligation schemes with tradable green certificates, and finally investment subsidies. Furthermore, the figure shows that significant improvements can be achieved in designing more advanced schemes where several barriers are being removed. As discussed before, this has significant impact on the levelised cost of energy. The advanced schemes have the following elements: apply sufficient long periods of support (e.g. 10 to 20 year) in feed-in tariff (FIT) and –premium (FIP) schemes, use technology-specific tariffs/premiums or investment subsidies, allow for changes in cost structures (for new capacity), use stepped tariffs (FIT) for different resource categories (e.g. reflecting differences in wind classes), allow for longer term power purchase agreements (e.g. minimal 15 years in tender schemes), use clear tender procedures with deadlines and
meaningful penalties, and long-term (> 20 year) mandatory targets for obligation schemes.
It should be emphasized that the RoE’s depicted in Figure 2-7 are generic and will change over time depending on changes in general economic conditions,
technologies, design and organisation of market, and design of policy schemes; and due to advanced experience with these schemes. Furthermore, the data are not technology specific, whereas in practice there will be a discrepancy between technologies.
8 EWEA (2005), note the calculations of the WACC in this EWEA report are not consistent with conventional WACC calculations
9 Using the default values for interest rate, equity share and corporate tax as given in Table 2-1.
0% 5% 10% 15% 20%
Feed-in Tariff Feed-in Premium Tender Tradable Green
Certificates Investment Subsidies R e q u ir e d r e tu rn o n e q u it y ( % )
Generic support scheme Advanced support scheme
F i g u r e 2 - 7 R e q u i r e d r e t u r n o n e q u i t y a s a f u n c t i o n o f t h e r e n e w a b l e e l e c t r i c i t y s u p p o r t s c h e m e , b o t h f o r c u r r e n t g e n e r i c s c h e m e s a n d m o r e a d v a n c e d s c h e m e s8
The policy implications can be summarised as follows:
Tax parameters
The fiscal regime present in a country or region is important for the feasibility and bankability of a renewable energy project. Important factors are (amongst others) the corporate tax level, the applicable tax depreciation methods, and the amount of flexibility built in the tax system (e.g. with regards to accounting practices
regarding loss carry-back or carry-forward).
Policies that reduce the required return on equity by investors potentially have significant cost reduction implications.
Improved design of existing policy support schemes may be more effective in this respect, than a switch to a different policy scheme.
Reducing the required return on equity encompasses a wide range of measures that create stability and predictability of markets, amongst others:
long-term and sufficiently ambitious targets should be set
the policy instrument should remain active long enough to provide sta-ble planning horizons and for a given project, the support scheme should not change during its lifetime
stop-and go policies are not suitable and a country’s ‘track record’ in RES policies probably influences perceived stability very much
0 20 40 60 80 100 120 140 15% 20% 25% 30% 35% 40% 45% Corporate tax (%) L e v e li s e d c o s t (€ /M W h e ) 0% 20% 40% 60% 80% 100% E q u it y ( % ) F i g u r e 2 - 8 L e v e l i s e d c o s t o f e l e c t r i c i t y f o r t h e 2 0 M W o n s h o r e w i n d e n e r g y r e f e r e n c e p r o j e c t : a s a f u n c t i o n o f c o r p o r a t e t a x l e v e l s ( l i n e a r f i s c a l d e p r e c i a t i o n o v e r 1 0 y e a r )
Corporate taxes vary around the world, from 0% in the Cayman Islands to 55% and even more for foreign investors in oil projects in the United Arab Emirates.
However, most countries have tax levels within the range of 15% to 40%10. As can be seen from Figure 2-8, changes in corporate tax levels only have a limited effect on the levelised cost of electricity: a reduction from 30% to 20% results in a cost reduction of about 1% in the considered example.
More important are the accounting rules that are used to depreciate the asset over its fiscal lifetime. Figure 2-9 depicts different asset depreciation methods for a project with a residual value of 10% at the end of the depreciation period (default chosen as 10 year):
• the linear or straight line depreciation (a fixed percentage per year) • the sum-of-years depreciation (highest depreciation in the first years)
• the single and double declining balance depreciation, with and without a switch to straight line depreciation if this is larger than the depreciation under
declining balance
• Modified Accelerated Cost Recovery System (MACRS) over 5 and 15 years
(here depicted according to the half-year convention), as used in the United States of America
0% 5% 10% 15% 20% 25% 30% 35% 0 5 10 15 Year D e p re c ia ti o n o f a s s e ts (m in u s s a lv a g e v a lu e ) Straight line Sum-of-years Declining balance Declining balance, with switch to straight line Double Declining Balance Double Declining Balance, with switch to straight line MACRS 5 year MACRS 15 year F i g u r e 2 - 9 E x a m p l e o f f i s c a l d e p r e c i a t i o n o f a s s e t s u n d e r d i f f e r e n t m e t h o d s , r e l a t i v e t o t h e b o o k v a l u e a t t h e s t a r t o f p r o j e c t ( r e s i d u a l v a l u e a t t h e e n d o f d e p r e c i a t i o n : 1 0 % ; d e p r e c i a t i o n p e r i o d : 1 0 y e a r , e x c e p t f o r M A C R S : 5 a n d 1 5 y e a r ( h a l f - y e a r c o n v e n t i o n ) ) 15 yr 15 yr 15 yr 15 yr 15 yr 10 yr 10 yr 10 yr 10 yr 5 yr 85 90 95 100 Linear/ Straight line Sum-of-Year SDB DDB MACRS L e v e li s e d c o s t (€ /M W h e ) D e fa u lt F i g u r e 2 - 1 0 L e v e l i s e d c o s t o f e l e c t r i c i t y f o r t h e 2 0 M W o n s h o r e w i n d e n e r g y r e f e r e n c e p r o j e c t : a s a f u n c t i o n o f f i s c a l d e p r e c i a t i o n m e t h o d s a n d t e r m s ( n o r e s i d u a l v a l u e ) ( S D B r e s p . D D B : s i n g l e r e s p . d o u b l e d e c l i n i n g b a l a n c e d e p r e c i a t i o n , w i t h s w i t c h t o s t r a i g h t l i n e d e p r e c i a t i o n ; M A C R S : M o d i f i e d A c c e l e r a t e d C o s t R e c o v e r y S y s t e m )