Lehrstuhl für Betriebswirtschaftslehre VII Wirtschaftsinformatik
UNIVERSITY OF
BAYREUTH
University of Bayreuth
Department of Information Systems (BWL VII)
Universitaetsstrasse 30, D-95440 Bayreuth
Phone ++49 921 552807, Fax ++49 921 552216
E-Mail: [email protected]
Internet: http://wi.oec.uni-bayreuth.de
Making Simulation Work for the
Organizational Design of Communication Centers:
Challenges and Practical Experience
Michael Zapf, Katja Storch
Working Paper 6/2001
Working Papers in Information Systems
Communication Centers: Challenges and Practical Experience
Michael Zapf
Research and Teaching Assistant University of Bayreuth/Germany [email protected] Katja Storch MBA-Student University of Bayreuth/Germany [email protected]
Keywords: Organizational design, process design,
commu-nication center, case studies, process evaluation
Abstract
In this paper some important challenges for the design of communication centers are discussed. The practical value of discrete event simulation for this domain is shown, and a method for the systematic evaluation of organizational de-signs is presented. This approach has been tested in practice and the results of two cases will be documented in detail.
1. CHALLENGES AND PRACTICAL
VALUE OF SIMULATION
Many organizations deploy communication centers in order to establish effective and satisfactory interactions with actual and potential clients. In 1999 12.750 communication centers existed only in Europe and this figure is expected to rise up to 28.000 until 2006 [Frost and Sullivan 2000]. Ac-cording to Cleveland, one goal of communication center management is to handle the workload of incoming cus-tomer requests with the desired service level on a high-quality standard [Cleveland and Mayben 1997]. Qualified employees (agents) and a well-designed organizational structure are prerequisites to reach this goal.
Some challenges for the design of communication cen-ters arise from the dynamic environment, especially the un-predictable behavior of customers. This often manifests in varying volumes of incoming requests, varying uses of communication channels, varying processing times and varying abort rates.
Therefore many stochastic effects have to be taken into consideration and stochastic discrete event simulation seems to be an obvious tool [Law and Kelton 1991]. Simulation can be used to evaluate the performance of specific organiz-ational designs under given environmental factors and al-lows the selection of the best design for a given purpose [Zapf and Heinzl 2000].
Nevertheless there are critical success factors for put-ting simulation into practice. We identified the following two:
• Getting appropriate input data and
• meeting the given time restrictions.
Especially for the design of new communication centers it is difficult to get “good” data because of the lack of his-torical data. Apart from that the modeling and simulation process have to be finished after a few days but the results must build a sound base also for the future organization.
2. MAKING SIMULATION WORK
In order to handle the challenges for the organizational design of communication centers we suggest two strategies:
• Evaluate many environmental situations in order to an-ticipate the effects of changing environments.
• Automate the evaluation process with the help of a simulation control system to meet the time restrictions.
The systematic evaluation of many environmental con-stellations can be performed in the following steps [Heinzl and Zapf 2000]:
1. Identify potential organizational designs, relevant per-formance measures, relevant influence factors and ac-companying mean values and critical values.
2. Simulate
a) all designs under normal conditions (mean values) and
b) worst case scenarios for all designs (critical values). 3. Condense and visualize the results.
For automating this process, the simulation control system SimControl has been built [Zapf 2001]. All relevant parameters and results can be stored in a simulation data-base and multiple simulation experiments can be automati-cally performed. The system has been implemented as Mi-crosoft Access application and utilizes the ARENA program as simulation kernel [Kelton et al. 1998].
The presented evaluation procedure has been applied to different design problems in practice [Zapf 2001, Storch 2000]. In the next sections we will present the results of two case studies in detail.
3
THE BACK OFFICE CASE
3.1 Description
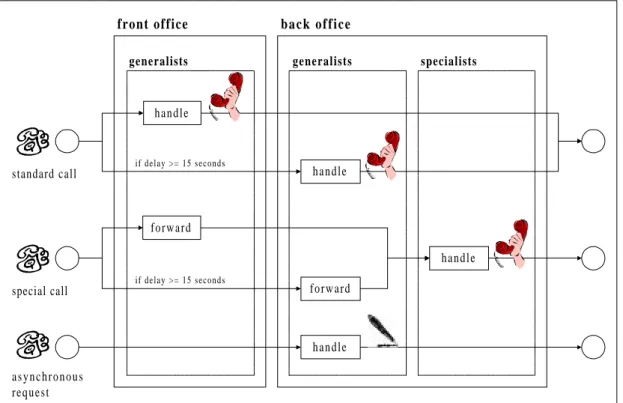
The first case deals with different routing strategies for an enterprise of the water supply industry. The correspond-ing communication center consists of two parts, a front of-fice and a back ofof-fice. The organizational processes have been modeled in form of Petri-nets [Van der Aalst 2000] which are presented in Figure 1.
Most of the incoming requests are standard calls which deal with questions according to invoices and reminders, modifications of customer data and requests for general in-formation. Standard calls are normally handled by agents with general knowledge (generalists) in the front office. If customers have to wait more than 15 seconds for an em-ployee in the front office, the call is automatically routed to the back office. The same procedure is also valid for the first routing part of special calls which deal with technical prob-lems or difficult data modifications. The generalist who receives such a special call forwards it to an agent with spe-cific knowledge (specialist) in the back office. Asynchro-nous requests are posted as letters, faxes or e-mails and are directly routed to generalists in the back office.
In the back office case it has been examined if it is makes sense to route exceptional standard requests with long processing times from an agent in the front office to a
generalist in the back office. This routing strategy obviously has two conflicting effects:
1. The talk times in the front office can be reduced and therefore more agents are available to accept calls. 2. There arises an additional effort from classifying and
forwarding of exceptional standard requests.
3.2
Simulation Model and Data
The basic structure of the simulation model A without routing of exceptional requests can be directly derived from the process model of Figure 1. Model B results from parti-tioning of standard calls into frequent and exceptional calls. Frequent calls are handled like a standard call in model A. Exceptional calls are accepted by generalists in the front office and are forwarded to generalists in the back office after a short classification time.
Both models have been implemented with the ARENA simulation tool-set, which provides a graphical user inter-face for the generation of SIMAN programming code [Kel-ton et al. 1998].
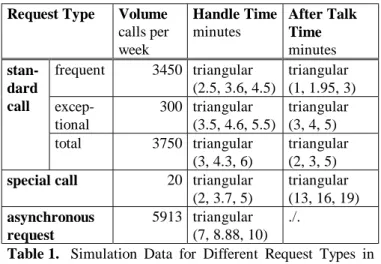
The initial data situation for the different request types is presented in Table 1. The triangular distribution is used for modeling talk and after talk times since the exact distribution forms are not known, but estimates for the minimum, maximum and most likely values are available [Kelton et al. 1998, 512].
handle
generalists
standard call
generalists specialists
front office back office
if delay >= 15 seconds handle a s y n c h r o n o u s request handle forward special call if delay >= 15 seconds forward handle
calls per week minutes Time minutes frequent 3450 triangular (2.5, 3.6, 4.5) triangular (1, 1.95, 3) excep-tional 300 triangular (3.5, 4.6, 5.5) triangular (3, 4, 5) stan-dard call total 3750 triangular (3, 4.3, 6) triangular (2, 3, 5)
special call 20 triangular
(2, 3.7, 5) triangular (13, 16, 19) asynchronous request 5913 triangular (7, 8.88, 10) ./.
Table 1. Simulation Data for Different Request Types in
the Back Office Case
Additional simulation data concerning the number of agents, the waiting tolerance of customers and the forward time are summarized in Table 2.
Parameter Value Dimension
generalists front office 10 # agents generalists back office 18 # agents agents specialists 1 # agents wait time until
abandonment triangular (0.5, 1, 1.5) minute call back % 70 % waiting tolerance
wait time until call back triangular (1, 5, 10) minute exceptional requests 20 % talk time forward time
special requests 20 % talk time
Table 2. Additional Simulation Data in the Back Office
Case
3.3
Experimental Design
Both organizational designs have been evaluated under five different environmental situations. Starting from the
normal situation, which reflects the initial data situation of
section 3.2, different simulation parameters have been modified:
• The overload situation results from an increase of 50% of the average request volume. The volume of standard calls goes up to 5625 calls, for example.
• The situation of staff absence results in the absence of one front office generalist and three back office general-ists.
utes results in the low tolerance situation.
• In the long classification situation the classification time for exceptional calls is doubled to 40 percentage of the talk time.
The single experiments have been undertaken in the form of multiple terminating simulation runs [Kelton et al. 1998]. The planning horizon was one week with different opening hours per day. In order to obtain expressive results, we launched 100 runs for every experiment, every run repre-senting one week of operation.
3.4
Results
The performance of the alternative process designs is analyzed according to two performance measures, the aver-age lost call rate for standard calls and the averaver-age through-put time for asynchronous requests. We will concentrate on these measures, since they reflect the main results of the study. Additional measures which have been evaluated do not give a more detailed understanding of the designs.
Average Lost Call Rate for Standard Calls (%)
0 5 10 15 20 25 30
normal overload staff
absence low tolerance long classification Model A Model B
Figure 2. Average Lost Call Rate for the Back Office Case
Figure 2 shows the average lost call rate for standard calls in different environmental situations. In most situa-tions the forwarding strategy for exceptional calls (Model B) improves the performance of the design and leads to fewer lost calls. Only in the overload situation both designs have similar results.
The average throughput times for asynchronous re-quests are presented in Table 3. The relief of the front office in Model B leads to worse performance values of the back office. Especially in the overload and staff absence situation there is a large difference between the two process designs.
Environmental Situation
Model A Model B Difference (A-B) normal 11,95 12,38 -0,43 overload 821,95 849,82 -27,87 staff absence 30,75 81,23 -50,48 low tolerance 11,73 12,69 -0,96 long classification 11,89 12,44 -0,55
Table 3. Average Throughput Time for Asynchronous
Requests in Minutes for the Back Office Case
In summary it may be said that the routing of excep-tional requests from the front office to the back office leads to lower lost call rates in all environmental situations. But this advantage has to be paid with a higher load for the back office which is combined with longer throughput times for asynchronous requests, especially in overload situations and during the absence of generalists in the back office.
4
THE NETWORKING CASE
4.1 Description
The second example is about networking communica-tion centers of an enterprise in the energy industry. Two communication centers A and B divide the incoming
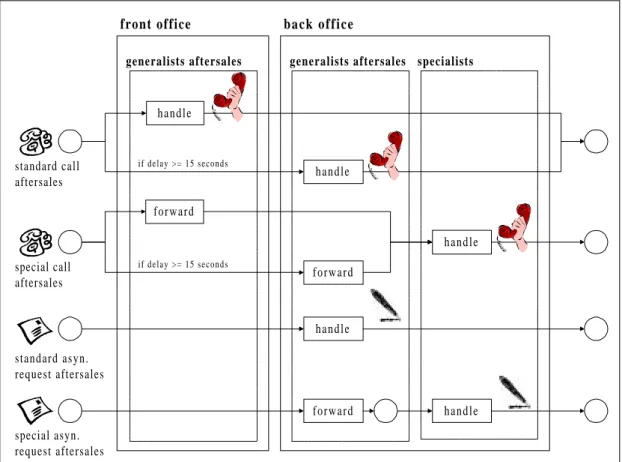
cus-tomer requests into presales and aftersales requests, which can be posted as calls, letters, faxes or e-mails. Both com-munication centers have the same internal process structure, which is shown in Figure 3 for aftersales requests. Standard and special calls are accepted either in the front office or -after a short delay of 15 seconds - in the back office. While standard calls are handled by the same agent who has ac-cepted the call, special calls are forwarded to a specialist with the required know-how. A similar procedure applies to asynchronous requests which are handled completely in the back office. This process is also valid for presales requests with one exception: A standard presales call can be routed to an aftersales generalist in the front office if no back office generalists is available. Please note that there are different groups for presales and aftersales requests but the same spe-cialist group for both request types.
The question in the networking case is, whether it is more efficient to establish an overflow strategy which allows the routing of requests between location A and B in over-load situations, or to separate both communication centers. In the tested overflow strategy every call is routed from front office A to front office B after a delay of 15 seconds and vice versa. If no free agent is found, the call is routed to back office A/B after an additional delay of 5 seconds.
handle
generalists aftersales
standard call aftersales
generalists aftersales specialists
front office back office
if delay >= 15 seconds handle standard asyn. request aftersales handle forward special call aftersales if delay >= 15 seconds forward handle
Figure 3. Process Model for Aftersales Requests in the Networking Case
handle special asyn.
request aftersales
For analyzing the networking of two communication centers, two simulation models have been built: The first model represents the separation strategy with no call routing between location A and B. The second model implements an overflow strategy between both places as described in section 4.1. Both models have been implemented with ARENA the same way as in the back office case [Kelton et al. 1998]. The initial data situation for the different request types is presented in Table 4.
Request Type Volume
calls per week Handle Time minutes After Talk Time minutes standard presales 3015 triangular (4, 4.9, 6) triangular (1, 2, 3) standard aftersales 5481 triangular (2, 2.88, 4) triangular (1, 1.9, 3) special presales 62 triangular (3, 4, 5) triangular (2, 3, 4) calls special aftersales 288 triangular (3, 4, 5) triangular (2, 3, 4) standard presales 2098 triangular (6, 7, 8) ./. standard aftersales 3933 triangular (6, 7, 8) ./. special presales 110 triangular (9, 10, 11) ./. asyn. re-quest special aftersales 205 triangular (9, 10, 11) ./.
Table 4. Simulation Data for Different Request Types in
the Networking Case
Additional simulation data are summarized in Table 5. If a standard presales call is handled by an aftersales gener-alist the handle time is multiplied by 110%. The additional settling-in period for requests of a different location is mo d-eled by a handle time multiplier of 105%.
4.2
Experimental Design
The networking strategies have been evaluated under four different environmental situations. Starting from the
normal situation, which reflects the initial data situation of
section 4.2, different simulation parameters have been modified:
• Overload: The overload situation results from an increase
of 50% of the average request volume. The volume of standard presales calls goes up to 4523 calls, for exam-ple.
• Staff absence: The situation of staff absence results in the
absence of one agent per team.
presales genera-lists front office
3 # agents
aftersales gene-ralists front office
8 # agents
presales genera-lists back office
5 # agents
aftersales genera-lists back office
9 # agents agents
specialists 2 # agents wait time until
abandonment triangular (2, 4.2, 6) minute call back % 85 % waiting tolerance
wait time until call back
triangular (1, 5, 10)
minute
special calls 20 % talk time forward
time special asyn. re-quests
10 % handle time
Table 5. Additional Simulation Data in the Networking Case
• Long queueing: In the long queueing situation the time
before routing to the next agent group is raised up to 1 minute for every queue.
The single experiments have been undertaken in the form of multiple terminating simulation runs [Kelton et al. 1998]. The planning horizon was one week with different opening hours per day. In order to obtain expressive results, we launched 100 runs for every experiment, every run repre-senting one week of operation.
Average Lost Call Rate for Standard Calls (% )
0 10 20 30 40 50 60
normal overload staff
absence
long queueing
Presales Separated Aftersales Separated Presales Networked Aftersales Networked
4.3
Results
The process performance is analyzed as in the back office case according to the average lost call rate and the average throughput time for asynchronous requests.
In the normal situation the lost call rates for presales and aftersales calls are equal (see Figure 4). However in the overload and staff absence situation, the lost call rate for aftersales requests is much higher than for presales requests while in the long queueing situation there are more lost pre-sales calls than lost afterpre-sales calls. This effects show the importance of analyzing more than one environmental situation in order to identify the strengths and weaknesses of different designs.
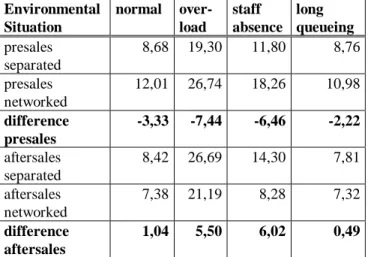
Furthermore it can be clearly seen that for aftersles calls the networking leads to aftersless lost calls than the sep a-ration strategy. Compared with this for presales calls the separation of communication centers produces the best re-sults. Therefore a trade-off between aftersales and presales calls exists. Environmental Situation normal over-load staff absence long queueing presales separated 8,68 19,30 11,80 8,76 presales networked 12,01 26,74 18,26 10,98 difference presales -3,33 -7,44 -6,46 -2,22 aftersales separated 8,42 26,69 14,30 7,81 aftersales networked 7,38 21,19 8,28 7,32 difference aftersales 1,04 5,50 6,02 0,49
Table 6. Average Throughput Time for Asynchronous
Requests in Minutes for the Networking Case
The advantage of the separation strategy for presales requests can also be identified for asynchronous requests (see Table 6). In all analyzed situations the average throughput time for presales requests is lower when the communication centers are completely separated. The oppo-site observation can be made for aftersales requests. Here the networking strategy leads to shorter throughput times.
5
CONCLUSION
In this paper we presented some ideas to make simula-tion work for the design of communicasimula-tion centers. Specific challenges of this domain have been explained and the practical experience of two case studies has been docu-mented in detail.
ACKNOWLEDGEMENTS
We acknowledge the extensive support of Marcus Grasemann from Prisma GmbH, Neu-Isenburg/Germany, during the realization of the presented case studies.
REFERENCES
[Frost and Sullivan 2000] Frost and Sullivan. 2000. “The European Web Based Call Center Market.” Report 3856. Frost and Sullivan, Frankfurt.
[Cleveland and Mayben 1997] Cleveland, B.; J. Mayben. 1997. Call Center Management On Fast Forward. Anna-polis, Maryland.
[Heinzl and Zapf 2000] Heinzl, A.; Zapf, M. 2000. “Zur Reagibilität von Call Center-Prozessen.” in: Das reagible Unternehmen, W. Dangelmaier; W. Felser, eds., Pader-born, 233-252.
[Kelton et al. 1998] Kelton, W.D.; R.P. Sadowski; D.A. Sadowski. 1998. Simulation with ARENA. Boston et al. [Law and Kelton 1991] Law, A.M.; W.D. Kelton. 1991.
Simulation Modeling & Analysis. New York et al.
[Storch 2000] Storch, K. 2000. “Simulationsgestützte Evaluation von Organisationsszenarien im Call Center.” Diploma thesis, University of Bayreuth.
[Van der Aalst 1998] Van der Aalst, W. 1998. “The Appli-cation of Petri Nets to Workflow Management.” Journal of Circuits, Systems and Computers 8, No. 1, 21-66. [Zapf 2001] Zapf, M. 2001. “Gestaltung flexibler Kun-deninteraktionsprozesse im Communication Center: Theoretische Grundlagen und experimentelle Analyse.” PhD dissertation, University of Bayreuth.
[Zapf and Heinzl 2000] Zapf, M.; Heinzl, A. 2000.
“Evaluation of Generic Process Design Patterns: An Ex-perimental Study.” in: Business Process Management, W. van der Aalst; J. Desel; A. Oberweis, eds., LNCS 1806, Springer, Berlin, 83-98.
BIOGRAPHY
Michael Zapf is research and teaching assistant at the University of Bayreuth. He works in the field of business process design and has conducted many simulation studies in cooperation with different German companies. Commu-nication centers build one focus of his work as researcher and consultant.
Katja Storch is MBA-student and has collected exten-sive practical experience in the communication center field as employee of the Hewlett Packard Call Center in Amster-dam. She wrote her diploma thesis about the evaluation of communication centers in cooperation with Prisma GmbH, Neu-Isenburg, a German consulting company for the design of communication centers.