Mini-Challenge 3
Data Descriptions for Week 1
Data Sources
The data under investigation spans a two week period. This document describes the data available for week 1. A supplementary document describes the additional data source available for week 2, as well as the information you will need to correctly interpret it.
You have four sources of data and information at your disposal in order to characterize what is happening on the network:
1. Network description. This is described below.
2. Network flow data (netflow data). This is described below.
3. Network health and status data (Big Brother data). This is described below.
4. Questions to the Big Marketing corporate office. This is described on the VAST Challenge MC3 web site.
1. Network Description
Organizationally, Big Marketing consists of three different branches, each with around 400 employees and its own web servers. The Big Marketing network diagram is shown in the “VAST Challenge 2013 Network Architecture.PDF” file. The detailed list of IPs and their mapping to hostnames is included in the file BigMktNetwork.txt.
All Big Marketing workstations and servers sit behind a firewall, including the web servers that the company operates for their clients. The customers of Big Marketing’s clients visit theses web servers regularly.
2. Network flow data.
Network flow data captures, to the extent feasible, the traffic moving across the network. Big Marketing captures network flow at the firewall, so transactions that go from Big Marketing to the internet, or come from the internet into Big Marketing, are captured.
In network flow data, a series of messages between two computers is combined into a single flow record. While each flow record includes a source and destination IP, the designation of source and destination are not guaranteed to be correct. In a situation where the flow collector did not catch the initial transaction in a flow, and sees the response as the first transaction, the destination IP may be labeled as the source IP, and vice versa.
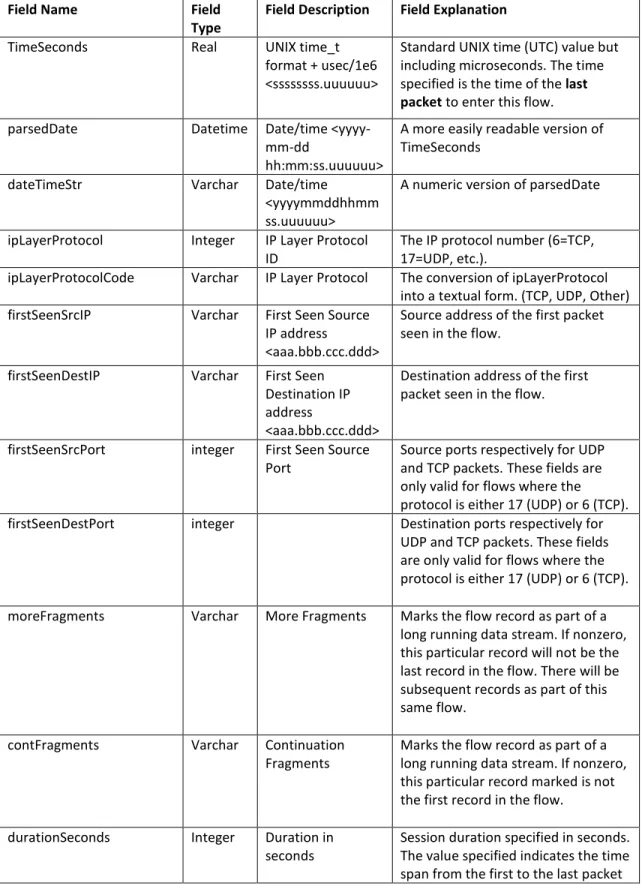
Table 1. Netflow Fields Field Name Field
Type
Field Description Field Explanation TimeSeconds Real UNIX time_t
format + usec/1e6 <ssssssss.uuuuuu>
Standard UNIX time (UTC) value but including microseconds. The time specified is the time of the last packet to enter this flow. parsedDate Datetime Date/time
<yyyy-mm-dd
hh:mm:ss.uuuuuu>
A more easily readable version of TimeSeconds
dateTimeStr Varchar Date/time <yyyymmddhhmm ss.uuuuuu>
A numeric version of parsedDate
ipLayerProtocol Integer IP Layer Protocol ID
The IP protocol number (6=TCP, 17=UDP, etc.).
ipLayerProtocolCode Varchar IP Layer Protocol The conversion of ipLayerProtocol into a textual form. (TCP, UDP, Other) firstSeenSrcIP Varchar First Seen Source
IP address
<aaa.bbb.ccc.ddd>
Source address of the first packet seen in the flow.
firstSeenDestIP Varchar First Seen Destination IP address
<aaa.bbb.ccc.ddd>
Destination address of the first packet seen in the flow.
firstSeenSrcPort integer First Seen Source Port
Source ports respectively for UDP and TCP packets. These fields are only valid for flows where the
protocol is either 17 (UDP) or 6 (TCP). firstSeenDestPort integer Destination ports respectively for
UDP and TCP packets. These fields are only valid for flows where the protocol is either 17 (UDP) or 6 (TCP).
moreFragments Varchar More Fragments Marks the flow record as part of a long running data stream. If nonzero, this particular record will not be the last record in the flow. There will be subsequent records as part of this same flow.
contFragments Varchar Continuation Fragments
Marks the flow record as part of a long running data stream. If nonzero, this particular record marked is not the first record in the flow.
durationSeconds Integer Duration in seconds
Session duration specified in seconds. The value specified indicates the time span from the first to the last packet
included in the flow.
firstSeenSrcPayloadBytes Integer First Seen Source Payload Bytes
The sum of the TCP or UDP payload bytes as reported in the TCP/IP or UDP headers, from packets with the source address equal to the first seen source address of this flow.
firstSeenDestPayloadBytes Integer First Seen Destination Payload Bytes
The sum of the TCP or UDP payload bytes as reported in the TCP/IP or UDP headers from packets with the source address equal to the first seen destination address of this flow. firstSeenSrcTotalBytes Integer First Seen Source
Total Bytes
The sum of the bytes reported by the IP header plus the number of bytes that comprise the Ethernet header from packets with the source address equal to the first seen source address of this flow.
firstSeenDestTotalBytes Integer First Seen Destination Total Bytes
The sum of the bytes reported by the IP header plus the number of bytes that comprise the Ethernet header from packets with the source address equal to the first seen destination address of this flow.
firstSeenSrcPacketCount Integer First Seen Source Packet Count
Number of packets with the source address equal to the first seen source address of this flow.
firstSeenDestPacketCount Integer First Seen
Destination Packet Count
Number of packets with the source address equal to the first seen destination address of this flow. recordForceOut Varchar Record Force-Out Indicates a record was pushed to the
data file before the timeout parameters were exceeded. Usually indicates records flushed at program shutdown.
An example of this data has been pulled into Microsoft Excel and is shown below.
3. Network health and status data.
A commercial network health monitoring program called Big Brother is installed on the network. Approximately every five minutes, each workstation and server sends a status update. The types of messages are summarized below.
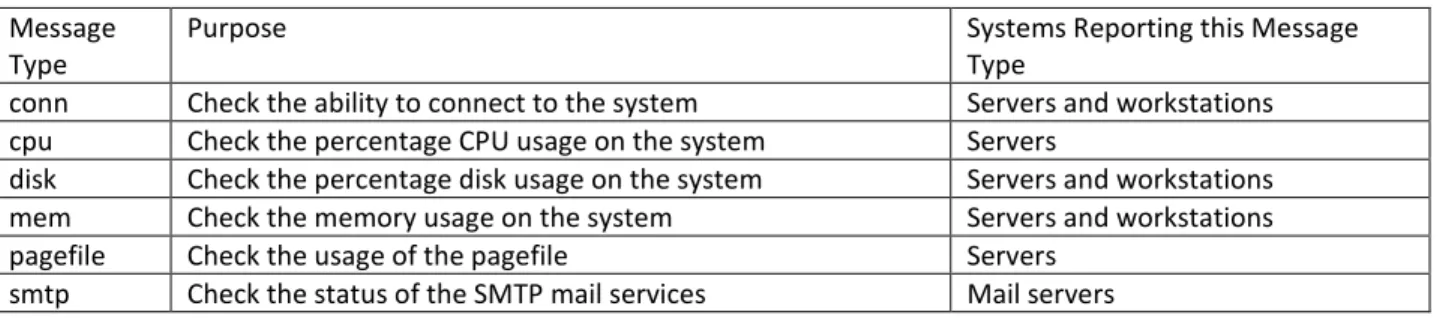
Table 2. Network Health Message Types Message
Type
Purpose Systems Reporting this Message Type
conn Check the ability to connect to the system Servers and workstations cpu Check the percentage CPU usage on the system Servers
disk Check the percentage disk usage on the system Servers and workstations mem Check the memory usage on the system Servers and workstations pagefile Check the usage of the pagefile Servers
smtp Check the status of the SMTP mail services Mail servers
This data has been parsed and reformatted in places for easier analysis. This data is described in the following table.
Table 3. Network Health and Status Data
Field Name Field Type Field Description Field Explanation
Id Int Record ID Unique identifier of the status record
Hostname Varchar Host Name Name of the computer reporting status Servicename Varchar Service Name The type of test the record pertains to Currenttime Int Current Time Standard UNIX time (UTC) value statusVal Varchar Status Value Status indicator reflecting the current
status of the reporting host name. Values: 1 (good), 2 (warning), 3 (problem), 4 (Hostname did not send status information; prior status information is reported in the record) Bbcontent Text Message content Detailed status message. The types of
information included in this field differ depending on the value of the
Servicename. Receivedfrom Varchar Received From IP
<aaa.bbb.ccc.ddd>
IP of the computer from which this status message was received. Note: this does not necessarily correspond to the IP address of the hostname. For the IP corresponding to the specific hostname, refer to
BigMktNetwork.txt. diskUsagePerc
ent
Int Disk Usage Percent Percentage of hard disk usage on the reporting computer. This field is only populated on records where
Servicename = ‘disk'. This field is parsed from the bbcontent field.
pageFileUsage Percent
Int Page File Usage Percent
Percentage of page file usage on the reporting computer. This field is only populated on records where
Servicename = ‘pagefile'. This field is parsed from the bbcontent field.
numProcs Int Number of
Processes
Number of processes running on the reporting computer. This field is only populated on records where
Servicename = ‘cpu'. This field is parsed from the bbcontent field. loadAverageP
ercent
Int Load Average Percent
Load average percent on the reporting computer. This field is only populated on records where Servicename = ‘cpu'. This field is parsed from the bbcontent field.
physicalMemo ryUsagePerce nt
Int Physical Memory Usage Percent
Physical memory usage percent on the reporting computer. This field is only populated on records where
Servicename = ‘cpu'. This field is parsed from the bbcontent field. connMade Int Connection Made An indicator of whether (1) or not (0)
the connection to the computer was successfully made. This field is only populated on records where Servicename = ‘conn'. This field is parsed from the bbcontent field. parsedDate Datetime Date/time
<yyyymmddhhmmss .uuu>
A more easily readable version of TimeSeconds
![[Re] Meta learning with differentiable closed-form solvers](data:image/gif;base64,R0lGODlhAQABAIAAAP///wAAACH5BAEAAAAALAAAAAABAAEAAAICRAEAOw==)