N AT I O N A L C E N T E R F O R P O L I C Y A N A LYS I S
Unfunded Liabilities of State and Local Government
Employee Retirement Benefit Plans
Investors breathed a tentative sigh of relief in recent months as they watched
their retirement accounts make up for lost ground. Just a few months earlier,
as they watched their 401(k)s weather dramatic stock market swings, many
may have wished they were covered by a defined benefit pension plan from
their employer (or union).
Executive Summary
Many state and local governments offer employees defined benefit pension plans, which promise a set lifetime retirement income based on wages and longevity. In contrast, income from defined contribution retirement plans — such as 401(k)s — depends on past contributions, the rate of return on those contributions and future returns. Pension plans are perceived as relatively risk-free because they are prefunded, to some degree, and their benefit payouts are not dependent on the stock market. In addition, taxpayers act as de facto insurers for government pension plans.
Many state and local government pension plans’ liabilities are calculated using discount rates that are not commensurate with the risk they may pose to taxpayers. Accounting standards allow pension funds to calculate their liabilities using a discount rate comparable to the expected rate of return on the funds’ assets. This typically high discount rate tends to reduce the size of a pension plan’s accrued liabilities. However, pensioners have a durable legal claim to receive their benefits and consequently, it is more appropriate to use a lower discount rate in calculating the plans’ accrued liabilities.
Due to the use of high discount rates, the liabilities of state and local government pension plans are underestimated. For example, recent reports by the Pew Center on the States and others indicate that assets will cover about 85 percent of the pension benefits owed to participants. But other studies that adopted lower discount rates have found liabilities may actually be 75 percent to 86 percent higher than reported. As a result, taxpayers’ role as insurer may be much greater than anticipated.
In addition to pension benefits, state and local governments often also provide other retirement benefits, especially postretirement health care benefits. These nonpension postemployment benefits include such things as health insurance, dental and vision insurance, and prescription drug plans. Unlike pension plans, most of these nonpension benefit plans are completely unfunded. That is, assets are not being set aside to fund the obligations. The Policy Report No. 329 by Courtney Collins and July 2010
Andrew J. Rettenmaier
Dallas Headquarters: 12770 Coit Road, Suite 800
Dallas, TX 75251 972.386.6272 Fax: 972.386.0924 www.ncpa.org Washington Office: 601 Pennsylvania Avenue NW,
Suite 900, South Building Washington, DC 20004
202.220.3082 Fax: 202.220.3096
ISBN #1-56808-206-1 www.ncpa.org/pub/st329.com
Unfunded Liabilities of State and Local Government Employee Retirement Benefit Plans
2
Pew Center on the States reports that nonpension benefit unfunded liabilities across all states were about $537 billion in 2008. Our estimates of the reported unfunded liabilities of state and local governments for pensions and other postemployment benefits total $1.03 trillion, but when these unfunded liabilities are recalculated using a more appropriate discount rate, the total unfunded accrued liability is much higher.
We analyzed 153 state and local pension plans, repre-senting more than 85 percent of liabilities for state and local pensions and other benefits, and recalculated their liabilities using a lower discount rate. Our calculations show:
Unfunded pension liabilities are approximately $2.5 ■
trillion, compared to the reported amount of $493 billion.
Unfunded liabilities for health and other benefits are ■
$558 billion, compared to the reported $537 billion. Thus, total unfunded liabilities for all benefit plans are an ■
estimated $3.1 trillion — nearly three times higher than the plans report.
To put these liabilities in context, state and local govern-ments’ reported unfunded obligations under pension and other benefit plans amounting to 7.1 percent of U.S. gross domestic product (GDP) in 2008. When adjusted using a more appropriate discount rate, however, states’ unfunded obligations were 22 percent of U.S. GDP. All but 10 states and the District of Columbia have total adjusted unfunded liabilities above 15 percent of their state GDP, and four states — Alaska, Hawaii, New Jersey and Ohio — have adjusted unfunded liabilities above 35 percent of their state GDP.
About the Authors
Dr. Courtney A. Collins is an assistant professor of economics at the Stetson School of
Business at Mercer University. Her fields of specialization are public economics, economics of education and applied microeconometrics. Her current research interests include state and local pension funding, class size reduction policies and student ability tracking programs. Dr. Collins previously worked as a Graduate Student Research Associate with the Private Enterprise Research Center at Texas A&M University. She has coauthored several studies with Dr. Andrew Rettenmaier examining policy issues such as public pension liabilities and Medicare spending.
Dr. Andrew J. Rettenmaier is the Executive Associate Director at the Private Enterprise
Research Center at Texas A&M University. His primary research areas are labor economics and public policy economics with an emphasis on Medicare and Social Security. Dr. Rettenmaier and the Center’s Director, Thomas R. Saving, presented their Medicare reform proposal to U.S. Sen-ate Subcommittees and to the National Bipartisan Commission on the Future of Medicare. Their proposal has also been featured in the Wall Street Journal, New England Journal of Medicine,
Houston Chronicle and Dallas Morning News.
Dr. Rettenmaier is the co-principal investigator on several research grants and also serves as the editor of the Center’s two newsletters, PERCspectives on Policy and PERCspectives. He is coauthor of a book on Medicare, The Economics of Medicare Reform (Kalamazoo, Mich.: W.E. Upjohn Institute for Employment Research, 2000) and an editor of Medicare Reform: Issues and Answers (University of Chicago Press, 1999). He is also coauthor of Diagnosis and Treatment of Medicare (Washington, D.C.: American Enterprise Institute Press, 2007). Dr. Rettenmaier is a senior fellow with the National Center for Policy Analysis.
Introduction
Investors breathed a tentative sigh of relief in recent months as they watched their retirement accounts make up for lost ground. Just a few months earlier, as they watched their 401(k)s weather dramatic stock market swings, many may have wished they were covered by a defined benefit pen-sion plan from their employer (or union). Such pension plans promise a set lifetime retirement income, based on wages and longevity with an employer, whereas the income from defined contribution plans — such as 401(k)s — depends on past contributions, the rate of return on those contributions and future returns. Pension plans are perceived as safe, but the value of the benefits they promise depends on how well they are funded and, importantly, on how well they are insured. In the case of state and local government pensions, taxpayers play the role of insurer.
Besides pensions, state and local governments often provide other retirement benefits, primarily in the form of health care coverage. These nonpension postemployment benefits include such things as health insurance, dental and vision insurance, and prescription drug plans. Some government employers also offer life insurance. But most of the costs are due to health care. Previously, government entities only reported the annual cost of retiree nonpension benefits, but in 2004 the Government Accounting Standards Board (GASB) addressed the concern that employees’ accrued benefits were reaching alarming
magnitudes but were not reported in the governments’ financial state-ments. The GASB issued statements 43 and 45 requiring state and local governments to report health care and other nonpension benefit liabili-ties, though they are not required to prefund them.
Unlike the pension plans, health care and other benefits are almost entirely unfunded. That is, assets are not being set aside to fund the obligations. Recent estimates indicate that reported liabilities for health care and other benefits across all states are over $500 billion — an amount that rivals the reported un-funded obligations of pension plans.
Recent Estimates
of State and Local
Government Pension and
Other Postemployment
Benefit Liabilities
The GASB allows government pension plans to use the expected rate of return on their assets to discount their accrued liabilities. Several recent studies have raised concerns about the use of these discount rates because they are typically high and may not reflect the risks of the liabilities beingcalculated. A discount rate is used to determine the current value of future obligations. A high discount rate tends to reduce the size of a pension plan’s accrued liabilities. Recent reports by state and local government pension plans indicate that their assets will cover about 85 percent of the accrued pension benefits owed to participants. However, using lower discount rates, which are more appropri-ate given the nature of pension liabilities, recent studies estimate that liabilities are 75 percent to 85 percent higher than reported. Consequently, the ratio of assets to accrued benefit payouts is 37 percent to 45 percent, rather than 85 percent. Thus, the recognized role of taxpayers as insurers is much larger under alternative estimates.
Pew Center Estimates. In
February 2010, the Pew Center on the States published “The Trillion Dollar Gap,” a report detailing unfunded pension and other postemployment benefit obliga-tions by state. The study provides aggregate state-level data from 231 pension plans and 159 health care and other benefit plans. In addition to measuring the liabilities, it reports the extent to which each state is meeting its required annual funding for the plans.
According to the Pew study, there is a “trillion dollar gap” in funding state and local government employee retirement benefits:
In 2008, total pension liabilities ■
amounted to about $2.77 trillion and reported assets were approxi-mately $2.31 trillion; thus, 84 percent of pension liabilities are
Insert callout here.
“Plans’ unfunded liabilities
are larger than reported.”
Unfunded Liabilities of State and Local Government Employee Retirement Benefit Plans
4
funded, leaving unfunded liabili-ties of $452 billion.
In contrast, total liabilities for ■
retiree health and other benefits were $587 billion, but assets only amounted to $32 billion; thus, 5 percent of health benefits are funded, leaving unfunded liabili-ties of $555 billion.1
Thus, total accrued retiree pen-■
sion and nonpension benefits across the states total $3.35 tril-lion but only $2.35 triltril-lion in as-sets have been set aside.
Public Fund Survey for Fiscal Year 2008. The Public Fund Survey
from the National Association of State Retirement Administrators re-ports assets, liabilities and unfunded liabilities for 125 of the largest state
and local pension plans. In 2008, these plans accounted for about 85 percent of all plan participants and assets. The survey reported total assets were about $2.58 trillion and total liabilities were about $3.02 trillion, for a funding ratio of 85 percent. The unfunded liability was $442 billion.2 These amounts
are similar in magnitude to those reported in the Pew study, with the discrepancies due to different reporting dates and plans surveyed.
Alternative Estimates of State and Local Pension Liabilities.
How risky are accrued pension liabilities? Can state and local governments default on their ac-crued pension obligations? These questions are separate from whether state and local governments can change future accruals for current
participants or the benefit formula for future plan participants. Jeffrey Brown and David Wilcox note that state and local pensioners enjoy substantial legal standing, making the receipt of benefits almost risk free.3 Thus, from the perspective of
taxpayers, the appropriate discount rate is the government borrowing rate. This rate matches the risk to the taxpayers of the underlying accrued pension liability.
Robert Novy-Marx and Joshua Rauh recently estimated the pension liabilities for 116 state-level pension plans using two alternative discount rate series.4 The plans reported
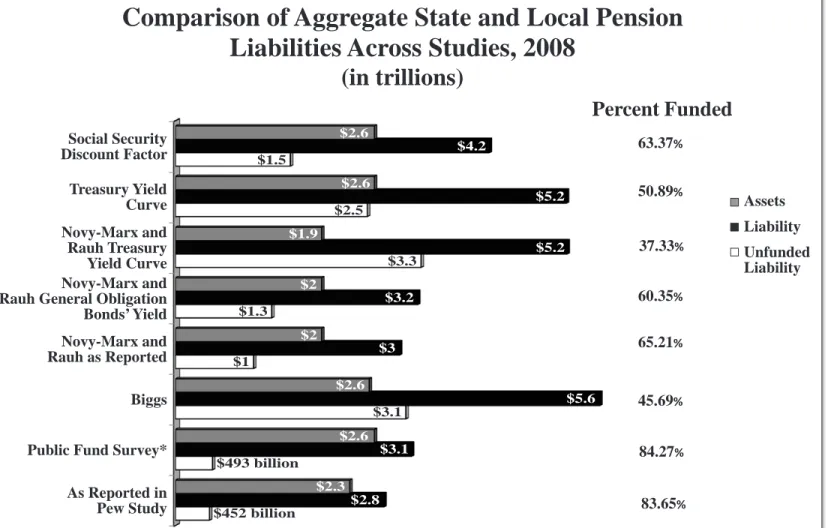
aggregate pension liabilities of $2.98 trillion. Novy-Marx and Rauh estimated the plans’ total assets are $1.94 trillion, producing a funding ratio of 65 percent. However, they recalculated the liabilities using discount rates based on the interest rates state governments pay on their own bonds and based on the term structure of U.S. Treasury securities. When recalculated using state-specific discount rates, the pension liabilities increase 7.7 percent to $3.21 trillion, meaning there are $1.27 trillion in unfunded liabilities. When recalculated using discount factors derived from the U.S. Treasury securities’ yield curve, the aggregate liabilities rise almost 75 percent to $5.2 trillion, and the funding ratio drops to only 37 percent.5 The unfunded liabilities
using this discount factor increase to $3.3 trillion.
Andrew Biggs also recalculated government pension plans’ liabili-ties but used a different method.6
He first estimated the likelihood that individual pension plans’ assets
FIGURE I
Age Composition of Accrued Social Security
Liabilities Over Time
(as percentages of gross domestic product)
Source: Authors’ calculations based on 2008 Social Security Trustees Report.
Percent Age Group (years)
0 0.5 1 1.5 2 2.5 3 3.5 4 4.5 5 2008 2018 2028 2038 2048 2058 2068 2078 2088 23–24 25–34 35–44 45–54 55–64 65+
trillion, resulting in a funding ratio of 45 percent.8 Unfunded liabilities
equal about $3.1 trillion under Biggs’ calculations.
New Estimates of State
and Local Pension Plan
Liabilities
We analyzed a total of 153 plans, including the 125 plans examined in the 2008 Public Fund Survey.9
will cover accrued benefits and found that the typical plan has a 16 percent probability of covering expected payouts. Likening the implied pension guarantees to a put option — the right of a holder to sell a certain amount of stock — he recalculated the liabilities using an option pricing method.7 Using this
method, and a nominal discount rate of 3.6 percent, he found that liabilities rise to an estimated $5.6
Based on the plans’ data, their total pension liabilities are $3.1 trillion and total pension assets are $2.6 trillion, for a funding ratio of 84 percent. Their unfunded liabilities are about $493 billion. Using other discount rates to calculate the liabilities requires estimating the future annual accrued benefit payments for each plan.
The reported liabilities for each plan can be thought of as the
pres-FIGURE II
Comparison of Aggregate State and Local Pension
Liabilities Across Studies, 2008
(in trillions)
Sources: Pew Center on the States, “The Trillion Dollar Gap: Underfunded States Retirement Systems and the Roads to Reform,” February 2010. Available at http://downloads.pewcenteronthestates.org/The_Trillion_Dollar_Gap_final.pdf. Keith Brainard, “Public Fund Survey: Summary of Findings for FY 2008,” National Association of State Retirement Administrators, October 2009. Available at http://www.publicfundsurvey.org/publicfundsurvey/pdfs/ Summary_of_Findings_FY08.pdf. Andrew G. Biggs, “An Options Pricing Method for Calculating the Market Price of Public Sector Pension Liabilities,” American Enterprise Institute, Working Paper No. 164, February 26, 2010. Robert Novy-Marx and Joshua D. Rauh, “Public Pension Promises: How Big Are They and What Are They Worth?” Working Paper, December 2009. And authors’ calculations.
* The Public Fund Survey set of pension plans has been updated and ammended. Social Security Discount Factor Treasury Yield Curve Novy-Marx and Rauh Treasury Yield Curve Novy-Marx and Rauh General Obligation
Bonds’ Yield Novy-Marx and Rauh as Reported Biggs
Public Fund Survey* As Reported in
Pew Study Unfunded Liability Assets
As Reporte 452.195 2765.751 2313.555 Public Fund 492.66 3132.135 2639.475 Biggs 3058.072 5630.458 2572.386 Novy-Marx 1038 2975.1 1940 Novy-Marx 1278 3214.7 1940 Novy-Marx 3260 5196.9 1940 Treasury Yi 2547.373 5186.848 2639.475 Social Secu 1525.846 4165.321 2639.475
As Reported in Pew Study Public Fund Survey* Biggs Novy-Marx and Rauh as Reported Novy-Marx and Rauh General Obligation Bonds' Yield Novy-Marx and Rauh Treasury Yield Curve Treasury Yield Curve Social Security Discount Factor
Assets Liability Unfunded Liability
Percent Funded
63.37% 50.89% 37.33% 60.35% 65.21% 45.69% 84.27% 83.65% Assets Liability Unfunded Liability $2.6 $4.2 $1.5 $2.5 $2.6 $5.2 $3.3 $1.9 $5.2 $2 $2 $3.2 $1.3 $3 $1 $2.6 $5.6 $3.1 $2.6 $3.1 $493 billion $452 billion $2.3 $2.8Unfunded Liabilities of State and Local Government Employee Retirement Benefit Plans
6
ent value of future annual benefit payments based on accrued benefits as of 2008. The studies mentioned previously also estimated future annual benefit streams for each of the plans they consider. For example, to generate plan-specific future accrued benefit series, Novy-Marx and Rauh collected data on the plans’ benefit formulas, composition of participants
(including wages, ages and years
of service), mortality and job tenure assumptions, cost of living assumptions and salary growth. They used these data to produce a stream of annual benefits calibrated to yield the reported liability using the reported discount rate assump-tion.10 They then discounted the
plan-specific benefit series using their two discount rate assumptions.
For our estimates, we identified an annual benefit payment series
for each pension plan using an estimate of the plan’s initial benefit payments in 2008, actuarial liability and investment return combined with estimates of annual accrued Social Security benefits by age group.11 The time path of annual
accrued Social Security benefits are used as an initial proxy for the time path of workers’ accrued pension benefits in the government plans. Ultimately we derived a time
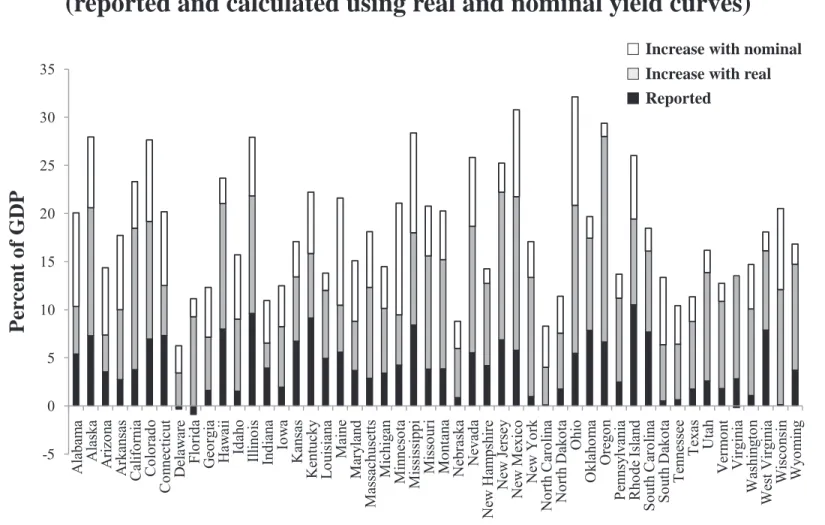
FIGURE III
Unfunded Pension Liabilities as a
Percentage of State GDP in 2008
(reported and calculated using real and nominal yield curves)
Sources: Keith Brainard, “Public Fund Survey: Summary of Findings for FY 2008,” National Association of State Retirement Administrators, October 2009. Available at http://www.publicfundsurvey.org/publicfundsurvey/pdfs/Summary_of_Findings_FY08.pdf. And authors’ adjustments and calculations. state_nam Reported Increase w Increase with Nominal
Alabama 5.390474 4.949226 9.72603 Alaska 7.315658 13.28964 7.33537 Arizona 3.549272 3.814306 6.992552 Arkansas 2.737692 7.264348 7.72641 California 3.785825 14.67675 4.85133 Colorado 6.975103 12.19051 8.48327 Connecticu 7.335989 5.181481 7.64797 Delaware -0.32686 3.434408 2.827035 Florida -0.89143 9.27227 1.880323 Georgia 1.619838 5.52272 5.171852 Hawaii 7.998454 13.05278 2.6221 Idaho 1.535253 7.472676 6.696721 Illinois 9.636061 12.20654 6.07444 Indiana 3.939057 2.606282 4.418131 Iowa 1.963931 6.261276 4.263313 Kansas 6.745784 6.678546 3.64566 Kentucky 9.135189 6.706381 6.37592 Louisiana 4.940071 7.069419 1.78811 Maine 5.596974 4.875576 11.12195 Maryland 3.69306 5.114758 6.292712 Massachus 2.874559 9.457461 5.77946 Michigan 3.424127 6.718693 4.34257 Minnesota 4.2582 5.211012 11.59669 Mississippi 8.411207 9.582593 10.37718 Missouri 3.820651 11.77611 5.18058 Montana 3.876002 11.32845 5.05889 Nebraska 0.866568 5.105586 2.83178 Nevada 5.530803 13.14077 7.16708 New Hamp 4.198453 8.533227 1.52573 New Jersey 6.891836 15.33841 2.99768 New Mexic 5.781821 15.97575 9.01303 New York 0.977499 12.38823 3.71174 North Caro 0.127585 3.877663 4.293815 North Dako 1.758844 5.803908 3.838968 Ohio 5.470817 15.37602 11.27105 Oklahoma 7.847467 9.584463 2.2378 Oregon 6.64647 21.35799 1.37564 Pennsylvan 2.480476 8.718424 2.47985 Rhode Islan 10.52777 8.90943 6.58457 South Caro 7.707108 8.402662 2.36988 South Dako 0.520847 5.85524 6.975243 Tennessee 0.635712 5.79078 3.996228 Texas 1.75154 7.019576 2.558614 Utah 2.614213 11.25812 2.30241 Vermont 1.833999 9.020821 1.87346 Virginia 2.834671 10.71545 -0.14355 Washingto 1.091493 9.002277 4.6155 West Virgin 7.894693 8.221237 1.96584 Wisconsin 0.133303 11.95611 8.42808 Wyoming 3.727689 11.01101 2.08046 -5 0 5 10 15 20 25 30 35 A la ba m a A la sk a A riz on a A rk an sa s Ca lifo rn ia Co lo ra do Co nn ec tic ut D el aw are Fl ori da G eo rg ia H aw ai i Id ah o Ill in oi s In di an a Io w a K an sa s K en tu ck y Lo ui sia na M ai ne M ary la n d M as sa ch us et ts M ic hi ga n M in ne so ta M iss iss ip pi M iss ou ri M o n ta n a N eb ra sk a N ev ad a N ew H am ps hi re N ew Je rs ey N ew M ex ic o N ew Y ork N ort h Ca ro lin a N ort h D ak ot a O hi o O kl ah om a O re go n Pe nn sy lv an ia Rh od e Is la nd So ut h Ca ro lin a So ut h D ak ot a Te nn es se e Te xa s U ta h V erm o n t V irg in ia W as hi ng to n W es t V irg in ia W isc on sin W yo m in g
P
er
ce
n
t
o
f
G
D
P
Increase with Nominal Increase with Real Reported
Increase with nominal Increase with real Reported
two nominal series are considered first for comparability with other estimates. The first series is the discount rate series from Table VI. F6 in the 2008 Social Security Trustees Report. This series is based on the Trustees’ ultimate real
discount rate assumption of 2.9 percent and the ultimate inflation rate assumption of 2.8 percent per year. The other discount factor series follows Novy-Marx and Rauh’s use of the term structure of the nominal yields on U.S. Treasury securities. Our term structure is based on monthly averages from July 2004 to August 2008.14
Figure II compares our aggregate estimates of the pension funds’ li-abilities to the estimates in the other to nominal dollars) to produce an
index that begins at one in 2008. Each plan’s initial benefit payments were then indexed for future years. The age composition was varied for each plan until the present value of the indexed series calculated using the reported investment rate of return equaled the reported pension liability.13 The final series
for each pension plan was then used to recalculate the liability with alternative discount rates.
Using the Appropriate Discount Rate. The appropriate discount
rate depends on the nature of the liability. We recalculated the liabilities using four discount rate series: two nominal rates and two real (inflation-adjusted) rates. The series of annual benefit payments
that results in the reported liability when discounted at the reported rate of return on investments.
Figure I presents the age composition of accrued Social Security benefits based on the 2008 Trustees Report — the same year as the Public Fund Survey data.12 The
figure shows the age composition of the Social Security benefits that workers accrued as of 2008 and the payout of those benefits over time. It assumes there is no change in law affecting the level of benefits and it does not include additional benefits accruals. For each pension plan we varied the age composition of the accrued Social Security benefits series(converted
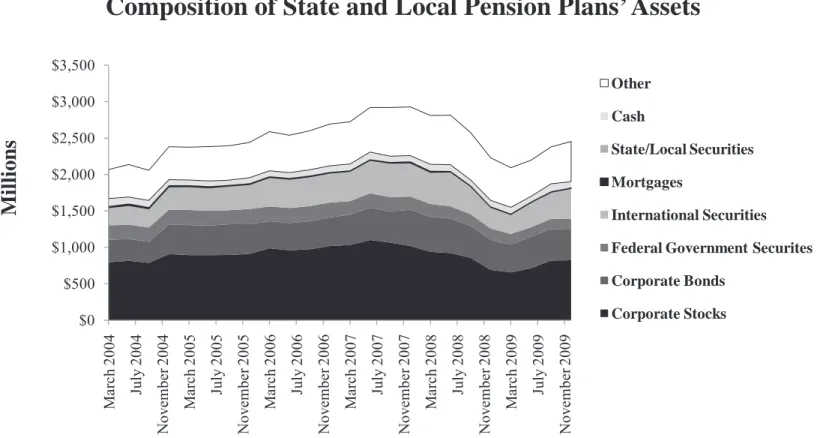
FIGURE IV
Composition of State and Local Pension Plans’ Assets
Source: U.S. Census Bureau, Government Division Finances of Selected State and Local Government Employee Retirement Systems, Table 1. Date Corporate Corporate Federal GoInternation Mortgages State/Loca Cash Other
31-Mar-04 796 308 199 243 19 1 103 398 30-Jun-04 816 299 196 266 24 1 89 446 30-Sep-04 788 289 197 258 21 0 92 413 31-Dec-04 908 408 200 316 21 0 76 452 31-Mar-05 894 412 208 321 18 1 71 450 30-Jun-05 894 405 203 318 19 1 72 471 30-Sep-05 896 422 194 332 13 2 65 472 31-Dec-05 912 407 208 337 14 2 76 483 31-Mar-06 988 371 203 400 14 2 74 537 30-Jun-06 961 373 207 397 13 2 73 513 30-Sep-06 975 385 207 403 14 2 78 535 31-Dec-06 1,019 392 206 406 12 2 85 572 31-Mar-07 1,033 417 184 411 11 2 86 579 30-Jun-07 1,102 442 200 453 12 2 98 612 30-Sep-07 1,066 427 197 467 13 2 80 667 31-Dec-07 1,019 498 181 464 18 2 78 669 31-Mar-08 939 480 177 437 17 2 88 671 30-Jun-08 922 472 170 472 12 1 85 681 30-Sep-08 857 439 160 384 11 2 72 650 31-Dec-08 691 413 155 293 10 2 82 584 31-Mar-09 657 380 148 269 10 2 85 544 30-Jun-09 713 434 129 341 9 3 71 497 30-Sep-09 820 433 140 365 10 3 103 506 31-Dec-09 824 420 147 421 9 2 79 551 $0 $500 $1,000 $1,500 $2,000 $2,500 $3,000 $3,500 M arc h 20 04 Ju ly 2 00 4 N ov em be r 2 00 4 M arc h 20 05 Ju ly 2 00 5 N ov em be r 2 00 5 M arc h 20 06 Ju ly 2 00 6 N ov em be r 2 00 6 M arc h 20 07 Ju ly 2 00 7 N ov em be r 2 00 7 M arc h 20 08 Ju ly 2 00 8 N ov em be r 2 00 8 M arc h 20 09 Ju ly 2 00 9 N ov em be r 2 00 9
Mi
ll
io
n
s
Other Cash State/Local Securities Mortgages International Securities Federal Government Securites Corporate BondsUnfunded Liabilities of State and Local Government Employee Retirement Benefit Plans
8
studies, including the Pew study and the Public Fund Survey. Our estimate of the total liability based on the nominal Social Security discount factor is $4.2 trillion, with a net unfunded liability of $1.5 tril-lion. The funding ratio of assets to liabilities is 63 percent. Recall that the liabilities were recalculated for the plans in the Public Fund Survey, for which the reported aggregate liability was $3.1 trillion. Thus the lower nominal discount rate of ap-proximately 5.8 percent (compared to the modal, or most frequent,
discount rate of 8 percent) produces a liability that is a third larger.
Using the discount factor based on the yield curve, our estimate of the total liability is $5.2 trillion, or 66 percent larger than the actu-arial estimates in the plans’ annual reports. The net unfunded liability is $2.5 trillion. This increase in the total liability relative to the reported liability is in the range of the in-crease estimated by Novy-Marx and Rauh (75 percent increase using the yield curve) and Biggs (86 percent
increase using the option pricing method and a nominal discount rate of 3.6 percent).
We also estimated the liabilities using real (inflation-adjusted) discount rates and real estimates of future pension payments. The use of real discount rates is based on the observation that the discount rates used by the individual pen-sion plans assume higher inflation rates than the Social Security Trustees assume. The nominal discount rates in our previous
FIGURE V
Unfunded Other Postemployment Benefit Liabilities
as a Percent of State GDP
* Plans using discount rates of 7 percent or higher were recalculated using discount factor based on the nominal Treasury yield curve. ** Nebraska does not report other postemployment benefit liabilities.
Sources: States’ and plans’ comprehensive annual financial reports for reported unfunded liabilities and authors’ recalculation of liabilities for the subset of plans with reported discount rates of 7 percent or higher.
fips_state_As ReporteWith Adjustment*
Alabama 9.146306 0 Alaska 11.45433 2.75997 Arizona 0.359198 0.352459 Arkansas 1.778686 0 California 3.289875 0 Colorado 0.558722 0.268047 Connecticu 12.03614 0 Delaware 8.750081 0 Florida 0.323066 0 Georgia 4.60609 0.103384 Hawaii 13.76572 0 Idaho 0.928963 0 Illinois 6.303644 0 Indiana 0.173428 0 Iowa 0.298448 0 Kansas 0.258288 0 Kentucky 7.453527 6.264113 Louisiana 5.644457 0 Maine 4.594741 0.079589 Maryland 5.390129 0 Massachus 0.003014 0 Michigan 10.43592 0 Minnesota 0.384634 0 Mississippi 0.621037 0 Missouri 1.199342 0.181445 Montana 1.760887 0 Nebraska* 0 0 Nevada 1.68479 0 New Hamp 4.264645 0 New Jersey 10.66459 0 New Mexic 3.687063 0 New York 4.440353 0 North Caro 7.182053 0.03313 North Dako 0.16342 0.0919 Ohio 5.335434 0 Oklahoma 0.245821 0 Oregon 0.377538 0.095802 Pennsylvan 2.938907 0 Rhode Islan 1.665822 0 South Caro 5.523583 0.032663 South Dako 0.205633 0 Tennessee 0.692508 0 Texas 3.982964 0.476528 Utah 0.610328 0 Vermont 6.347771 0 Virginia 0.916567 0.404306 Washingto 2.449052 0 West Virgin 9.907221 0 Wisconsin 0.711229 0.017799 Wyoming 0.492778 0 0 2 4 6 8 10 12 14 16 A la ba m a A la sk a A riz on a A rk an sa s Ca lifo rn ia Co lo ra do Co nn ec tic ut D el aw are Fl ori da G eo rg ia H aw ai i Id ah o Ill in oi s In di an a Io w a K an sa s K en tu ck y Lo ui sia na M ai ne M ary la n d M as sa ch us et ts M ic hi ga n M in ne so ta M iss iss ip pi M iss ou ri M o n ta n a N eb ra sk a* * N ev ad a N ew H am ps hi re N ew Je rs ey N ew M ex ic o N ew Y ork N ort h Ca ro lin a N ort h D ak ot a O hi o O kl ah om a O re go n Pe nn sy lv an ia Rh od e Is la nd So ut h Ca ro lin a So ut h D ak ot a Te nn es se e Te xa s U ta h V erm o n t V irg in ia W as hi ng to n W es t V irg in ia W isc on sin W yo m in g
P
er
ce
n
t
o
f
G
D
P
With Adjustment* As Reportedbenefits, it is important to recognize how the stock market decline since 2008 affects pensions’ unfunded liabilities. The liabilities, assets and the resulting unfunded liabilities are based on 2008 estimates, with most estimated by June 2008. The dramatic drop in the stock market during the latter part of 2008 that continued through the beginning of 2009 increases the unfunded liabilities reported for 2009. Figure IV depicts Census Bureau data on the aggregate assets in state and local retirement plans:
Total assets in June 2008 were ■
$2.8 trillion, but fell 25 percent to $2.1 trillion by March 2009. By June 2009 total assets in-■
creased back to $2.2 trillion, or a 22 percent decline over the year. If the 22 percent decline in aggre-■
gate assets were recognized for 2009 the reported funding ratio would decline from 85 percent to 65 percent, assuming no change in the liabilities.
When the liabilities are calcu-lated using the nominal Treasury yield, the funding ratio in 2008 was 65 percent. If the decline for 2009 is recognized, then the funding level declines to 40 percent. Finally, the figure indicates that total pension assets rose to about $2.5 trillion by December 2009, or about 13 percent below the June 2008 level.
New Estimates of
Nonpension
Postemployment Benefit
Liabilities
In 2004, the GASB issued two statements addressing the concern unfunded pension liabilities and
each state’s gross domestic product (GDP) in 2008. The unfunded liabilities by state are the sums across all plans in the state from the updated Public Fund Survey.15
The three unfunded liabilities are the reported unfunded actuarial accrued liability, the unfunded liability based on the yield curve derived from the Treasury
Inflation-Protected Securities and the unfunded liability based on the nominal yield curve. The last estimate is most comparable to the estimates by Novy-Marx and Rauh and Biggs, and is reflected by the total height of each bar.
Reporting the estimates based on the real discount factors paired with the real accrued benefit series along with the estimates based on the nominal discount factors paired with the nominal accrued benefits series shows how the alternative inflation rate expectations affect the calculation. The states with the top five unfunded liabilities by this measure are Ohio, New Mexico, Oregon, Mississippi and Alaska. Ohio, New Mexico and Mississippi were also in the top five states by this metric in Novy-Marx and Rauh and Biggs. However, when ranked by the reported unfunded liability as a percent of GDP only Mississippi appears in the top five in all four lists. This illustrates the sensitivity of the outcomes to alternative discount rate assumptions, and therefore the importance of providing a variety of estimates in public reports.
Effect of the Stock Market Decline on Unfunded Liabilities.
Before turning to the nonpension estimate were also higher than the
implied inflation rate based on a comparison of the nominal Treasury yields and the yields on Treasury Inflation-Protected Securities. The most frequent nominal discount rate among the pension plans is 8 percent and the most frequent inflation assumption is 3.5 percent. Thus, the most frequent real rate of return is in the range of 4.5 percent.
However, the nominal Treasury yields relative to the yields on Trea-sury Inflation-Protected Securities indicate that the implied real inter-est rate for the period from 2004 to 2008 was less than 2 percent, and the anticipated inflation rate was about 2.35 percent. Because the inflation rate anticipated by the pension plans is higher than the rate implied by the relative yields on the Treasury Inflation-Protected Securi-ties, the nominal Treasuries and the inflation rate assumed by the Trustees, the recalculated liabilities are higher than they would be if the inflation estimates were the same.
The recalculated aggregate pension liability based on the real Social Security discount factor is $3.9 trillion; it is $4.5 trillion based on the yield curve from the Trea-sury Inflation-Protected Securities. While not as high as the liabilities using the nominal returns, these two estimates indicate that the unfunded liability is $1.2 trillion (based on the real Social Security discount factor) to $1.9 trillion (based on the Trea-sury Inflation-Protected Securities yield curve), or more than 2.5 times the reported aggregate unfunded liability of $493 billion.
Figure III depicts the relation-ship between three measures of
Unfunded Liabilities of State and Local Government Employee Retirement Benefit Plans
10
that government obligations for retiree health benefits and other postemployment benefits were large and, for the most part, unfunded.
Reporting requirements for gov-ernment pension plans have existed since 1994, but until 2004 there were no comparable standards for reporting funding for other retiree benefits. Because most govern-mental entities report only annual cash outlays for these benefits, the full cost was substantially underre-ported. The new GASB statements provide guidelines for determining governments’ full obligations and
calculating the necessary annual contributions to ensure that the promised funds will be available for retirees in the future.16
The GASB now requires govern-ments to report several different values, including the actuarial accrued liability, the actuarial value of assets, the unfunded actuarial ac-crued liability, the annual required contribution and the net obligation. Governments may choose among six different actuarial methods to calculate these values, but must report the method used and any other actuarial assumptions.
Gov-ernments must publish a schedule of funding progress and a schedule of employer contributions in an annual report. These new requirements provide a more complete picture of the full magnitude of nonpension benefit obligations, and allow for comparisons across state and local governments.17
Estimated Liabilities for
Retiree Health Benefits and Other Retiree Benefits. The Pew Center study identified $587 billion in total retiree nonpension benefit liabilities and $555 billion in unfunded li-abilities, given that only $32 billion
FIGURE VI
Unfunded Pension and Other Postemployment Benefits
Liabilities as Percent of State GDP
(as reported)
Sources: Pensions are from Keith Brainard, “Public Fund Survey: Summary of Findings for FY 2008,” National Association of State Retirement Administra-tors, October 2009. Available at http://www.publicfundsurvey.org/publicfundsurvey/pdfs/Summary_of_Findings_FY08.pdf. And authors’ adjustments. Other postemployment benfits are from states’ and plans’ comprehensive annual financial reports.
fips_state_Pensions Other Postemployment Benefits Alabama 5.390474 9.146306 Alaska 7.315658 11.45433 Arizona 3.549272 0.359198 Arkansas 2.737692 1.778686 California 3.785825 3.289875 Colorado 6.975103 0.558722 Connecticu 7.335989 12.03614 Delaware -0.32686 8.750081 Florida -0.89143 0.323066 Georgia 1.619838 4.60609 Hawaii 7.998454 13.76572 Idaho 1.535253 0.928963 Illinois 9.636061 6.303644 Indiana 3.939057 0.173428 Iowa 1.963931 0.298448 Kansas 6.745784 0.258288 Kentucky 9.135189 7.453527 Louisiana 4.940071 5.644457 Maine 5.596974 4.594741 Maryland 3.69306 5.390129 Massachus 2.874559 0.003014 Michigan 3.424127 10.43592 Minnesota 4.2582 0.384634 Mississippi 8.411207 0.621037 Missouri 3.820651 1.199342 Montana 3.876002 1.760887 Nebraska 0.866568 0 Nevada 5.530803 1.68479 New Hamp 4.198453 4.264645 New Jersey 6.891836 10.66459 New Mexic 5.781821 3.687063 New York 0.977499 4.440353 North Caro 0.127585 7.182053 North Dako 1.758844 0.16342 Ohio 5.470817 5.335434 Oklahoma 7.847467 0.245821 Oregon 6.64647 0.377538 Pennsylvan 2.480476 2.938907 Rhode Islan 10.52777 1.665822 South Caro 7.707108 5.523583 South Dako 0.520847 0.205633 Tennessee 0.635712 0.692508 Texas 1.75154 3.982964 Utah 2.614213 0.610328 Vermont 1.833999 6.347771 Virginia 2.834671 0.916567 Washingto 1.091493 2.449052 West Virgin 7.894693 9.907221 Wisconsin 0.133303 0.711229 Wyoming 3.727689 0.492778 -5 0 5 10 15 20 25 A la ba m a A la sk a A riz on a A rk an sa s Ca lifo rn ia Co lo ra do Co nn ec tic ut D el aw are Fl ori da G eo rg ia H aw ai i Id ah o Ill in oi s In di an a Io w a K an sa s K en tu ck y Lo ui sia na M ai ne M ary la n d M as sa ch us et ts M ic hi ga n M in ne so ta M iss iss ip pi M iss ou ri M o n ta n a N eb ra sk a N ev ad a N ew H am ps hi re N ew Je rs ey N ew M ex ic o N ew Y ork N ort h Ca ro lin a N ort h D ak ot a O hi o O kl ah om a O re go n Pe nn sy lv an ia Rh od e Is la nd So ut h Ca ro lin a So ut h D ak ot a Te nn es se e Te xa s U ta h V erm o n t V irg in ia W as hi ng to n W es t V irg in ia W isc on sin W yo m in g
P
er
ce
n
t
o
f
G
D
P
Other Postemployment Benefits Pensions
future liabilities at a higher rate results in a smaller present value estimate, as seen in the case of pension fund accounting. The GASB provides guidelines for the selection of a discount rate which reflects the assumed rate of return on investments. The choice of rates is largely determined by the way in which the plan is funded. Most retiree health plans are funded on a pay-as-you-go basis, meaning there is no trust accruing assets to fund future benefits. These plans must use a much lower discount rate — usually 4 percent or 4.5 percent — than plans that are prefunded. Prefunded plans with dedicated trusts for future payments may use a higher rate equal to the return on those investments. Discount rates associated with prefunded plans are typically around 8 percent. As noted, state and local pension plans, all of which have related trust funds, are usually discounted at the higher rate of about 8 percent.
The difference in the overall estimated liability when using the low rate versus the high rate is substantial. For example, consider the state of New Hampshire, which reports its total liabilities for retiree health care benefits under a variety of different assumptions. The net actuarial accrued liability using a prefunded plan with an 8.5 percent discount rate is $1.33 billion. The comparable liability associated with a pay-as-you-go plan and 4.5 per-cent discount rate is $2.56 billion, almost twice the original amount.19
Similarly, the reported unfunded liability for the Teachers Retirement System of Texas is $21.6 billion based on the current discount rate in assets are set aside. In addition
to nationwide aggregates, the study gives funding levels by state. This provides the opportunity for cross-state comparisons to deter-mine which states’ programs are particularly well-funded and which states have the greatest unfunded obligations. The Pew study shows that 20 states’ health benefits are completely unfunded. Most of the remaining states’ funding levels range from 0.01 percent to 50 percent. Only two states — Alaska and Arizona — have funding ratios above 50 percent.
The Pew study provides a comprehensive view of funding at the state level; however, it would also be useful to examine funding at a more disaggregated level. Most states’ totals are aggregated from several different reporting sources. For example, a single state might have different plans for teachers, judges, state police and other state employees. The state would report liabilities and costs for each of the plans.
Individual reports were obtained for all of the available plans listed in the Pew study and liabilities were documented for each of these groups, as well as state totals. In most cases, state totals match closely with the Pew numbers.18
What Discount Rate Should Be Used to Calculate Retiree Health Benefit Liabilities? As we have seen, a key variable in assessing the present value of actuarial liability is the discount rate. The choice of the discount rate significantly influences the size of the overall liability. All else equal, discounting
of 5.25 percent, but is only $14.2 billion (or 34 percent lower) when an 8 percent rate is applied.20
As discussed, there has been a good deal of debate among experts regarding the proper discount rate in determining accrued pension liabilities. The rationale for using a lower discount rate more in line with the government borrowing rate to calculate pension liabilities is that those liabilities are legally binding. Retirees may not have as durable a claim to health benefits, but those benefits pose extra risks to taxpay-ers in the form of greater uncer-tainty about the size of future health care costs. This uncertainty suggests that a lower rate is also appropri-ate in calculating retiree health benefits, which is consistent with the prevalent use of the 4 percent and 4.5 percent nominal discount rates for the pay-as-you go plans.
If actuaries used a lower discount rate for all plans, regardless of fund-ing method, the liabilities for health benefits that are partially prefunded would be much larger than current estimates. However, since the majority of health benefit plans are funded on a pay-as-you-go-basis, the change in discount rates to match the government borrowing rate makes a much smaller impact on the total liability than for pen-sion plans.
Only 22 percent of the health and other benefit plans use a discount rate of 7 percent or higher. The liabilities for this set of plans were recalculated using a procedure similar to the one described earlier for pension plans.21 Health benefit
unfunded liabilities based on the nominal Treasury yield curve are
Unfunded Liabilities of State and Local Government Employee Retirement Benefit Plans
12
$558 billion, compared to reported health benefit unfunded liabilities of $537 billion. Figure V illustrates how these unfunded liabilities, as a percentage of state GDP, would change if the discount factor based on the nominal Treasury yield curve were used for those plans.22
Notably:
Half of the states have reported ■
health benefit unfunded liabilities of less than 2 percent of GDP.
Eight states report unfunded ■
liabilities in excess of 8 percent of GDP — Alabama, Alaska, Connecticut, Delaware, Hawaii, Michigan, New Jersey and West Virginia. However, when the liabilities of ■
the plans using a discount rate of 7 percent or higher are recalcu-lated, Kentucky also exceeds the 8 percent of GDP threshold.
Combining Unfunded Pension and Nonpension Liabilities.
Figure VI presents the reported unfunded pension and nonpension benefit liabilities for state and local governments as percentages of the states’ GDPs.23 Before adjusting the
discount rate:
Seven states — Alaska, ■
Connecticut, Hawaii, Illinois, Kentucky, New Jersey and West Virginia — have total
FIGURE VII
Unfunded Pension and Other Postemployment Benefit
Liabilities as a Percent of State GDP in 2008
(as reported and adjusted)
Sources: Pensions are from Keith Brainard, “Public Fund Survey: Summary of Findings for FY 2008,” National Association of State Retirement Administrators, October 2009. Available at http://www.publicfundsurvey.org/publicfundsurvey/pdfs/Summary_of_Findings_FY08.pdf. And authors’ adjustments and calculations. Other postemployment benfits are from states’ and plans’ comprehensive annual financial reports and authors’ recalculation of liabilites for subset of plans with reported discount rates of 7 percent or higher.
state Pension UnPension AdOther PosteOther Postemployment Benefit Adjustment
Alabama 5.390474 14.67526 9.146306 0 Alaska 7.315658 20.62501 11.45433 2.75997 Arizona 3.549272 10.80686 0.359198 0.352459 Arkansas 2.737692 14.99076 1.778686 0 California 3.785825 19.52808 3.289875 0 Colorado 6.975103 20.67378 0.558722 0.268047 Connecticu 7.335989 12.82945 12.03614 0 Delaware -0.32686 6.261443 8.750081 0 Florida -0.89143 11.15259 0.323066 0 Georgia 1.619838 10.69457 4.60609 0.103384 Hawaii 7.998454 15.67488 13.76572 0 Idaho 1.535253 14.1694 0.928963 0 Illinois 9.636061 18.28098 6.303644 0 Indiana 3.939057 7.024413 0.173428 0 Iowa 1.963931 10.52459 0.298448 0 Kansas 6.745784 10.32421 0.258288 0 Kentucky 9.135189 13.0823 7.453527 6.264113 Louisiana 4.940071 8.857529 5.644457 0 Maine 5.596974 15.99753 4.594741 0.079589 Maryland 3.69306 11.40747 5.390129 0 Massachus 2.874559 15.23692 0.003014 0 Michigan 3.424127 11.06126 10.43592 0 Minnesota 4.2582 16.8077 0.384634 0 Mississippi 8.411207 19.95977 0.621037 0 Missouri 3.820651 16.95669 1.199342 0.181445 Montana 3.876002 16.38734 1.760887 0 Nebraska 0.866568 7.937366 0 0 Nevada 5.530803 20.30785 1.68479 0 New Hamp 4.198453 10.05896 4.264645 0 New Jersey 6.891836 18.33609 10.66459 0 New Mexic 5.781821 24.98878 3.687063 0 New York 0.977499 16.09997 4.440353 0 North Caro 0.127585 8.171478 7.182053 0.03313 North Dako 1.758844 9.642876 0.16342 0.0919 Ohio 5.470817 26.64707 5.335434 0 Oklahoma 7.847467 11.82226 0.245821 0 Oregon 6.64647 22.73363 0.377538 0.095802 Pennsylvan 2.480476 11.19827 2.938907 0 Rhode Islan 10.52777 15.494 1.665822 0 South Caro 7.707108 10.77254 5.523583 0.032663 South Dako 0.520847 12.83048 0.205633 0 Tennessee 0.635712 9.787008 0.692508 0 Texas 1.75154 9.57819 3.982964 0.476528 Utah 2.614213 13.56053 0.610328 0 Vermont 1.833999 10.89428 6.347771 0 Virginia 2.834671 10.5719 0.916567 0.404306 Washingto 1.091493 13.61778 2.449052 0 West Virgin 7.894693 10.18708 9.907221 0 Wisconsin 0.133303 20.38419 0.711229 0.017799 Wyoming 3.727689 13.09147 0.492778 0 -5 0 5 10 15 20 25 30 35 40 45 A la ba m a A la sk a A riz ona A rk ans as C al ifor ni a C ol or ado C onne ct ic ut D el aw ar e Fl or ida G eor gi a H aw ai i Ida ho Ill inoi s Indi ana Iowa K ans as K ent uc ky Loui si ana M ai ne M ar y la nd M as sa chus et ts M ic hi ga n M inne sot a M is si ss ippi M is sour i M ont ana N ebr as ka N ev ada N ew H am ps hi re N ew Je rs ey N ew M exi co N ew Y or k N or th C ar ol ina N or th D ak ot a O hi o O kl ahom a O re gon Pe nns yl va ni a R hode Is la nd Sout h C ar ol ina Sout h D ak ot a Te nne ss ee Te xa s U ta h V er m ont V irg ini a W as hi ng ton W es t V irg ini a W is cons in W yom ing
P
er
ce
n
t
of
G
D
P
Other Postemployment Benefit Adjustment
Other Postemployment Benefit Unfunded Actuarial Accrued Liability Pension Adjustment
were 7.1 percent of GDP in 2008. Thus, the unadjusted unfunded liabilities associated with state and local governments’ commitments to pay retirement benefits to former employees are about equal to the states’ official debt, but the adjusted unfunded liabilities are almost three times the debt. The appendix table shows unfunded liabilities in dollar amounts by state as reported and based on our estimates. Total unfunded liabilities for all benefit plans are $3.1 trillion based on our estimates, compared to $1.03 trillion as reported — a difference of more than $2 trillion.
Conclusion
Many state and local govern -ments calculate their plans’ liabilities using discount rates that are not commensurate with the risks they carry for taxpayers. As a result, those liabilities are greatly underestimated. The sensitivity of the final liability estimates to the choice of discount rates emphasizes the necessity of transparency in governments’ financial statements. It is a simple matter for actuaries who prepare government reports to recalculate the promised benefits under a different discount rate assumption and include these estimates along with the original ones. Several states and local governments already do a good job of presenting alternative estimates under different assumptions. New Hampshire, for example, reports other postemployment benefit liabilities under both high and low discount rate assumptions corre-sponding with a prefunded plan and a pay-as-you-go plan, respectively. unfunded pension and
non-pension benefit liabilities above 15 percent of GDP. Nine states have reported unfund-■
ed liabilities less than 2 percent of their GDP — Florida, Idaho, Iowa, Massachusetts, Nebraska, North Dakota, South Dakota, Tennessee and Wisconsin.24
Across all states, the combined ■
reported unfunded liabilities are equal to 7.2 percent of GDP. Figure VII depicts the reported and adjusted unfunded pension and nonpension benefit liabilities by state as a percent of GDP. The rankings of states before and after adjusting are highly correlated:
Seven of the top 10 highest ■
unfunded liability states in the reported rankings are also in the top 10 in the adjusted rankings. At the lower end of the distribu-■
tion, six states with the lowest 10 unfunded liabilities as a percent of GDP in the reported rankings remain in the lowest 10 based on the adjusted rankings.
All but 10 of the states and the ■
District of Columbia have total adjusted unfunded liabilities above 15 percent of GDP and four states — Alaska, Hawaii, New Jersey and Ohio — have total adjusted liabilities above 35 percent of GDP.
Across all states and the District ■
of Columbia the adjusted unfund-ed liabilities are approximately 22 percent of U.S. GDP. [See the table.]
To put these liabilities in context, states’ official debt obligations
Under any reasonable assump-tions, the fundamental result remains: There is a substantial difference between promised retire-ment benefits and the assets set aside to satisfy those obligations. What should state and local govern-ments do about it? One possibility is to make up the difference and use taxpayers’ money to fulfill the liabilities. Alternatively, employer and employee contribution rates could be increased to help shrink future unfunded liabilities.
State and local governments could also begin to change the standards of their postemployment health benefits for new workers. While governments are contractual-ly bound to fulfill the coverage they have already promised to current workers and retirees, they could alter guidelines for new employees. For example, raising the age at which workers become eligible for retiree health care coverage or increasing the premiums of health plan members would reduce future accruals and obligations.
An additional option is to begin to replace defined benefit pension plans with defined contribution plans, such as 401(k)s. States could honor what current employees have already paid into their defined benefit plans, but then switch to 401(k) plans after a certain date or for newly hired workers. In addition to relieving taxpayers from the burden of insuring pensions, individual defined contribution plans are portable across employers and would allow employees more freedom in switching from one job to another.
Unfunded Liabilities of State and Local Government Employee Retirement Benefit Plans
14
TABLE I:
Adjusted Unfunded Benefit Liabilities as Percent of Gross Domestic Product (in millions)
Source: Authors’ calculations.
Table continued on next page
State
Total Adjusted Unfunded Liabilities (pension and
nonpension benefits) Gross Domestic Product (2008) Percent of Gross Domestic Product Alabama $49,665 $170,000 29% Alaska $20,197 $47,900 42% Arizona $37,502 $248,900 15% Arkansas $19,182 $98,300 20% California $491,307 $1,846,800 27% Colorado $70,791 $248,600 28% Connecticut $69,611 $216,200 32% Delaware $9,079 $61,800 15% Florida $78,759 $744,100 11% Georgia $67,714 $397,800 17% Hawaii $23,904 $63,800 37% Idaho $8,778 $52,700 17% Illinois $216,855 $633,700 34% Indiana $28,384 $254,900 11% Iowa $17,352 $135,700 13% Kansas $21,267 $122,700 17% Kentucky $56,215 $156,400 36% Louisiana $43,204 $222,200 19% Maine $13,058 $49,700 26% Maryland $56,008 $273,300 20% Massachusetts $66,116 $365,000 18% Michigan $95,335 $382,500 25% Minnesota $56,382 $262,800 21% Mississippi $26,609 $91,800 29% Missouri $52,691 $237,800 22% Montana $7,905 $35,900 22% Nebraska $7,331 $83,300 9% Nevada $36,120 $131,200 28% New Hampshire $11,114 $60,000 19% New Jersey $170,467 $474,900 36% New Mexico $27,532 $79,900 34% New York $246,267 $1,144,500 22% North Carolina $62,087 $400,200 16% North Dakota $3,638 $31,200 12% Ohio $176,595 $471,500 37% Oklahoma $29,166 $146,400 20% Oregon $48,235 $161,600 30% Pennsylvania $91,946 $553,300 17% Rhode Island $13,114 $47,400 28% South Carolina $37,588 $156,400 24% South Dakota $5,011 $37,000 14% Tennessee $28,025 $252,100 11%
15
TABLE I (Continued):
Adjusted Unfunded Benefit Liabilities as Percent of Gross Domestic Product (in millions)
Texas $193,183 $1,223,500 16% Utah $18,426 $109,800 17% Vermont $4,853 $25,400 19% Virginia $58,472 $397,000 15% Washington $55,383 $322,800 17% West Virginia $17,256 $61,700 28% Wisconsin $51,083 $240,400 21% Wyoming $6,113 $35,300 17% District of Columbia $2,605 $97,200 3% Total 50 states + D.C. $3,105,476 $14,165,300 22% State
Total Adjusted Unfunded Liabilities (pension and
nonpension benefits) Gross Domestic Product (2008) Percent of Gross Domestic Product Alabama $49,665 $170,000 29% Alaska $20,197 $47,900 42% Arizona $37,502 $248,900 15% Arkansas $19,182 $98,300 20% California $491,307 $1,846,800 27% Colorado $70,791 $248,600 28% Connecticut $69,611 $216,200 32% Delaware $9,079 $61,800 15% Florida $78,759 $744,100 11% Georgia $67,714 $397,800 17% Hawaii $23,904 $63,800 37% Idaho $8,778 $52,700 17% Illinois $216,855 $633,700 34% Indiana $28,384 $254,900 11% Iowa $17,352 $135,700 13% Kansas $21,267 $122,700 17% Kentucky $56,215 $156,400 36% Louisiana $43,204 $222,200 19% Maine $13,058 $49,700 26% Maryland $56,008 $273,300 20% Massachusetts $66,116 $365,000 18% Michigan $95,335 $382,500 25% Minnesota $56,382 $262,800 21% Mississippi $26,609 $91,800 29% Missouri $52,691 $237,800 22% Montana $7,905 $35,900 22% Nebraska $7,331 $83,300 9% Nevada $36,120 $131,200 28% New Hampshire $11,114 $60,000 19% New Jersey $170,467 $474,900 36% New Mexico $27,532 $79,900 34% New York $246,267 $1,144,500 22% North Carolina $62,087 $400,200 16% North Dakota $3,638 $31,200 12% Ohio $176,595 $471,500 37% Oklahoma $29,166 $146,400 20% Oregon $48,235 $161,600 30% Pennsylvania $91,946 $553,300 17% Rhode Island $13,114 $47,400 28% South Carolina $37,588 $156,400 24% South Dakota $5,011 $37,000 14% Tennessee $28,025 $252,100 11% State
Total Adjusted Unfunded Liabilities (pension and
nonpension benefits) Gross Domestic Product (2008) Percent of Gross Domestic Product Alabama $49,665 $170,000 29% Alaska $20,197 $47,900 42% Arizona $37,502 $248,900 15% Arkansas $19,182 $98,300 20% California $491,307 $1,846,800 27% Colorado $70,791 $248,600 28% Connecticut $69,611 $216,200 32% Delaware $9,079 $61,800 15% Florida $78,759 $744,100 11% Georgia $67,714 $397,800 17% Hawaii $23,904 $63,800 37% Idaho $8,778 $52,700 17% Illinois $216,855 $633,700 34% Indiana $28,384 $254,900 11% Iowa $17,352 $135,700 13% Kansas $21,267 $122,700 17% Kentucky $56,215 $156,400 36% Louisiana $43,204 $222,200 19% Maine $13,058 $49,700 26% Maryland $56,008 $273,300 20% Massachusetts $66,116 $365,000 18% Michigan $95,335 $382,500 25% Minnesota $56,382 $262,800 21% Mississippi $26,609 $91,800 29% Missouri $52,691 $237,800 22% Montana $7,905 $35,900 22% Nebraska $7,331 $83,300 9% Nevada $36,120 $131,200 28% New Hampshire $11,114 $60,000 19% New Jersey $170,467 $474,900 36% New Mexico $27,532 $79,900 34% New York $246,267 $1,144,500 22% North Carolina $62,087 $400,200 16% North Dakota $3,638 $31,200 12% Ohio $176,595 $471,500 37% Oklahoma $29,166 $146,400 20% Oregon $48,235 $161,600 30% Pennsylvania $91,946 $553,300 17% Rhode Island $13,114 $47,400 28% South Carolina $37,588 $156,400 24% South Dakota $5,011 $37,000 14%
Unfunded Liabilities of State and Local Government Employee Retirement Benefit Plans
16
APPENDIX TABLE I:
State and Local Government Employees’ Unfunded Retirement Benefit Liabilities (in millions)
*Other postemployment benefit liabilities are recalculated for plans with a reported discount rate greater than or equal to 7 percent. Source: Authors’ calculations.
State Reported Pension Real Yield Curve Discount Rate Pension Nominal Yield Curve Discount Rate Pension Reported Other Postemployment Benefit
Nominal Yield Curve Discount Rate Other
Postemployment Benefit* Alabama $9,165 $17,579 $34,115 $15,550 $15,550 Alaska $3,505 $9,872 $13,387 $5,488 $6,810 Arizona $8,834 $18,327 $35,731 $894 $1,771 Arkansas $2,692 $9,835 $17,433 $1,749 $1,749 California $69,915 $340,959 $430,551 $60,756 $60,756 Colorado $17,340 $47,646 $68,736 $1,389 $2,055 Connecticut $15,859 $27,060 $43,592 $26,019 $26,019 Delaware -$202 $1,921 $3,669 $5,410 $5,410 Florida -$6,633 $62,363 $76,355 $2,404 $2,404 Georgia $6,443 $28,410 $48,981 $18,321 $18,732 Hawaii $5,107 $13,441 $15,115 $8,789 $8,789 Idaho $810 $4,751 $8,284 $490 $490 Illinois $61,063 $138,416 $176,909 $39,946 $39,946 Indiana $10,039 $16,682 $27,942 $442 $442 Iowa $2,665 $11,162 $16,947 $405 $405 Kansas $8,279 $16,476 $20,950 $317 $317 Kentucky $14,291 $24,782 $34,756 $11,660 $21,459 Louisiana $10,978 $26,687 $30,661 $12,543 $12,543 Maine $2,782 $5,206 $10,734 $2,284 $2,324 Maryland $10,094 $24,075 $41,275 $14,733 $14,733 Massachusetts $10,492 $45,010 $66,105 $11 $11 Michigan $13,099 $38,801 $55,413 $39,922 $39,922 Minnesota $11,193 $24,890 $55,371 $1,011 $1,011 Mississippi $7,720 $16,515 $26,039 $570 $570 Missouri $9,085 $37,089 $49,408 $2,852 $3,283 Montana $1,391 $5,457 $7,273 $632 $632
Nebraska $722 $4,973 $7,331 no information reported no information reported
Nevada $7,258 $24,503 $33,909 $2,211 $2,211 New Hampshire $2,519 $7,640 $8,555 $2,559 $2,559 New Jersey $32,732 $105,579 $119,817 $50,650 $50,650 New Mexico $4,620 $17,385 $24,586 $2,946 $2,946 New York $11,187 $152,968 $195,448 $50,819 $50,819 North Carolina $511 $16,029 $33,212 $28,742 $28,875 North Dakota $549 $2,360 $3,558 $51 $80 Ohio $25,795 $98,295 $151,438 $25,157 $25,157 Oklahoma $11,492 $25,529 $28,806 $360 $360 Oregon $10,739 $45,248 $47,470 $610 $765 Pennsylvania $13,725 $61,964 $75,685 $16,261 $16,261 Rhode Island $4,986 $9,206 $12,325 $789 $789 South Carolina $12,053 $25,193 $28,899 $8,638 $8,689 South Dakota $193 $2,357 $4,935 $76 $76 Tennessee $1,603 $16,203 $26,279 $1,746 $1,746 Texas $21,430 $107,316 $138,620 $48,732 $54,562 Utah $2,870 $15,229 $17,756 $670 $670 Vermont $467 $2,762 $3,238 $1,615 $1,615 Virginia $11,254 $53,797 $53,227 $3,639 $5,244 Washington $3,523 $32,580 $47,478 $7,905 $7,905 West Virginia $4,867 $9,936 $11,148 $6,108 $6,108 Wisconsin $321 $29,066 $49,330 $1,710 $1,753 Wyoming $1,316 $5,204 $5,939 $174 $174 Total 50 states $492,736 $1,884,731 $2,544,722 $536,755 $558,148 District of Columbia -$103 $104 $2,605 Total 50 States + D.C. $492,633 $1,884,836 $2,547,328
APPENDIX TABLE I (Continued):
State and Local Government Employees’ Unfunded Retirement Benefit Liabilities (in millions)
New Mexico $4,620 $17,385 $24,586 $2,946 $2,946 New York $11,187 $152,968 $195,448 $50,819 $50,819 North Carolina $511 $16,029 $33,212 $28,742 $28,875 North Dakota $549 $2,360 $3,558 $51 $80 Ohio $25,795 $98,295 $151,438 $25,157 $25,157 Oklahoma $11,492 $25,529 $28,806 $360 $360 Oregon $10,739 $45,248 $47,470 $610 $765 Pennsylvania $13,725 $61,964 $75,685 $16,261 $16,261 Rhode Island $4,986 $9,206 $12,325 $789 $789 South Carolina $12,053 $25,193 $28,899 $8,638 $8,689 South Dakota $193 $2,357 $4,935 $76 $76 Tennessee $1,603 $16,203 $26,279 $1,746 $1,746 Texas $21,430 $107,316 $138,620 $48,732 $54,562 Utah $2,870 $15,229 $17,756 $670 $670 Vermont $467 $2,762 $3,238 $1,615 $1,615 Virginia $11,254 $53,797 $53,227 $3,639 $5,244 Washington $3,523 $32,580 $47,478 $7,905 $7,905 West Virginia $4,867 $9,936 $11,148 $6,108 $6,108 Wisconsin $321 $29,066 $49,330 $1,710 $1,753 Wyoming $1,316 $5,204 $5,939 $174 $174 Total 50 states $492,736 $1,884,731 $2,544,722 $536,755 $558,148 District of Columbia -$103 $104 $2,605 Total 50 States + D.C. $492,633 $1,884,836 $2,547,328 State Reported Pension Real Yield Curve Discount Rate Pension Nominal Yield Curve Discount Rate Pension Reported Other Postemployment Benefit
Nominal Yield Curve Discount Rate Other
Postemployment Benefit* Alabama $9,165 $17,579 $34,115 $15,550 $15,550 Alaska $3,505 $9,872 $13,387 $5,488 $6,810 Arizona $8,834 $18,327 $35,731 $894 $1,771 Arkansas $2,692 $9,835 $17,433 $1,749 $1,749 California $69,915 $340,959 $430,551 $60,756 $60,756 Colorado $17,340 $47,646 $68,736 $1,389 $2,055 Connecticut $15,859 $27,060 $43,592 $26,019 $26,019 Delaware -$202 $1,921 $3,669 $5,410 $5,410 Florida -$6,633 $62,363 $76,355 $2,404 $2,404 Georgia $6,443 $28,410 $48,981 $18,321 $18,732 Hawaii $5,107 $13,441 $15,115 $8,789 $8,789 Idaho $810 $4,751 $8,284 $490 $490 Illinois $61,063 $138,416 $176,909 $39,946 $39,946 Indiana $10,039 $16,682 $27,942 $442 $442 Iowa $2,665 $11,162 $16,947 $405 $405 Kansas $8,279 $16,476 $20,950 $317 $317 Kentucky $14,291 $24,782 $34,756 $11,660 $21,459 Louisiana $10,978 $26,687 $30,661 $12,543 $12,543 Maine $2,782 $5,206 $10,734 $2,284 $2,324 Maryland $10,094 $24,075 $41,275 $14,733 $14,733 Massachusetts $10,492 $45,010 $66,105 $11 $11 Michigan $13,099 $38,801 $55,413 $39,922 $39,922 Minnesota $11,193 $24,890 $55,371 $1,011 $1,011 Mississippi $7,720 $16,515 $26,039 $570 $570 Missouri $9,085 $37,089 $49,408 $2,852 $3,283 Montana $1,391 $5,457 $7,273 $632 $632
Nebraska $722 $4,973 $7,331 no information reported no information reported
Nevada $7,258 $24,503 $33,909 $2,211 $2,211
New Hampshire $2,519 $7,640 $8,555 $2,559 $2,559
New Jersey $32,732 $105,579 $119,817 $50,650 $50,650
*Other postemployment benefit liabilities are recalculated for plans with a reported discount rate greater than or equal to 7 percent. Source: Authors’ calculations.
Unfunded Liabilities of State and Local Government Employee Retirement Benefit Plans
Endnotes
1. Pew Center on the States, “The Trillion Dollar Gap: Underfunded State Retirement Systems and the Roads to Reform,”
February 2010. Available at http://downloads.pewcenteronthestates.org/The_Trillion_Dollar_Gap_final.pdf.
2. Keith Brainard, “Public Fund Survey: Summary of Findings for FY 2008,” National Association of State Retirement
Administrators, October 2009. Available at http://www.publicfundsurvey.org/publicfundsurvey/pdfs/Summary_of_Find-ings_FY08.pdf.
3. Jeffrey R. Brown and David W. Wilcox, “Discounting State and Local Pension Liabilities,” American Economic Review:
Papers and Proceedings, Vol. 99, No. 2, May 2009, page 542.
4. As mentioned earlier, the GASB allows pension plans to discount future accrued benefits to the present using the rate of
return expected on the plans’ assets. However, as Novy-Marx and Rauh note, “Discounting liabilities at an expected rate of return on the assets in the plan runs counter to the entire logic of financial economics: financial streams of payments should be discounted at a rate that reflects their risk.” They later comment, “The way the liabilities are funded is irrelevant to their value.” Robert Novy-Marx and Joshua D. Rauh, “Public Pension Promises: How Big Are They and What Are They Worth?” Working Paper, December 2009, pages 2 and 18. Available at http://ssrn.com/abstract=1352608.
5. The U.S. Treasury securities’ yield curve reflects the relationship between interest rates and the term to maturity of
govern-ment bonds.
6. Biggs uses data from the Public Fund Survey supplemented with additional background data from the Center for
Retire-ment Research at Boston College. Andrew G. Biggs, “An Options Pricing Method for Calculating the Market Price of Public Sector Pension Liabilities,” American Enterprise Institute, Working Paper No. 164, February 26, 2010.
7. The option pricing method basically values the guarantee to pay the accrued benefits and takes into account the variation in
asset returns, the time to maturity, the present value of assets and the future value of the accrued benefits to be paid.
8. The option pricing method does not rely on a time series of future accrued benefit payments, but rather future liabilities
enter the option pricing model as a single number equal to the capitalized value of the current liability 15 years in the future. The capitalized value is determined using the plan-specific discount rate. However, Biggs first simulates the likelihood that each plan’s funding will be sufficient to pay accrued benefits. For this exercise he estimates the series of annual accrued benefit payments for each plan. The annual payments are estimated using a profile that identifies annual accrued pension payments as a percent of the accrued liability. The profile used to translate the accrued liability into an annual series of benefit payments is derived from Aaron Meder and Renato Staub, “Linking Pension Liabilities to Assets,” UBS Global Asset Management Working Paper, 2006.
9. Our analysis begins with the state and local plans identified by Keith Brainard in “Public Fund Survey: Summary of
Findings for FY 2008.” The survey identifies the actuarial value of the plans’ assets, liabilities and unfunded liabilities. In the cases in which the valuation date reported in the Public Fund Survey was prior to 2008, we update the data using information from the states’ or the plans’ comprehensive annual financial reports. We also add several plans in the process of our data collection, yielding a total of 153 total plans.
10. Robert Novy-Marx and Joshua D. Rauh, “Public Pension Promises: How Big Are They and What Are They Worth?”
Working Paper, December 2009, pages 2 and 18. Available at http://ssrn.com/abstract=1352608.
11. The initial benefit payments are estimated from the 2006 State and Local Pension data file available from the Center for
Retirement Research (CRR) at Boston College. See “State and Local Pension Data,” Boston College Center for Retirement Research. Available at http://crr.bc.edu/frequently_requested_data/state_and_local _pension_data_4.html. The ratio of benefit payments to accrued liabilities for each plan in the 2006 Center for Retirement Research file is applied to the 2008