PROPERTY & ASSET
MANAGEMENT PERFORMANCE IN
THE UK
Results from the REMark survey 2013
Bob Thompson
Steph Yates
Abstract
The
objective
of
this
paper
is
to
look
at
the
performance
of
Property
and
Asset
Management
(PAM)
in
the
UK
over
the
past
five
years.
This
part
of
the
property
industry
suffers
from
extreme
cost
pressure
to
the
point
where
profitability
is
in
question.
The
paper
discusses
different
business
models
for
PAM
and
uses
a
detail
process
model
to
pull
out
the
key
metrics
for
the
industry.
Using
the
REMark
survey
of
property
managers
and
funds
it
reports
upon
the
performance
of
property
and
asset
managers
with
respect
to
efficiency
and
collection
performance
over
a
five
year
period,
drawing
out
key
trends.
Keywords:
Property
management,
Process
change,
Collection
performance,
Asset
management,
Facilities
management,
Operational
performance
Introduction
Over the past thirty years in the UK, Property and Asset Management (PAM) has suffered
from being a poor relation to the higher profile investment and agency departments in
large multi‐functional practices ‐ yet the sector has a reputation for providing a solid
income stream across the economic cycle without the volatility associated with
transaction based income.
In uncertain times, the annuity nature of Property Management income has attracted
investment in new systems and processes that address areas such as property accounting
and has improved the sectors attitude to both process and data management as a result.
While this has been the case for bigger practices, the sector has a long tail of smaller
property managers that operate more traditionally.
In the multi‐functional practices that dominate the supply of PAM services there is always
an imperative to cross sell services into other areas such as asset management at both the
strategic and tactical levels. This is often at odds with customer perceptions and recent
years have seen the emergence of specialist property management companies that just
address the fundamentals without the need to sell other services.
From a landlord‘s perspective, PAM is arguably more important than the high profile
aquisitions and disposals that characterise the transactional parts of the industry.
Maintaining the landlord:tenant relationship is crucial to the operational performance of
real estate and property managers are custodians of the landlords reputation. Any
property owner that is interested in keeping tenants needs property managers that are
providing the very best customer service.
Measurement of the sector tends to be in terms of low level metrics such as “% rent
collected by the quarter day”. This focus upon accounting efficiency places cost control
firmly at the top the property management agenda.
Part of the problem is that fees have been driven down to uncompetitive levels. This has
the effect that everything apart from the base service is charged separately and, as a
result, resented by the client. This is well recognized by the property management
community, and all will pay lip‐service at least to the idea of good customer service.
However, there is a fundamental problem here for an industry that, so far, has found it
Property
&
Asset
Management
in
the
UK
Structure
From the outside, Property and Asset Management has a clear role to play in the
ownership of real estate either as an investor or as an occupier. However, there the clarity
ends. The industry persists in regarding management of owner occupied assets as being
something wholly different to ownership by investors despite the fact that the same
windows need to be cleaned.
Palm (2013) identifies two strategic pathways to consider regarding real estate
management but practical experience dictates that each outsourcing project in property
management is different and that there is very little consensus about what is and is not
included under the banner of "property management“ in the UK.
Figure 1 ‐ Remit Process Model (RPM)
Figure 1 shows a schematic of the top level of the Remit Process Model (RPM). This is
actually a library of over 500 best practice process charts covering everything from
spectrum. However, individual contracts often have a diffeent structure with processes
such as letting, for example, being undertaken by property managers.
There are a number of different models for outsourcing in this area. Typically, their
adoption is driven by the extent to which the property owner is prepared to cede
control of strategy in each particular area. These have been distilled into generic
types:
a conventional mixed model; a managed model;
a process based model.
Where large or specialist portfolios are involved it is common to split the outsourcing
contracts by sub‐sector. Two typical specialist areas would be Shopping Centres and
Trophy Office Buildings for example. These are both areas where the operational
management itself is relatively specialist and there are perceived advantages in placing
them with specialist managers.
Conventional
Model
The conventional property management model sees strategic asset management retained
in house but everything else outsourced. In‐house asset managers handle the
management of acquisition and disposal and the preparation of asset plans for each
building.
Property managers handle the basic property accounting functions as well as managing on
site M&E, small refurbishment works, strategic Facilities Management and performing
basic diary functions with respect to lease expiry and review.
Figure 2 ‐ Conventional model
Facilities Managers will be on‐site, full or part time, depending on the asset. Facilities
management operations will be sub‐contracted out to specialists through the property
manager.
Typically, operational asset management functions such as lease management, rating or
rent review would be outsourced to market specialists under this model, but this may be
through the conduit of Property Management ‐ restricting the outsourcing interface to
one.
Managed Model
In the managed model, property and facilities management strategy is retained in house.
The tactical implementation of Asset, Property and Facilities management is outsourced
to “best in class” specialists in each area.
Figure 3 ‐ the managed model
This may involve any number of suppliers, but has the advantage of securing the most
focused skills although at the price of a higher management overhead.
Process based Model
The process based model looks at the wider property management area from the
perspective of process and breaks down the functional areas into those that are process
dependent and those that are skill dependent.
Figure 4 ‐ the process model
Under this generic model, the client retains strategic control but outsources the entire
management layer to a process manager who will deploy resources in each of the
functional areas. These resources may be owned by the process manager, potentially
offshore, or they themselves may be outsourced further to market specialists.
This model has the advantage of a single interface and fee structure but at the price of
ceding operational control of assets to a third party, albeit in the knowledge that any
process‐led functions will be executed as efficiently as possible.
Supply
Despite much market activity and both an increased focus on service and increasing
competition, there has been very little significant change in the position of the key service
providers over the past two years.
The 2013 survey sees JLL still the largest provider of PAM services ‐ boosted by their
acquisition of King Sturge. CBRE and Savills have both strengthened their positions in the
last three years while DTZ’s problems prior to being taken over have been well
documented.
Demand
Estimates of the PAM market size vary significantly. Remit
analysis of over 4,000 fees achieved shows charges
consistently to be around 1.5% of the rent roll. The IPD
Annual index is based upon property with a combined rent
roll of some £6.6 billion this would imply a market size of
about £250 million. This is almost certainly an under‐
estimate. In 2011, based on 2009 data, Oxford Economics
estimated the portfolio and property management to be
around £2.2 billion, including a small contribution from the
public sector.
Price
Lam (2012) identifies the economic forces influencing the outsourcing process of property
management services. Findings were that the property services market was contestable,
and through competitive tendering the level of competition had a significant negative
impact on production cost and a significant positive relationship with service quality. Fee
level was also found to have no significant effect on service quality. Professional
maintenance services were found to be complex and associated with significant
transaction costs, especially where there was a high degree of contact with tenants.
The
REMark
survey
REMark is part of an on‐going programme of research by Remit Consulting. This particular
report is based upon returns from Property Managers and Investors in the final quarter of
2012.
Figure 6
This chart shows the response coverage by sector. Comparing this to the IPD annual index
for the UK, REMark covers a higher proportion of commercial leases in each sector but
Performance
This REMark research shows that collection performance has improved significantly over
time. Rent collection has risen from 56% to 78% at the due date since 2008 with 92%
being achieved after 7 days. For service charges, 66% are collected by the due date with
just over 80% by the end of the first seven days. Figure 7 shows the full breakdown.
However impressive this improvement, it still reflects an unacceptable level of systematic
inefficiency in the collection process. The due date for rent is the date that the rent is due,
not the date the process starts.
To give an idea of the potential scale of the cost of this inefficiency: using the same IPD
Annual index rent roll of some £6.6 billion adjusted to reflect an estimated whole market
size. To collect that rent at the pace indicated by REMark over a 30 day period would
imply an annual cost to the industry of some £17 million.
Raising the proportion of rent collected on the due date to 90% with knock on
improvements at 7 and 14 days would more than halve this finance cost of collection.
The worst rates of rent collection reported in this survey were two responses under 50%
at the due date up significantly on the 27% seen in the last survey but still a chronically
inefficient proportion of rent that is due on that day.
Overall Figure 8 shows the distribution of returns shows the majority of collection rates
between 75% and 90% at the due date but the average of 78% is dragged down by the
underperformers.
This is an area where the performance of the big, multidisciplinary property managers far
exceeds that of the smaller players. On average collection at due date is 82.3% for the big
players and only 65.6% for small property managers. This demonstrates that the
significant investments made in PAM systems and process improvement over the past five
years is beginning to have an impact.
Figure 7 ‐ Collection performance
Efficiency
One of the key determinants of efficiency in property management is the efficacy with
which the volume of work is handled. REMark pulls out two metrics here: the number of
leases per capita; and the staffing cost per lease.
PropertyManagement ‐ leasespercapita(lpcs)
Overall the average number of leases handled by each surveyor stands at 150 – up 25%
from the 120 leases per surveyor recorded in 2010.
Figure 9 shows this metric set against the size of the responding property management
team including support staff and other disciplines. This shows the number of leases per
surveyor trending downwards from 165lpcs for the smallest teams to 95lpcs for the
largest. In fact 92% of the returns fall within the range 80lpcs to 220lpcs.
There are many factors that will influence the number of leases being handled, not least
the complexity of the assets, the range of services and the quality of service being
provided. However, given a consistent level of provision and despite improvements in the
past few years, it is clear that there is room for significant efficiency gain in some firms.
PropertyManagementAccounts ‐ leasespercapita(lpca)
The REMark responses give us the opportunity to examine individual functions. Figure 10
shows the relationship between the size of the property management accounts team and
the number of leases handled per capita.
These teams include accounting specialists as well as surveyors but the data shows the
same pattern with overall leases per capita averaging at 175 and the vast majority of the
responses in a range between 80lpca and 220lpca. A similar trend is also apparent in the
number of leases per capita declining as team size increases.
Although the number of leases per capita is slightly higher for property accounts this is a
commodity service and should be highly automated. It is surprising, therefore, that the
figure is not significantly higher.
Figure 9 – Property Management – leases per capita
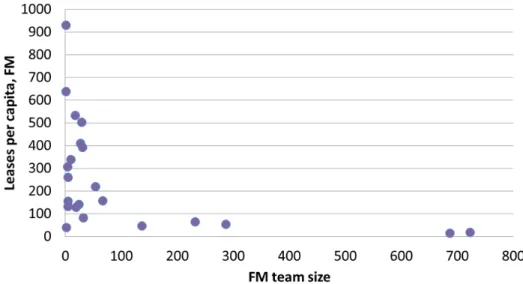
Figure 11 applies the same test to Facilities Management. Here, average leases per capita
are much higher at 253, but, given the hands‐on nature of much Facilities Management,
the expectation would be that the team size should be much more closely correlated with
the number of leases being managed.
However, this data makes no distinction between those teams that manage an internal
workforce and those that outsource, nor does it distinguish between facilities intensive
assets such as shopping centres and others where the facilities burden is lighter. Further
research is needed in this area to define the services and their contribution.
Staffingcostsperlease
Clearly, the cost of staffing is a major component of overall property management costs
and a major determinant of pricing. Using the RICS/ Macdonald salary survey (RICS)
combined with the Annual Survey of Hours and Earnings (ASHE) survey, it is possible to
build up a picture of the cost of staffing Property Management.
Remit Consulting also holds detailed data about the fee levels actually achieved for a wide
range of property management contracts. Table 1 shows the average levels of fee
achieved per lease by sector.
Figure 12 shows the breakdown of the REMark responses by function. Around 33% of
the Property Management staffing costs are made up by accounting. If Facilities
Management is included this drops to 20% ‐ less than we would have expected.
Sector Average fee per
lease Industrial £1,290 Retail £1,428 Office £1,994 Table 1 Property Management Property Management
PM Accounts Management Facilities
PM Accounts
Figure 11 – Leases per capita, for the FM team
Clearly different providers will have a unique mix of services offered and this leads to a
deal of volatility at a cost per lease level.
Figure 13 shows the staffing cost per lease set against the number of leases handled. This
shows that, far from seeing any economies of scale, the staffing cost per lease rises with
the number of leases handled.
Given that this analysis assumes a common cost per surveyor (RICS , 2012) and a common
support staff cost (ONS, 2012) this appears to show excess capacity in the larger teams. It
might, however, reflect increased compliance costs.
While staffing costs in this chart tend to cluster between £900 and £1750, there are a
significant number that fall well above this level and well below.
Of interest is what these staffing costs say about fees. Table 1 shows a fairly tight band of
fees achieved per lease between £1,290 for industrial property and £1,994 for offices with
an average of £1,523 achieved per lease. This accords broadly with industry heuristics.
This analysis shows a much wider variation in staffing costs (remember this assumes a
common cost basis) but with an average STAFFING cost per lease of £1,560 ie a staffing
cost that is 2.5% higher than the average fee achieved for the work. Once overhead costs
etc are added to the cost of servicing the lease – on average this would show a loss. Figure
14 overlays the average fees identified.
This reinforces the traditional view that Property Management is being used as a loss
leader to attract fees from other service lines that will cross subsidise the yield from each
customer. However, interviews with clients highlight that one of the least palatable
aspects of the relationship with Property Managers is just that need to sell further
services outside the contract.
Of course, individual property managers pay salaries that vary from the common basis
used here and are able to increase margins thereby but it is equally clear that, in many
cases, the pricing mechanism used needs far greater transparency.
Figure 13 – Staffing cost per lease against number of leases handled
Conclusions
The objective of the ReMARK survey is not to prove or disprove any theory. It’s purpose is
to shine a light upon an important part of the industry that is generally under‐researched.
The basic metrics of rent collection and operating efficiency have improved since the first
survey in 2010 but for many portfolios remain inadequate. There is also a significant gap
between the best and worst performing manager. Basic, systemic problems remain
prevalent in the process of management.
The survey demonstrates that size is very important in property management. The big
managers ‐ JLL, CBRE and Savills, for example – all have better collection performance
than the smaller ones.
Perhaps the most telling part of the survey are the costs. It has long been suspected that
multi functional real estate practices use property management as a loss leader to sell
more profitable services. The ReMARK survey provides evidence of this. Using industry
averages, the staffing cost alone often exceeds the average fee per lease, wiping out any
profit.
References
Amaratunga, D & Baldry, D ‐A conceptual framework to measure facilities management
performance ‐ Property Management – 2003 ‐ MCB UP Ltd ‐ Vol. 21 Iss: 2, pp.171 ‐ 189
Edwards, V & Ellison, L ‐ Corporate Property Management: Aligning Real Estate With
Business Strategy – 2004 ‐ Blackwell Science
Gibson, V ‐ Strategic Property Management: How Can Local Authorities Develop a
Property Strategy?‐ Property Management – 1994 ‐ MCB UP Ltd ‐ Vol. 12 Iss: 3, pp.9 ‐ 14
Lam, T Y M ‐ Economic perspective on outsourcing of property management services ‐
Property Management ‐ 2012 ‐ Volume 30 Issue 4
MacDonald & Company ‐ Rewards and Attitudes Survey – 2012 ‐ RICS
McDonagh, J ‐ Measuring corporate real estate asset management performance ‐
Proceedings of the 8th annual conference of the Pacific Rim Real Estate Society,
Christchurch, New Zealand, 21‐23 January 2002 – 2002 – PRRES
http://hdl.handle.net/10182/1250
Office of National Statistics ‐ Annual Survey of Hours and Earnings – 2012 ‐ ONS
Oxford Economics ‐ The size of the UK outsourcing market across the private and public
sectors – 2011 ‐ Business Services Association
Palm, P ‐ Strategies in Property Management : two strategic pathways ‐ Property
Management – 2013 ‐ Volume 31 issue 4
Pitt, M & Hinks, J ‐ Barriers to the operation of the facilities management: property
management interface ‐ Facilities – 2001 ‐ MCB UP Ltd ‐ Vol. 19 Iss: 7/8, pp.304 ‐ 308
Pitt, M & Tucker, M ‐ Performance measurement in facilities management: driving
innovation? ‐ Property Management – 2008 ‐ Emerald Group Publishing Limited ‐ Vol. 26