DOI: 10.22067/cke.v2i1.77384
Fuzzy Q-Learning Traffic Light Control based on Traffic Flow and
Pedestrian Number Estimated from Visual Information
Marjan Jalali Moghaddam*1 Matin Hosseini2 Reza Safabakhsh3
Abstract: A vision-based intelligent traffic control system is a robust framework that controls the traffic flow in real-time by estimating the traffic density near traffic lights. In this paper, a traffic light control system based on fuzzy Q-learning is proposed according to the vehicle density and the pedestrian number estimated from the visual information. The aim of proposed approach is to minimize the pedestrian and the car waiting time and maximize throughput for an isolated 4-way traffic intersection. Also, the pedestrian traffic light is controlled based on the fuzzy logic. The states and actions of the Q-learning variables are set by a fuzzy algorithm which can be learned through environmental interactions. The system can detect the number of pedestrians and vehicles using visual information from cameras and machine vision algorithms. The fuzzy control system can adjust the sequence of green phases to decrease the total waiting time and the mean of the queue length. The proposed algorithm was simulated for one hour for each of 14 different traffic conditions and was assessed and compared with the preset cycle time and vehicle actuated approaches. The results showed the proposed algorithm could decrease the total waiting time and the mean of the queue length effectively.
Keywords. Intelligent traffic control system, Traffic density, Fuzzy logic, traffic light control.
1. Introduction
Many big cities are confronted with heavy traffic because of the ever-increasing population and the limitation of the existing resources in the current infrastructures. As a result, efficient methods for traffic flow management are necessary to optimize the use of the available road capacity. High fuel prices and environmental problems are the other important reasons to reduce traffic.
Most of the existing studies have not considered the impact of pedestrian density on the traffic light duration, and none of them have exclusively controlled the role of pedestrian traffic lights. Some studies have investigated the pedestrian density at the end of each phase to calculate the next green phase duration. These approaches cannot work in unpredictable environments such as intersections near the subway or BRT stations because the pedestrian number during the green phase is not predictable based on the previous phase. In multi-agent traffic light control in which small groups of closely spaced lights communicate with one
Manuscript received December. 31, 2016; accepted. June 1, 2019. 1*
M. Jalali Moghaddam, M. S. Computer Engineering Department, Amirkabir University of Technology, Tehran, Iran. Email: jm8264@yahoo.com
2
Matin Hosseini, AssistantProfessor, Computer Engineering Department, Amirkabir University of Technology, Tehran, Iran
.
3Reza Safabakhsh
,
Associate Professor, Computer Engineering Department, Amirkabir University of Technology, Tehran, Iran. another to cycle synchronously, the coordination mechanism cannot maintain synchronization because unpredictable pedestrian passing during the green phase of traffic light disturbs the vehicle passing, and the system cannot synchronize the intersections with one another based on the traffic following model. Adjusting pedestrian traffic light duration separately in the critical situations can resolve this problem because it prevents the pedestrian crossing during the vehicles’ green light. Therefore, the need arises for optimizing traffic control systems that can adapt to this increasing congestion. This study attempts to decrease the traffic congestion through the development of an intelligent traffic control system based on the traffic density flow at intersections.Many investigations have attempted to solve different traffic problems in the intelligent transportation systems [1, 2, 3, 4, 5]. In many cases, a fixed time traffic light control system has been used with the aim of minimizing the waiting time and the number of vehicles waiting at intersections. However, it is preferable to have dynamic traffic light control systems in which the green light duration is adjusted based on the dynamic environmental changes to maximize throughput and minimize the waiting time. Fuzzy control systems use fuzzy logic, which simulates the human intelligence to control traffic and enables the implementation of real-world rules and human-like thinking process. Fuzzy control is an approach that can be applied to various traffic models. The fuzzy logic traffic light controllers utilize sensors to count the number of vehicles. Therefore, the resulting controllers control the traffic lights according to traffic density [6]. There are different approaches to control traffic lights based on the artificial intelligence methods such as fuzzy logic, neural networks, reinforcement learning, and evolutionary algorithms. These methods can lead to shorter queues and less traffic delays.
There are two approaches to traffic light control including pre-timed [7] and sensor-based signal controls. The preset cycle time methods present the traditional strategy which consists of a preset interval series that cannot respond to the unpredictable conditions and a waste of time for the less congested roads [8]. The vehicle actuated methods are sensor based methods in which the green light time can be extended based on a demand.
and the pedestrian number. We propose a two-phase real-time approach, first, based on fuzzy Q-learning for adjusting the traffic light duration and second, the fuzzy control for the pedestrian traffic light duration for an isolated intersection based on the visual information. Compared to the pre-set cycle time (PCT) and the vehicle actuated approaches, the proposed method can reduce the average number of vehicles in traffic queues and the average waiting time for vehicles. Also, the proposed method can decrease the pedestrian waiting time significantly. The proposed system can analyze the various relationships between traffic conditions and the optimal actions using its experience in different situations. Furthermore, it can effectively work in specific situations based on its experience with identical or similar situations. There are some potential actions; each state is related to its corresponding action via fuzzy if-then rules. The proposed algorithm takes the advantages of fuzzy logic and Q-learning approaches by tunning fuzzy inference parameters for each fuzzified state using Q-learning.
The advantages of the proposed approach are as follows: • No need for the pre-specified models as training is possible for any traffic conditions
• Can learn the relationships between states and actions using environmental interactions
• Benefits from the fuzzy system advantages which avoid discretization problem of Q-learning by dealing with continuous states and actions
• Suitable for synchronization
The rest of this paper is organized as follows. A summary of the background work is presented in section 2. Section 3.1 reviews the local binary pattern and Gabor filters and the pedestrian number estimation method. Section 3.2 reviews the Gaussian mixture model and presents the vehicle number estimation scheme. Section 3.3 reviews fuzzy Q-learning and presents the algorithm scheme. Section 4 reports experimental results and section 5 concludes the paper.
2. Background
As this paper aims to improve the traffic light control, the existing methods on this subject are briefly discussed below.
Smith et al. proposed a neural network based on the approach for the traffic light control. This approach has a time-consuming learning process and reduces the waiting time by 10% [9]. The use of fuzzy logic results in a good performance in traffic congestion control [10, 11]. Arora et al. measured traffic density on the road using morphological edge detection and a fuzzy logic technique [12]. Tari et al. used a two-level hierarchical fuzzy rule-based system for controlling complex traffic intersections [13]. Keyarsalan et al. used computer vision techniques and neural networks to extract the traffic data and apply a fuzzy ontology to control the traffic lights in the isolated intersections [6]. Shakeri et al. introduced a three-layer fuzzy system based on the cellular automata for optimizing the traffic light control [14]. Abdulhai et al. provide an isolated traffic signal controller using reinforcement learning which could be combined with dynamic route guidance [15]. Also, multi-agent Q-learning was used for a non-stationary environment that estimated states based on the average queue length [16]. In order to minimize the waiting time of the public transportation and reduce the computational complexity, dynamic
programming and branch-and-bound techniques were combined to control traffic lights [17].
Liu et al. presented a differential evolution bacteria foraging optimization algorithm to minimize the vehicles’ delay in a cycle and maximize throughput of the intersection [18]. In another work, vehicles were detected using edge detection and matching. After the edge detection, the reference and the real-time images were matched and the traffic light duration was determined based on the percentage of matching of the two images [19].
Dujardin et al. applied Mixed Integer Linear Programming (MILP) for multimodal traffic light control based on the optimization of three criteria including the total delay of persons and public vehicles, and the number of stops for the private vehicles [20]. Jalali Moghaddam et al. proposed a two-phase real-time traffic light control system based on fuzzy q-learning for adjusting traffic light duration for an isolated 4-way intersection based on the traffic flow [21]. Bazzan et al. investigates the task of multi-agent reinforcement learning for the control of traffic signals [22]. Mikami et al. proposed a cooperative signal control scheme with a combination of genetic algorithm and reinforcement learning [23]. Rezzaii et al. proposed a multi agent reinforcement learning based the algorithm for the traffic light control [41, 42]. Zhu et al. modelled traffic signals as intelligent agents interacting with the stochastic traffic environment to develop the Junction Tree Algorithm (JTA) based on the reinforcement learning for the coordinated signal control problem [24].
Cesme et al. explored a new model based on the local actuated control for the traffic signal control. In this system, the green phase can be extended or truncated based on the flow rate of a platoon [25]. Stevanovic et al. presented an approach where a three-dimensional Pareto fronts of signal timing solutions are optimized by the use of an evolutionary algorithm in the stochastic optimization environment to bring a balance between mobility, safety, and environment [26].
Pescaruet al. proposed an integrated methodology for the adaptive traffic light control within a city zone. Their proposed method is based on an ensemble of classifiers that intelligently process the input data measured by a reduced number of sensors placed only on principal roads entering that zone [27]. Le et al. proposed a decentralized traffic signal control strategy based on the so-called back pressure
policy for the urban road networks. Their approach does not require any apriori knowledge of the traffic demand and only needs the information that is local to the intersection [28]. Cong et al. considered a co-design approach with the aim of finding the optimal network topology and the optimal parameters of the traffic control laws simultaneously by solving a co-optimization problem [29]. Sun et al. developed a bi-level programming formulation and a Heuristic Solution Approach (HSA) for the dynamic traffic signal optimization in networks with time dependent demand and the stochastic route choice [30].
ensure the safety of intersections and to prevent secondary injuries [32]. Cao et al. introduced a multi agent pheromone-based on a traffic management framework which aims to unify the vehicle rerouting and the traffic light control [33]. Fleck et al. applied and infinitesimal perturbation analysis based on a quasi-dynamic traffic light control for a single intersection which they modelled as a stochastic flow model [34].
3. Proposed Method
3. 1. Pedestrian Number Estimation
As there is a correlation between crowd density and texture patterns, texture features can be used to estimate pedestrian number in outdoor scenes. Jalali Moghaddam et al. proposed crowd density estimation method using texture descriptors based on Local Binary Pattern and Gabor filters [1]. A set of well-established 2-D Gabor filters are used to extract the global texture features, which can effectively solve the problems of overlap among crowd members and the perspective distortion.
3.1.1. Gabor Filters: A 2-D Gabor filter is a band-pass filter which is the product of a 2-D Gaussian kernel function with oriented sinusoids [36]. The Gabor filter can respond to the directed frequency components of different scaled textures. Thus, filtering can be performed at different scales to find patterns of different sizes. Moreover, applying multi-frequency and multi-direction Gabor filter significantly mitigates the issues of perspective distortion and occlusion. Therefore, the Gabor filter output can give effective texture descriptors for the pedestrian number estimation. In this paper, feature extraction in space and spatial-frequency domains can be done with even-symmetry (h_e) and odd-symmetry (h_o) Gabor filters via convolution as:
ℎ𝑒(𝑥, 𝑦) = 2𝜋𝜎1 2𝑒−
𝑥2+ 𝑦2
2 𝜎2 𝑐𝑜𝑠 (2𝜋𝜔0(𝑥 𝑐𝑜𝑠𝜃0
+ 𝑦 𝑠𝑖𝑛𝜃0)) (1)
ℎ𝑜(𝑥, 𝑦) = 2𝜋𝜎1 2𝑒−
𝑥2+ 𝑦2
2 𝜎2 𝑠𝑖𝑛 (2𝜋𝜔0(𝑥 𝑐𝑜𝑠𝜃0 + 𝑦 𝑠𝑖𝑛 𝜃0))
(2)
𝑞𝑒(𝑥, 𝑦) = 𝑝(𝑥, 𝑦) ⨂ ℎ𝑒(𝑥, 𝑦) (3)
𝑞𝑜(𝑥, 𝑦) = 𝑝(𝑥, 𝑦) ⨂ ℎ𝑜(𝑥, 𝑦) (4)
𝑞(𝑥, 𝑦) = √𝑞𝑒2(𝑥, 𝑦) + 𝑞𝑜2(𝑥, 𝑦) (5)
Where 〖 ω〗_0,θ_0,σ are the central frequency, orientation, and spatial constant, respectively, p is the input image and ⊗ denotes convolution. To diminish the sensitivity of this approach to monotonic illumination variations, Local Binary Pattern operator is applied.
3.1.2.Local Binary Pattern: Local Binary Pattern is one of the most powerful descriptors for texture analysis. Due to its tolerance to monotonic illumination changes and its computational simplicity, it has been widely used in many applications. LBP labels the pixels with the value obtained from its neighborhood pixels. Each neighbor in the 3×3 neighborhood of a pixel is compared with the pixel and is
replaced with to 1 if it is larger than the pixel or 0 if it is smaller than the pixel. The corresponding decimal value of each pixel which is obtained by concatenating the binary values in a clockwise direction is then used for labeling the given pixel.
3.1.3. Pedestrian Number Estimation Method: After converting the input RGB images to gray level, we just use the sub-region of the image which is called the Region of Interest (ROI) to speed up the algorithm. The input image is enhanced with a 3×3 mean filter and histogram equalization. Next, the LBP algorithm is applied to reduce the monotonic gray-scale changes of the enhanced image. In the next step, the features are extracted from the LBP image using 24 two-dimensional visual cortical Gabor filters. Six values including 2, 4, 8, 16, 32, 64 are selected for frequencies (ω0),
four values consisting of 0°, 45°, 90° , and 135° are selected for orientations, and ω1
0was selected for the spatial constant
σ. Since the histograms of the channel output images are often close to a Gaussian shape [36], only the mean values and the standard deviations of channel output images are computed and used as texture features. Finally, we estimate the pedestrian number using the Least Square Support Vector Machine (LSSVM) regression toolbox [37] which is a reformulation to the standard SVMs which leads to solving linear KKT (Karush-Kuhn-Tucker) systems.
a. Vehicle Number Estimation
3.2.1. Gaussian Mixture Model (GMM): In the Gaussian Mixture Model, the value of a particular pixel is modelled by a mixture of k Gaussian distributions [38]:
p(𝑥𝑡 )=∑𝑘𝑖=1𝜔𝑖.𝑡∗ η(𝑥𝑡, 𝜇𝑖,𝑡, 𝛴𝑖,𝑡) (6)
where k is number of distributions, and ωi,t, μi,t , and Σi,t
are the weight, the mean, and the covariance of the ith
Gaussian at time t, respectively. In addition, η is a Gaussian probability density function [38].
The Gaussians are ordered by the value of ω/σ. The B first distributions are selected as the background model. A match is defined as a pixel value within 2.5 standard deviations of a distribution.
A current pixel value that does not match any of the k distributions with sufficient supporting evidence is labelled as foreground. In case of the mismatch, the least probable component is replaced with a new distribution whose mean value is set to the new pixel value and its variance and prior weight are initialized to a high and a low value, respectively. If a distribution is matched with the new observation, the parameters of the distribution are updated as:
𝜇𝑡= (1-ρ) 𝜇𝑡−1+ρ 𝑥𝑡 (7)
𝜎𝑡2= (1-ρ) 𝜎𝑡−12 + 𝜌(𝑥𝑡− 𝜇𝑡)𝑇(𝑥𝑡− 𝜇𝑡) (8)
ρ=α η(𝑥𝑡| 𝜇𝑘, 𝜎𝑘) (9)
3.2.2. Vehicle Number Estimation Method: The RGB input images are first converted to gray level images and a ROI-based method was used for vehicle detection to speed up the algorithm. Then, a GMM background subtraction method was applied to segment the moving regions in the current frame. The segmented region is called as the foreground mask. After segmentation, the foreground mask was enhanced with a 3×3 median filter. Next, adaptive blocking was used to mitigate the issues of perspective distortion. In this stage, a multi-scale patch size is used. The ratio of the number of foreground pixels to the number of background pixels in each block was calculated and considered as a training feature vector. Finally, the vehicle number was estimated using the Least Square Support Vector Machine (LSSVM) regression.
3.3. Traffic Light Control
The proposed method for traffic light control is shown in Fig. 1. Q-learning has been used for learning in fuzzy systems [39]. Since the state and actions of Q-learning algorithm can be set by fuzzy variables, Q-learning can take advantage of fuzziness. A Fuzzy Q-learning controller and a fuzzy controller are designed for the traffic light and the pedestrian traffic light controls, respectively, for an isolated 4-way traffic intersection. The Q-learning information is used in tuning the output membership functions of the fuzzy controller. The Fuzzy Q-learning and fuzzy controllers can operate based on linguistic rules like humans similar to the policeman handling the traffic flow at a junction.
In this paper, Fuzzy Q-learning traffic light control is introduced according to vehicle density and pedestrian
number estimated using visual information to minimize the waiting time and maximize the throughput of the intersection. The green light and the red light specified the arrival side and queue side, respectively. If the north and south side is green then this would be considered as the arrival side, while the west and east side would be considered as the queuing side, and vice-versa. Three input variables are considered for the traffic lights control:
• Max_ql_ns: the maximum number of vehicles in the north-south and the north-south-north (max (ql_north, ql_north-south)) • Max_ql_ew: the maximum number of vehicles in the east-west and east-west-east (max (ql_east, ql_east-west))
• Ped_num: the maximum number of pedestrian waiting in the arrival side (max (p_ar_1, p_ar_2))
The fuzzy variable determined the optimal traffic light duration for the arrival side. Before the end of each phase, the next green optimum phase durations being estimated based on the current traffic conditions are specified by four variables including the number of vehicles in the north (ql_north), the south (ql_south), the east (ql_east), and the west (ql_west ). The proposed algorithm determined the optimal next phase duration for the queue side based on the current queue lengths. The north-south and east-west Q-tables are used where the size is determined as:
𝑄𝑡𝑎𝑏𝑙𝑒− 𝑠𝑖𝑧𝑒 = 𝑛𝑜𝑎𝑠 ∗ 𝑛𝑜𝑞𝑠 ∗ 𝑁𝑂𝑎𝑐𝑡𝑖𝑜𝑛 (10)
where noas is the number of the arrival side membership functions, noqs is the number of the queue side membership functions, and NOaction is the number of actions.
Activation Degree of Each Rule
Normalization
Green Light Duration Calculation
Traffic Condition < 14 Start
Queue-Length-North
Queue-Length-South
Queue-Length-West Queue-Length-East
Max
Max
Fuzzification
Fuzzification
Punishment Calculation
Updating Q-Table
Termination Condition
Q-Table Yes
No
No Vehicle
Number Estimation
te==5∗K
&& te> (30%∗GLD)
&& GLD- te < 35 Pedestrian Number
Estimation Assignment
Calculating Pedestrian Traffic
Light Duration Assignment
During Green Phase
Yes Yes
No
The proposed algorithm is described as follows:
1.
Based on the number of vehicles in each queue, thevariables Max_ql_ns and Max_ql_ew are calculated as an input for the next step of the algorithm.
2.
Four fuzzy sets are defined on each dimension of the two dimensional state space, 𝑚𝑓𝑛𝑠𝑖 and 𝑚𝑓𝑒𝑤𝑖 are thecorresponding membership function in which i ϵ {low, medium, high, very high} as are illustrated in Fig. 2. Each rule is associated with a set of possible discrete actions
Actj1,j2= {actj1, j2,r1,actj1,j2,r2, …, actj1,j2,rk}where j1, j2= 1, 2 ,… , show the number of membership functions,
and r = 1, 2, …, nR where nR is the number of rules. The
corresponding action values are defined as follow:
𝑄𝑗1,𝑗2= {𝑞𝑗1, 𝑗2,𝑟1 , 𝑞𝑗1,𝑗2,𝑟2, …, 𝑞𝑗1,𝑗2,𝑟𝑘} (11)
According to the above definitions, the generic rule Rr
may be written as:
Rr : If Max_ql_ns is mfnsi and Max_ql_ew is mfewi
Then output = ar,1 with qr,1
OR . . . OR
output = ar,nR with qr,nR
When Max_ql_ns and Max_ql_ew enter the system, they are fuzzified based on the membership function. All of the rules are activated partially by a certain activation level which is calculated as:
𝜑𝑟= 𝜇𝑛𝑠𝑖 (𝑀𝑎𝑥_𝑞𝑙_𝑛𝑠 ) ∗ 𝜇𝑒𝑤𝑖 (𝑀𝑎𝑥_𝑞𝑙_𝑒𝑤) (12)
where μns and μew are truth degrees.
Fig. 2. The membership functions for arrival side and queue side
3.
Since each input variable belongs to several fuzzy sets with different activation levels, the activation level is normalized and is considered as the weight of each of the winning actions of the rule:𝜑_𝑛𝑜𝑟𝑚 𝑟 𝜑𝑟
∑𝑁𝑟𝑟=1𝜑𝑟
(13)
4.
The time of the green light is calculated based on theaverage weight method:
∑𝑁𝑟=1𝑟 𝜑𝑟∗ 𝑤𝑖𝑛_𝑎𝑐𝑡𝑟 (14)
where φrand win_actr are the weight and wining action of
the rth rule, respectively.
5.
After the calculation of the next green light duration, the output value which is between -1 and 1, is mapped to the original range. In this paper, the original range is multiples of 5 between 10 and 100.6.
After each phase, the punishment is calculated based on the queue length variation as:Punishment =∑4𝑖=1(𝑙𝑜𝑔 (𝑚𝑎𝑥 (|𝑞𝑙𝑖𝑛𝑒𝑤− 𝑞𝑙𝑖𝑜𝑙𝑑|),1) ∗ 𝑠𝑔𝑛(𝑞𝑙𝑖𝑛𝑒𝑤− 𝑞𝑙𝑖𝑜𝑙𝑑))
(15)
where qli∈ {qlnorth, qlsouth, qleast, qlwest}
7.
The arrival side Q table is updated after calculating the punishment. Gradient descent is usually used to update the parameters of the algorithm:𝑞𝑟,𝑖𝑡+1= 𝑞𝑟,𝑖𝑡 − 𝛼𝜀𝑄𝑡𝜓𝑟
𝜀𝑄𝑡 = 𝑃𝑢𝑛𝑖𝑠ℎ𝑚𝑒𝑛𝑡 − (𝛾 𝑚𝑎𝑥𝑎 𝑄(𝑠𝑡+1, 𝑎) − 𝑄𝑡(𝑠𝑡, 𝐴𝑡(𝑥𝑡)))
𝑚𝑎𝑥
𝑎 𝑄(𝑠
𝑡+1, 𝑎) = ∑ 𝜓 𝑟 𝑛𝑅
𝑟=1
𝑚𝑎𝑥 𝑖 {𝑞𝑟,𝑖
𝑡 }
(16)
where γ is the discount factor and α is the learning rate.
8.
The above steps are done for each of the 14 differenttraffic conditions in one hour simulations and then are repeated until the convergence has emerged.
9.
Assume teshows the elapsed time of the green phase andGLD is the duration of the current green traffic light. At the test time, during each green phase, in the time interval that te is greater than 30%*tGLD and the reminder time
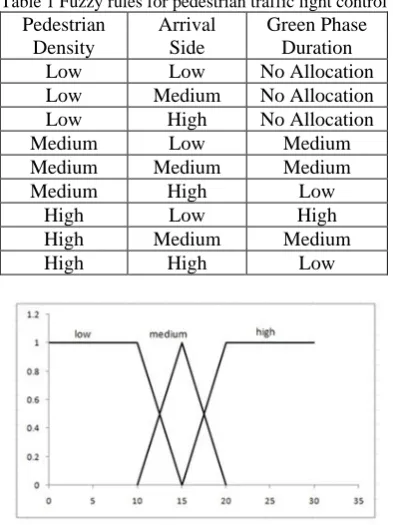
of the green light is more than 35 seconds. The pedestrian traffic light estimation procedure is run to make a decision for the allocation or not allocation of the pedestrian traffic light. In case of allocation, the pedestrian traffic light duration is specified based on fuzzy rules that are shown in Table 1 and the pedestrian membership function shown in Fig. 3. In this procedure, the pedestrian number is estimated based on algorithm 2.1. every 5 seconds, and the decision making for the pedestrian traffic light is done based on a fuzzy controller system.
A total of 9 fuzzy rules were established to construct the fuzzy controller. These rules are set based on the required time for the pedestrian passing which is related to the street’s width and the pedestrians’ group speed in group that are extracted from traffic video images in different times and streets. The elapsed time and the pedestrian green light duration values are shown with te and tp, respectively.
During the green phase of the pedestrian traffic light, the traffic light for the queue side and the arrival side switch to green and red, respectively.
tpseconds of the green phase were allocated to pedestrian
traffic light, the reminder of the green duration is calculated based on the pedestrian green phase duration and elapsed time and is reallocated to the arrival side. This value can be obtained as follow:
𝑡𝑟 = GLD – (𝑡𝑒+ 𝑡𝑝) (17)
11. The above steps are done for each of the 14 different traffic conditions in one hour simulations.
Table 1 Fuzzy rules for pedestrian traffic light control Pedestrian
Density
Arrival Side
Green Phase Duration
Low Low No Allocation
Low Medium No Allocation
Low High No Allocation
Medium Low Medium
Medium Medium Medium
Medium High Low
High Low High
High Medium Medium
High High Low
Fig. 3. The pedestrian membership
4. Experiments
a. Experimental Setting
The proposed approach for crowd density estimation is evaluated within the collected video image dataset by the Tehran Transportation and Traffic Organization (TTTO). We manually selected images to cover all vehicle and pedestrian congestion levels, brightness levels and shadows. Based on the manual estimation, the images were labelled. To use all data for both training and testing, we have used a 10-fold cross validation. We randomly broke data into 10 sets. In order to evaluate the proposed algorithms to estimate the vehicle number, the parameter values were set to k=3, T=0.33, and α=0.05.
The proposed algorithm for traffic light control is simulated for one hour for each of the 14 traffic conditions that are presented in table 2 [40]. Vehicle arrival and departure rates are simulated using Poisson distributions on each street as shown in table 2. In order to evaluate the proposed algorithm, the parameter values are set as: γ =0.8, ε=0.01, and α =0.2. After each 14 states, alpha is updated with a 0.99 update rate. In each phase, based on the ε-greedy exploration strategy, the best action with probability 1 − ε and a random action with probability ε is selected for each rule. The departure rates for all conditions are set equal to 1.
Pedestrian arrival and departure rates are simulated using Poisson distributions on each street based on the mean rates obtained based on the video image dataset which is captured by the TTTO. These algorithms are implemented using Matlab on an Intel® core i5 M460 2.53 GHz PC with 4 GB RAM.
b. Experimental Results
In this section, we present the results of our experiments. The pedestrian and vehicle number estimation algorithms are assessed on Tehran traffic video dataset collected by transportation and traffic organization. The ground-truth count and the number calculated by algorithm are compared by the Mean Absolute Error (MAE) measurement:
MAE = 𝑁1∑𝑁𝑖=1𝐶(𝑖) − 𝑇(𝑖) (18)
where N is the number of frames of the test sequence and C(i) and T(i) are the calculated and the ground-truth number of pedestrians and vehicles in the ith frame, respectively.
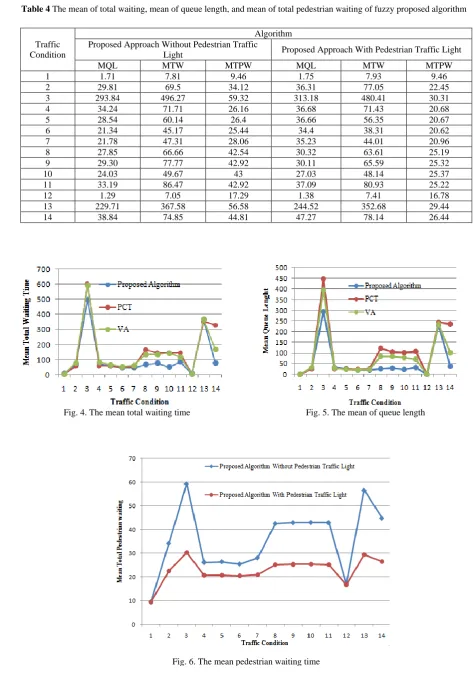
We also compared the proposed traffic light control algorithm with two other traffic light control methods, namely PCT and VA on the 14 traffic conditions. Based on the arrival and departure time of each vehicle, the total waiting time and the mean queue length are calculated. The Mean of Total Waiting time (MTW) and the Mean of Queue Lengths (MQL) are calculated for each algorithm in table 3. According to this table, the mean of the queue length and the mean of total waiting time of the results are nearly similar in the light, and the moderate traffic condition which are coloured in black. The important case appears in the heavy traffic conditions. Our algorithm achieves a better result than the other algorithms, especially in the unbalanced traffic conditions, where the input rate of one side is heavy and other methods show critical results. The mean total waiting time of the three algorithms are compared in Fig. 4. PCT and VA face difficulties in the more unbalanced condition and heavier input rate. However the proposed algorithm can deal with such conditions and achieve better results. The comparison of the mean of queue length of the three algorithms is illustrated in Fig. 5. In asymmetrical traffic increase from different directions, the proposed system can control traffic in shorter mean queue length and total waiting time.
In the last part of the experiment, we assessed the proposed algorithm for the traffic light control in 14 traffic conditions. The pedestrian arrival and the departure rates are simulated using Poisson distributions on each street based on the mean rates obtained from the video image dataset in different traffic, time, and illumination conditions which is captured by the transport and traffic organization. This part of the experiment is considered to assess the proposed pedestrian traffic light control system. The mean waiting time of pedestrians is shown in Fig. 6. This time is evaluated based on the difference between each pedestrian’s arrival time and the starting time of the next green phase of the pedestrian traffic light.
Table 4 The mean of total waiting, mean of queue length, and mean of total pedestrian waiting of fuzzy proposed algorithm
Traffic Condition
Algorithm Proposed Approach Without Pedestrian Traffic
Light Proposed Approach With Pedestrian Traffic Light
MQL MTW MTPW MQL MTW MTPW
1 1.71 7.81 9.46 1.75 7.93 9.46
2 29.81 69.5 34.12 36.31 77.05 22.45
3 293.84 496.27 59.32 313.18 480.41 30.31
4 34.24 71.71 26.16 36.68 71.43 20.68
5 28.54 60.14 26.4 36.66 56.35 20.67
6 21.34 45.17 25.44 34.4 38.31 20.62
7 21.78 47.31 28.06 35.23 44.01 20.96
8 27.85 66.66 42.54 30.32 63.61 25.19
9 29.30 77.77 42.92 30.11 65.59 25.32
10 24.03 49.67 43 27.03 48.14 25.37
11 33.19 86.47 42.92 37.09 80.93 25.22
12 1.29 7.05 17.29 1.38 7.41 16.78
13 229.71 367.58 56.58 244.52 352.68 29.44
14 38.84 74.85 44.81 47.27 78.14 26.44
Fig. 4. The mean total waiting time Fig. 5. The mean of queue length
5. Conclusions
Traffic is an issue that many big cities are confronted with because of the ever-increasing population. In this paper, we proposed a two phase traffic light control system based on fuzzy Q-learning for an isolated 4-way intersection. A fuzzy algorithm sets the Q-learning variables. The proposed algorithm benefits from fuzzy system advantages and can learn fuzzy rules using environmental interactions. Before the end of each phase, the next green optimum phase durations estimated based on the current traffic conditions are specified. The proposed system operates based on the detection of pedestrians and vehicles in video frames captured by cameras installed on the intersection and then perform accurate counting of pedestrians and vehicles. A pedestrian number estimation method is employed to find a mathematical relationship between the global texture features of a crowded scene and the number of people in the scene. Also, the vehicle number estimation algorithm is proposed to determine the traffic density using visual information. A dynamic background subtraction technique for vehicle detection has been used to achieve better
detection efficiency. This algorithm was compared with two other algorithms, namely VA and PCT, for a period of one hour for each of 14 different traffic conditions. As shown in the results, the proposed algorithm surpassed the other algorithms both in term of waiting time and queue length significantly in heavy traffic and unbalanced traffic conditions, whereas in other situations the three algorithms were similar.
References
[1] M. Jalali Moghaddam, E. Shaabani, and R. Safabakhsh, “Crowd density estimation for outdoor environment”’. In Proceedings of the 8th International Conference on Bioinspired Information and Communications Technologies. ICST (Institute for Computer Sciences, Social-Informatics and Telecommunications Engineering), December 2014, pp. 306-310.
[2] A. Ghasemi, and R. Safabakhsh, “A real-time multiple vehicle classification and tracking system with occlusion handling”. IEEE 8th International Conference on Table 2. Intersection traffic conditions [40]
Traffic condition
state Input rate description
North south east west
balanced
1 0.25 0.25 0.25 0.25 Light traffic
2 0.5 0.5 0.5 0.5 Moderate traffic
3 0.75 0.75 0.75 0.75 Heavy traffic
Unbalanced
4 0.25 0.5 0.5 0.5 North has light traffic and south, east and west have moderate traffic
5 0.5 0.25 0.25 0.25 North has moderate traffic and south, east and west have light traffic
6 0.5 0.5 0.25 0.5 East has light traffic and north, south and west have moderate traffic
7 0.5 0.5 0.5 0.25 west has light traffic and north, south and east have moderate traffic
8 0.75 0.25 0.25 0.25 North has heavy traffic and south, east and west have light traffic
9 0.25 0.75 0.25 0.25 South has heavy traffic and north, east and west have light traffic
10 0.25 0.25 0.75 0.25 east has heavy traffic and north, south and west have light traffic
11 0.25 0.25 0.25 0.75 west has heavy traffic and north, south and east have light traffic
complementary
12 0.25 0.5 0.25 0.5 North and east have light traffic and south and west have moderate traffic
13 0.75 0.5 0.75 0.5 North and east have heavy traffic and south and west have moderate traffic
14 0.25 0.75 0.25 0.75 North and east have light traffic and south and west have heavy traffic
Table 3. The mean of total waiting and mean of queue length of diffrent algorithms.
Traffic Condition
Algorithm
Proposed Approach PCT VA
MQL MTW MQL MTW MQL MTW
1 1.71 7.81 1.8 6.74 1.46 5.49
2 29.81 69.5 26.53 55.05 34.28 78.72
3 293.84 496.27 447.85 603.52 397.09 592.21
4 34.24 71.71 28.01 57.56 29.91 84.06
5 28.54 60.14 27.75 57.64 24.08 64.45
6 21.34 45.17 22.91 47.03 22.42 51.97
7 21.78 47.31 26.7 54.64 25.62 63.46
8 27.85 66.66 121.67 164.6 84.22 135.28
9 29.30 77.77 105.07 145.61 85.16 136.3
10 24.03 49.67 103.36 145.82 81.07 143.28
11 33.19 86.47 107.43 145.69 72.42 117.97
12 1.29 7.05 1.09 5.26 1.1 5.43
13 229.71 367.58 246.06 349.97 237.38 367.6
Intelligent Computer Communication and Processing, Romania, Sep 2012, pp. 109-115.
[3] A. Ghasemi, and R. Safabakhsh, “Unsupervised foreground-background segmentation using growing self-organizing map in noisy background”. 3rd International Conference on Computer Research and Development, Shanghai, China, March 2010, pp. 334-338.
[4] A. S. Kalaki, and R. Safabakhsh, “Current and adjacent lanes detection for an autonomous vehicle to facilitate obstacle avoidance using a monocular camera”. 2014 Iranian Conference on Intelligent Systems (ICIS), IEEE, February 2014, pp. 1-6.
[5] A. S. Kalaki, and R. Safabakhsh, “Vision based real-time lane and obstacle detection and tracking in intelligent vehicles”. 13th International Conference on Traffic and Transportation Engineering, Tehran, Iran, February 2014, pp. 25-26.
[6] M. Keyarsalan, and A. Gholam, “Designing an intelligent ontological system for traffic light control in isolated intersections”, Engineering Applications of Artificial Intelligence, vol. 24, no. 8, pp. 1328-1339, 2011. [7] WEBSTE COBBE, 1996,WEBSTER F. V., COBBE B.
M. (1996). Technical Paper 56: Traffic Signals
[8] M. Dotoli, M. P. Fanti, and C. Meloni, “A signal timing plan formulation for urban traffic control”, Control Engineering Practice, vol. 14, no. 11, pp. 1297-1311, 2006.
[9] R. H. Smith, and D C. Chin, “Evaluation of an adaptive traffic control technique with underlying system changes”. Proceedings of the 27th conference on Winter simulation. IEEE Computer Society, 1995, pp. 1124-1130.
[10] R. Hoyer, and U. Jumar, “Fuzzy control of traffic lights’. In Fuzzy Systems, IEEE World Congress on Computational Intelligence., Proceedings of the Third IEEE Conference on Computational Intelligence, June 1994, pp. 1526-1531.
[11] W. Hejun, and M. Changyun, “Design of intelligent traffic light control system based on traffic flow”. In 2010 International Conference on Computer and Communication Technologies in Agriculture Engineering, 2010, 3, pp. 368-371.
[12] M. Arora, and V. K. Banga, “Intelligent traffic light control system using morphological edge detection and fuzzy logic”. In International Conference on Intelligent Computational Systems (ICICS'2012), January 2012, pp. 7-8.
[13] T. Tari, L. T. Kóczy, C. Gáspár, et al. “Control of traffic lights in high complexity intersections using hierarchical interpolative fuzzy methods”. In Fuzzy Systems, 2006 IEEE International Conference, 2006, pp. 1045-1048. [14] M. Shakeri, H. Deldari, A. Rezvanian, et al. “A novel
fuzzy method to traffic light control based on unidirectional selective cellular automata for urban traffic”. 11th International Conference on Computer and Information Technology, 2008, pp. 300-305.
[15] B. Abdulhai, R. Pringle, and G. J. Karakoulas, “Reinforcement learning for true adaptive traffic signal control”, Journal of Transportation Engineering, vol. 129, no. 3, pp. 278-285, 2003.
[16] M. Abdoos, N. Mozayani, A. L. Bazzan, “Traffic light control in non-stationary environments based on multi agent Q-learning”. Intelligent Transportation Systems (ITSC),2011 14th International IEEE Conference, 2011, pp. 1580-1585.
[17] T. Riedel, and U. Brunner, “Traffic control using graph theory”, Control Engineering Practice, vol. 2, no. 3, pp. 397-404, 1994.
[18] Q. Liu, and J. Xu, “Traffic signal timing optimization for isolated intersections based on differential evolution bacteria foraging algorithm”, Procedia-Social and Behavioral Sciences, vol. 43, pp. 210-215, 2012. [19] P. Choudekar, S. Banerjee, and M. K. Muju,
“Implementation of image processing in real time traffic light control”. In Electronics Computer Technology (ICECT), 2011 3rd International Conference on, April 2011, pp. 94-98.
[20] Y. Dujardin, F. Boillot, D. Vanderpooten, et al. “Multiobjective and multimodal adaptive traffic light control on single junctions”. InIntelligent Transportation Systems (ITSC), 2011 14th International IEEE Conference, October 2011, pp. 1361-1368.
[21] M. J. Moghaddam, M. Hosseini, and R. Safabakhsh, “Traffic light control based on fuzzy Q-leaming”. In 2015 The International Symposium on Artificial Intelligence and Signal Processing (AISP), IEEE, pp. 124-128, March 2015.
[22] A. L. Bazzan, D. de Oliveira, and B. C. da Silva, “Learning in groups of traffic signals”, Engineering Applications of Artificial Intelligence, vol. 23, no. 4, pp. 560-568, 2010.
[23] S. Mikami, and Y. Kakazu, “Genetic reinforcement learning for cooperative traffic signal control”. In Evolutionary Computation, IEEE World Congress on Computational Intelligence., Proceedings of the First IEEE Conference, June 1994, pp. 223-228.
[24] F. Zhu, , H. A. Aziz, X. Qian, et al. “A junction-tree based learning algorithm to optimize network wide traffic control: A coordinated multi-agent framework”, Transportation Research Part C: Emerging Technologies, vol. 58, pp. 487-501, 2015
[25] B. Cesme, and P. G. Furth, “Self-organizing traffic signals using secondary extension and dynamic coordination’. Transportation Research Part C: Emerging Technologies, 48, pp. 1-15, 2014.
[26] A. Stevanovic, J. Stevanovic, J. So, et al. “Multi-criteria optimization of traffic signals: Mobility, safety, and environment”, Transportation Research Part C: Emerging Technologies, vol. 55, pp. 46-68, 2015. [27] D. Pescaru, and D. I. Curiac, “Ensemble based traffic
light control for city zones using a reduced number of sensors”, Transportation Research Part C: Emerging Technologies, vol. 46, pp. 261-273, 2014.
[28] T. Le, P. Kovács, N. Walton, et al. “Decentralized signal control for urban road networks”, Transportation Research Part C: Emerging Technologies, vol. 58, pp. 431-450, 2015
[29] Z. Cong, B. De Schutter, and R. Babuška, “Co-design of traffic network topology and control measures”,
[30] D. Sun, R. F. Benekohal, and S. T. Waller, “Bi‐level programming formulation and heuristic solution approach for dynamic traffic signal optimization”,
Computer‐Aided Civil and Infrastructure Engineering,
vol. 21, no. 5, pp. 321-333, 2006.
[31] J. Li, Y. Zhang, and Y. Chen, “A self-adaptive traffic light control system based on speed of vehicles. Software Quality, Reliability and Security Companion (QRS-C), 2016 IEEE International Conference, August 2016, pp. 382-388.
[32] L. Qi, M. Zhou, and W. Luan, “Emergency traffic-light control system design for intersections subject to accidents”. IEEE Transactions on Intelligent Transportation Systems, vol. 17, no. 1, pp. 170-183, 2016.
[33] Z. Cao, S. Jiang, J. Zhang, and H. Guo, “A unified framework for vehicle rerouting and traffic light control to reduce traffic congestion. “IEEE Transactions on Intelligent Transportation Systems, vol, 18, no. 7, pp. 1958-1973,2016
[34] J. L. Fleck, C. G. Cassandras, and Y. Geng, “Adaptive quasi-dynamic traffic light control”. IEEE Transactions on Control Systems Technology, vol. 24, no. 3, pp. 830-842, 2016.
[35] R. S. Sutton, and A. G. Barto, Reinforcement learning: An introduction, vol. 2, no. 4. Cambridge: MIT press, 1998.
[36] T. N. Tan, “Texture feature extraction via visual cortical channel modelling’. In Proceedings., 11th IAPR International Conference on Pattern Recognition, August 1992, pp. 607-610.
[37] ‘LS-SVMlab version 1.8’, http://www.esat. kuleuven. be /sista/lssvmlab/, accessed 1 March 2015.
[38] C. Stauffer, and W. E. L. Grimson, “Adaptive background mixture models for real-time tracking”. In Proceedings. 1999 IEEE Computer Society Conference on Computer Vision and PatternRecognition (Cat. No PR00149), vol. 2, pp. 246-252, IEEE, June 1999.
[39] A. Bonarini, A. Lazaric, F. Montrone, et al. “Reinforcement distribution in fuzzy Q-learning”, Fuzzy Sets and Systems, vol. 160, no. 10, 1420-1443, 2009. [40] Y. Chong, C. Quek, and P. Loh, “A novel
neuro-cognitive approach to modeling traffic control and flow based on fuzzy neural techniques”, Expert Systems with Applications, vol. 36, no. 3, 4788-4803, 2009.
[41] M. Rezzai, et al. “Design and realization of a new architecture based on multi-agent systems and reinforcement learning for traffic signal control”, 2018 6th International Conference on Multimedia Computing and Systems (ICMCS). IEEE, 2018.

![Table 2. Intersection traffic conditions [40]](https://thumb-us.123doks.com/thumbv2/123dok_us/8944591.1853959/8.595.60.559.95.542/table-intersection-traffic-conditions.webp)
