University of New Orleans University of New Orleans
ScholarWorks@UNO
ScholarWorks@UNO
University of New Orleans Theses and
Dissertations Dissertations and Theses
5-20-2011
Actionable Visualization of Higher Dimensional Dynamical
Actionable Visualization of Higher Dimensional Dynamical
Processes
Processes
Sravan Kumar Pappu University of New Orleans
Follow this and additional works at: https://scholarworks.uno.edu/td
Recommended Citation Recommended Citation
Pappu, Sravan Kumar, "Actionable Visualization of Higher Dimensional Dynamical Processes" (2011). University of New Orleans Theses and Dissertations. 1336.
https://scholarworks.uno.edu/td/1336
This Thesis is protected by copyright and/or related rights. It has been brought to you by ScholarWorks@UNO with permission from the rights-holder(s). You are free to use this Thesis in any way that is permitted by the copyright and related rights legislation that applies to your use. For other uses you need to obtain permission from the rights-holder(s) directly, unless additional rights are indicated by a Creative Commons license in the record and/or on the work itself.
Actionable Visualization of Higher Dimensional Dynamical Processes
A Thesis
Submitted to the Graduate Faculty of the University of New Orleans
In partial fulfillment of the requirements for the degree of
Master of Science In
Computer Science Information Assurance
by
Sravan Kumar Pappu
Bachelor of Technology, Jawaharlal Nehru Technological University, Hyderabad, India, 2007
ii
ACKNOWLEDGEMENT
Sincere thanks to all my friends and family members who provided valuable help and moral
support while working on this thesis. Special thanks to my Major Professor Dr. Daniel Bilar for
his excellent guidance and timely feedback without which this thesis would not have been
possible. I also would like to extend thanks to Dr. Golden Richard III and Dr. Adlai DePano for
iii
Contents
List of Figures………..v
Abstract……….vi
Chapter 1. Introduction ... 1
Chapter 2. Related Work ... 4
2.1 Rich Static Data Representation ... 4
2.2 Dynamic Data Representation ... 5
Chapter 3. Design ... 6
3.1 Languages and Packages Used in Developing the Model ... 6
3.2 Overview of Approach ... 6
Chapter 4: Implementation ... 10
4.1 Categorization of Calls ... 11
4.2 Implementation of Application View ... 12
4.3 Implementation of DLL View ... 13
4.4 Implementation of Function View ... 15
4.5 Implementation of B-Matrix View ... 16
Chapter 5: Results ... 20
5.1 Results of DLL View ... 20
5.2 Result of Function View... 23
iv
Chapter 6: Conslusions and Future Work ... 25
6.1 Conclusions..……….………..………….…………..……25
6.2 Future Work ……….………..26
Appendix A: Code for DLL View ... 27
Appendix B: Code for Function View ... 35
Appendix C: Code for B-matrix Construction ... 40
Bibliography ... 44
v
List of Figures
Figure 1 : Minard Map of Napolean March, Moscow Source, Tufte (1983) ... 1
Figure 2 Florence Nightingale's Rose Petal Diagram ... 2
Figure 3 Time Magazine ... 4
Figure 4: Globe View Starmine ... 5
Figure 5 Visualizing Sasser Worm using Starmine ... 5
Figure 6 Screenshot of the Norman Sandbox Analyzer ... 8
Figure 7 Kernel Layout ... 111
Figure 8 Illustration of B-Matrix ... 17
Figure 9 Plot of B-Matrix ... 19
Figure 10 DLL View of all 3 calls ... 200
Figure 11 Shows that at time5 6.25% of calls belong to other call in a.dll ... 211
Figure 12 Shows that at time 3 22.12% of calls belong to System call in k.dll ... 222
Figure 13 Shows that function iewru() has been called 59 times by the application. ... 233
Figure 14 B-Matrix view of a 174 node real time network ... 244
vi
Abstract
Analyzing modern day’s information systems that produce humongous multi-dimensional data in form of logs, traces or events that unfold over time can be tedious without adequate visualization, thereby, advocating the need for an intelligible visualization. This thesis researched and developed a visualization framework that represents multi-dimensional dynamic and temporal process data in a potentially intelligible and actionable form.
A prototype showing four different views using notional malware data abstracted from Normal Sandbox behavioral traces were developed. In particular, the B-matrix view representing the DLL files used by the malware to attack a system. This representation is aimed at visualizing large data sets without losing emphasis on the process unfolding over multiple dimensions.
Keywords
Intelligible Visualization
Data Visualization
B-matrix
DLL View
Application View
1
Chapter 1. Introduction
The potential of Information Visualization and its far-reaching usage has seen a drastic rise in the
last two decades. Even though the availability and advancements in computer technologies have
been the major factor, one of the classic examples of information visualization was done by
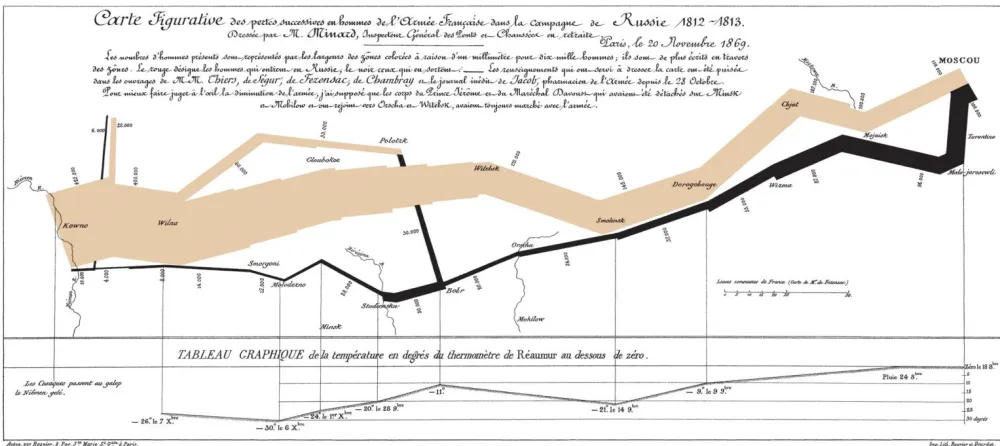
Monsieur Minard, long before the invention of the computer. As Napoleon’s mapmaker, he
depicted the easterly movement of Napoleon’s troops from the Polish-Russian border towards
Moscow and their retreat.
Figure 1 : Minard Map of Napoleon’s March, Moscow Source, Tufte (1983)
The above diagram illustrates all the minute details of Napoleon’s march, which is a rich
example of encoding multiple dimensions in a single representation. In the above figure, the
thickness of the lines indicate the number of soldiers marching, brown indicates the forward
march and black indicates their retreat. Temperature during their retreat is indicated at the
2
The second example is taken from a report written by Florence Nightingale (1858) to the British
government in which she records the improvements she made to the ghastly hospitals in Scutari
during the Crimean war of 1858 [1].
Figure 2 Florence Nightingale's Rose Petal Diagram
Source: http://upload.wikimedia.org/wikipedia/commons/1/17/Nightingale-mortality.jpg
In the above figure, the area is proportional to the number of deaths in the hospital and the angle
is proportional to the number of days in a month. Just by a glance at the figure, one can
immediately trace out the improvements in the subsequent months because of the reforms she
has introduced. For comparison, the inner circle constitutes data related to a military hospital in
England.
There are many more such examples which form a base for modern visualizations. According to
the dictionary, the definition of visualization is to form a mental model or mental image of
3
The role of computers in the field of Information Visualization is prominent. Some of the reasons
are:
(i) Increase of inexpensive and rapid access memory makes possible the storage of
vast datasets.
(ii) Increase of fast computation allows quick selection of data subsets for easy
exploration.
(iii) Availability of high-resolution graphic displays ensures that the presentation of
data matches the power of human visual and cognitive system.
Information Visualization can be applied to a wide variety of fields like house insurances,
pharmaceuticals, social networks, Information Security etc. Hence, human perception when
integrated with the power of computing technologies would result in potential visualization of
4
Chapter 2. Related Work
2.1 Rich Static Data Representation
Information Visualization is a rich field with a wide range of techniques that have been
successfully applied over many domains. Visualization of static data has been studied
extensively by Edward Tufte [2,3,4] and Robert Spence [1].
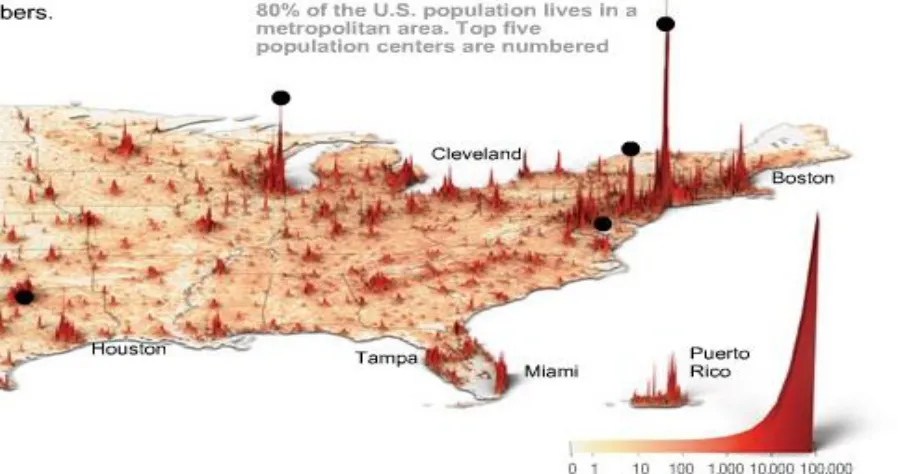
Figure 3 Time Magazine
Source: http://www.smashingmagazine.com/2007/08/02/data-visualization-modern-approaches/
The above figure is a good example of high-dimensional, parsimonious, well-bound, specific
data visualization. We can discriminate at least five data dimensions: Population density,
absolute x/y location and relative x/y distances. But it would be more useful if it showed an
evolution through time, i.e. actionable in nature. There are a few tools that have been developed
such as implementation of Parallel Coordinate Plot [7] and Andrew’s Plot [8], which can
represent up to 20 dimensions, but they still lack action-ability. According to Paley [5] satisfying
properties like well-boundedness, Action-ability, Specificity, Parsimony, High-Dimensionality,
5
2.2 Dynamic Data Representation
Progress on dynamic data visualization has been slow. Recently, few tools have been developed
for real-time attack analysis on network traffic like Starmine, SecVis, Starlight. Starmine, for
example, focuses on cyber attacks and offers synchronized 3-D geographical, logical and
temporal views to show locations, scope of attacks and transitions respectively [6].
Figure 4: Globe View Starmine Figure 5 Visualizing Sasser Worm using Starmine
All these tools have common features like multi-dimensionality, multi-scale, state and process
oriented visualizations. But, it is clearly evident from Figures 4, 5 that, with increase in data
volume, visuals degenerate into saturated pixel blobs, obviating their usefulness. Hence, there is
6
Chapter 3. Design
3.1 Languages and Packages Used in Developing the Model
Flare: Flare is an Action Script library for creating visualizations that run in the Adobe Flash
Player. From basic charts and graphs to complex interactive graphics, the toolkit supports data
management, visual encoding, animation, and interaction techniques. Even better, flare features a
modular design that lets developers create customized visualization techniques without having to
reinvent the wheel [9]. It has been created by the Visualization Lab of UC Berkeley [10].
Java: Java is a programming language developed by SUN Microsystems. Java 1.6.0_23 has been
used to construct one of the views.
Pajek: Pajek is a program, for Windows, for analysis and visualization of large networks having
some tens or hundreds of thousands of vertices. In Slovenian language pajek means spider. Pajek
is developed by Vladimir Batagelj and Andrej Mrvar. Some procedures were also contributed by
Matjaž Zaveršnik [11].
MATLAB: MATLAB is a high-level language and interactive environment that enables to
perform computationally intensive tasks faster than with traditional programming languages
[12].
3.2 Overview of Approach
We have created notional malware data, abstracted from Norman sandbox behavioral traces. We
have planned to generate four different views for the data that has been created.
Application View: This view gives the overall structure of the application. It gives the entire
order in which the DLL files and functions are being called by the application. It has been
implemented using Flare.
DLL View: This view gives the cumulative calls each DLL file has received over a particular
7
Function View: This view gives the number of times each function has been called with in a
DLL file. It has been implemented using Flare.
B-Matrix Representation: This view plays a vital role in the entire model. Considering entire
application as a network, we constructed a network using Pajek and then constructed a B-Matrix
[13] for the network using Java. Finally, the B-matrix is plotted using MATLAB.
3.3 Setup
This model is developed with a Lenovo X201 laptop running Microsoft Windows 7 Professional
Edition. The laptop has an Intel® Core™ i5 CPU M520 @ 2.40GHz with 4GB of memory.
3.4 Data Samples
Data sample for the Application view and DLL view has been generated in a text file by studying
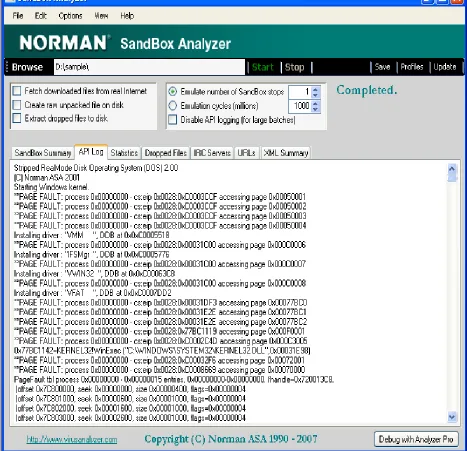
the data that has been produced by Norman Sandbox Analyzer. Sample interaction log of
Norman Sandbox Analyzer looks like below.
Partial log for Agobot.z
0x7C80D896=KERNEL32!SetCurrentDirectory ("C:\WINDOWS\TEMP\")
0x7C80D8B6=KERNEL32!WinExec ("C:\sample.exe",0x00000000)
0x7C804D75=KERNEL32!CreateProcessA
("C:\sample.exe",NULL,0x00000000,0x00000000,0x00000000,0x00000000,0x00000000,NULL
,0x00000000,0x00000000)
0x7C802220=KERNEL32!_lopen ("C:\sample.exe",0x00000000)
0x7C803FF0=KERNEL32!GetFileSize (0x00000078,0x00000000)
0x7C8022C4=KERNEL32!CloseHandle (0x00000078)
0x7C80D60F=KERNEL32!InternalExec ("C:\sample.exe",0x00000000,0x00000000)
0x7C80513C=KERNEL32!GetCurrentProcessId ()
**PAGE FAULT: process 0x00000000 - cs:eip 0x0008:0xD000499D accessing page
0x00072030
**PAGE FAULT: process 0x00000000 - cs:eip 0x0008:0xD000CA98 accessing page
0x00070019 .
8
Figure 6 Screenshot of the Norman Sandbox Analyzer
Source: Dynamic Behavioral Analysis of Malicious Software with Norman Sandbox by Danielle Shoemake
The data for Function view has been generated in JSON (JavaScript Object Notation) as it is a
light weight data interchange format. It is easy to read, write, parse and generate. It is a text
9
JSON is built on two structures [14]:
A collection of name/value pairs. In various languages, this is realized as an object,
record, struct, dictionary, hash table, keyed list, or associative array.
An ordered list of values. In most languages, this is realized as an array, vector, list, or
sequence.
Example:
[{"name":"flare.vis.animate","size":39,"imports":["flare.animate.Transitioner","flare.vis.d ata.DataList","flare.util.math.IMatrix","flare.analytics.cluster.MergeEdge","flare.analytic
s.cluster.HierarchicalCluster","flare.vis.data.Data"]},
{"name":"flare.vis.transitioner","size":12,"imports":["flare.analytics.cluster.Hierarchical
Cluster","flare.animate.Transitioner","flare.vis.data.DataList","flare.analytics.cluster.Mer
geEdge","flare.util.math.IMatrix"]}]
Data for the implementation of B-matrix view has been obtained from The Kansas Event Data
System (KEDS) project. KEDS uses automated coding of English-language news reports to
generate political event data focusing on the Middle East, Balkans, and West Africa. These data
are used in statistical early warning models to predict political change [15]. The dataset has been
downloaded from Pajek’s [16] test datasets by title GulfLDays.net which is directed
multi-relational temporal network with 174 vertices and 57131 arcs. From 'leads' Gulf event data,
granularity is 1 day.
Example:
*Vertices<number of vertices>
1”label1”
2”label2”
3”label3”
4”label4”
10
<vertex1><vertex2>
<vertex1><vertex3>
<vertex1><vertex4>
<vertex2><vertex4>
<vertex3><vertex4>
11
Chapter 4: Implementation
4.1 Categorization of Calls
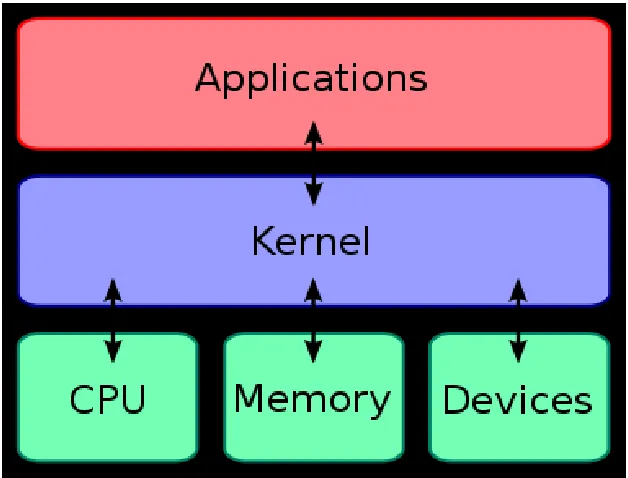
We have categorized all the calls made by the application during interaction with the kernel into
three types namely System call, Kernel call and Other calls.
System Call: These are the calls made when application requests kernel for a service for which
it do not have permission to run. This is an interaction between User mode and the Kernel mode.
Kernel Call: These are the calls made by the kernel of the Operating System to access some
services. This is an interaction with in the Kernel of the Operating System.
Other Call: These are the calls made by the application to access its hardware components
termed as I/O calls.
Figure 7 Kernel Layout
Source: http://en.wikipedia.org/wiki/Kernel_computing
12
4.2 Implementation of Application View
Application View has been implemented using Tree Layout of the Flare application. It places
nodes using a tidy node-link tree layout. The algorithm used is that of Christoph Buchheim,
Michael Jünger, and Sebastian Leipert from their research paper Improving Walker's Algorithm
to Run in Linear Time, Graph Drawing 2002. This algorithm corrects performance issues in
Walker's algorithm, which generalizes Reingold and Tilford's method for tidy drawings of trees
to support trees with an arbitrary number of children at any given node [17].
Public Method:
NodeLinkTreeLayout (orientation:String, depthSpace:Number = 50, breadthSpace:Number = 5, subtreeSpace:Number = 25)
Property Detail:
Breadth Spacing Property
breadthSpacing:Number [read-write]
The space between siblings in the tree.
Implementation
public function get breadthSpacing():Number
public function set breadthSpacing(value:Number):void
Depth Spacing Property
depthSpacing:Number [read-write]
The space between successive depth levels of the tree.
Implementation
public function get depthSpacing():Number
public function set depthSpacing(value:Number):void
Orientation Property
orientation:String [read-write]
13
Implementation
public function get orientation():String
public function set orientation(value:String):void
Subtree Spacing Property
subtreeSpacing:Number [read-write]
The space between different sub-trees.
Implementation
public function get subtreeSpacing():Number
public function set subtreeSpacing(value:Number):void
Application stands as the root node and all the three types of calls are divided into different sub
branches of the tree. The tree grows downward with the respective calls in each sub type.
4.3 Implementation of DLL View
DLL View has been implemented using Stacked Area Layout of the Flare Application. It is
layout that consecutively places items on top of each other. The layout currently assumes that
each column value is available as separate properties of individual DataSprites [18].
Public Method:
StackedAreaLayout(cols:Array = null, padding:Number = 0.05)
Property Detail:
Columns Property
columns:Array [read-write]
14
Implementation
public function get columns():Array
public function set columns(value:Array):void
Normalize Property
normalize:Boolean [read-write]
Flag indicating if the visualization should be normalized.
Implementation
public function get normalize():Boolean
public function set normalize(value:Boolean):void
Orientation Property
orientation:String [read-write]
The orientation of the layout.
Implementation
public function get orientation():String
public function set orientation(value:String):void
Padding Property
padding:Number [read-write]
Value indicating the padding (as a percentage of the view) that should be reserved within the
visualization.
Implementation
public function get padding():Number
public function set padding(value:Number):void
Scale Property
15
The scale used to layout the stacked values.
Implementation
public function get scale():QuantitativeScale
public function set scale(value:QuantitativeScale):void
Threshold Property
threshold:Number [read-write]
Threshold size value (in pixels) that at least one column width must surpass for a stack to remain
visible.
Implementation
public function get threshold():Number
public function set threshold(value:Number):void
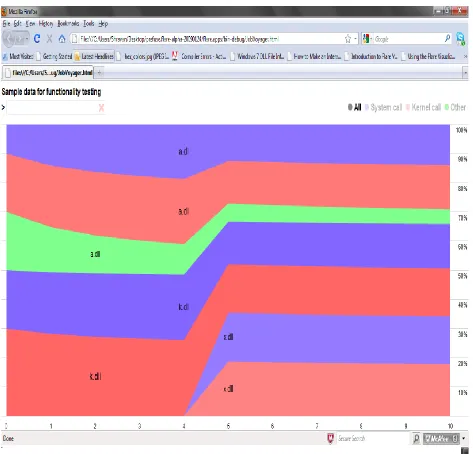
This visualization shows stacked time series of all the DLL files that have been called by the
application with respect to all three different types of calls. It shows all the cumulative calls for a
particular DLL over a period of time. We can also see the DLL files called by a particular mode
of call say like System Call. There is also a search box which shows a particular DLL file
properties.
4.4 Implementation of Function View
Function View has been implemented using TreeMap Layout of the Flare application. It is a
layout that places node in a TreeMap layout that optimizes for low aspect ratios of visualized tree
nodes. TreeMaps are a form of space-filling layout that represents nodes as boxes on the display,
with children nodes represented as boxes placed within their parent's box. This layout determines
the area of nodes in the tree map by looking up the size field property on leaf nodes. By default,
this property is "size", such that the layout will look for size values in the DataSprite.Size
property. This particular algorithm is taken from Bruls, D.M., C.Huizing, and J.J. Van Wijk,
"Squarified Treemaps" [19,20].
16
TreeMapLayout (sizeField:String = "size")
Property Detail:
Size Field Property
sizeField:String [read-write]
The property from which to access size values for leaf nodes.
Implementation
public function get sizeField():String
public function set sizeField(value:String):void
This particular visualization shows all the functions called in a particular DLL file. Area of the
tile depends on the number of times the function has been called while running the application. It
shows the count of the function calls when the mouse is hovered over the tile in the visualization.
4.5 Implementation of B-Matrix View
B-matrix is a matrix structure to characterize large complex networks, which is unique for a
network. It encodes structural information and gives scope for rigorous statistical comparisons
on networks. We can say B-matrix as a signature for a particular network. It is independent of
node labeling and all isomorphs have same B-matrix. This particular algorithm has been
implemented from Portraits of complex networks by J.P.Bagrow, E.M.Bollt, J.D.Skufca and
D.Ben-Avraham [13].
Defining B-matrix, it is the number of nodes that have exactly k members in their respective
l-shells.
17
Finding all the k-neighbors of a particular node gives us all the k-members that are present in the
respective l-shells of a node. Hence, found all the k-neighbors using Pajek for the network
generated and constructed B-matrix.
Example:
Figure 8 Illustration of B-Matrix
Node Reference: 1- Julie
2- Graham
3- Frances
4- Diana
5- Angela
6- Heidi
7- Edward
8- Bot
9- Charles
18
B-Matrix:
[0 0 0 3 4 2 0 1
0 0 1 1 2 5 1 0
6 4 0 0 0 0 0 0]
If we consider the 5th element of the 1st row, it says that there are 4 nodes that have
exactly 4 members in their 1st shell (at a distance of 1).
If we consider the 6th element of the 2nd row, it says that there are 5 nodes that have
exactly 5 members in their 2nd shell.
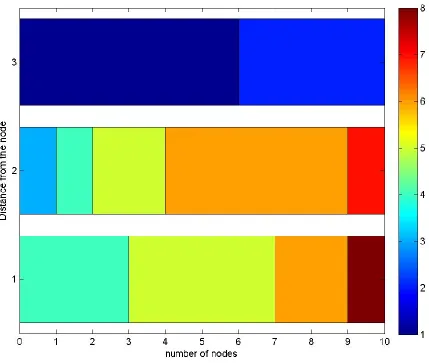
Graph:
Plot for the B-matrix has been generated using MATLAB. It is represented as horizontal stacked
bar graph with a color map, to improve the readability.
Syntax:
barh(Y,'stacked')
'stacked' displays one bar for each row in Y. The bar height is the sum of the elements in the
row. Each bar is multicolored, with colors corresponding to distinct elements and showing the
19
Figure 9 Plot of B-Matrix
As B-matrix of a network is unique, it is implied that if there are any structural changes in the
network, it generates a new B-matrix. So any changes to an application can be identified easily.
20
Chapter 5: Results
5.1 Results of DLL View
As explained earlier, DLL View gives the cumulative percentage of DLL files that have been
processed during execution an application over a time period.
21
On the right hand side of the above figure, there are four radio buttons, which when selected
gives the information about all the calls or a particularly selected kind of call.
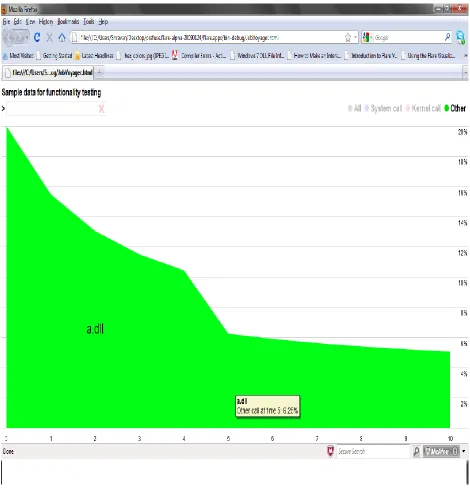
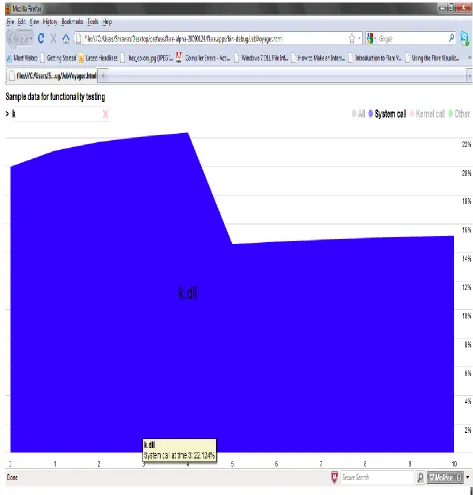
22
On the left side of the above figure, there is a tab for searching a particular DLL file, which in
turn gives you the total calls on that particular DLL or whichever is selected.
23
5.2 Result of Function View
If we click on the DLL view, Function view appears. It shows all the functions called in a
particular DLL file with number of times the function has been called by the application.
24
5.3 Result of B-Matrix View
It has been generated on 174 node network of real-time data.
25
Chapter 6: Conclusions and Future Work
6.1 Conclusions
We find that, a lot of information can be read from all these views. All the views with the
exception of the B-matrix view provide the information about any application with intelligible
and dynamic behavior. B-matrix view gives us the information about the application structure. If
something malicious is being done using the application, then there would be obvious difference
in the B-matrix of the application. If we compare both the B-matrices then we can clearly
identify which DLL file is being used by the application to do something malicious on the
System. One more check to find the location of attack is, the sum of every row must be equal to
the number of nodes in the network. We can jump to the row whose row sum is not equal to
number of nodes and can find the target easily.
26
Hence, we conclude that our model can be used potentially for visualizing and detecting the
malicious attacks through applications.
6.2 Future Work
The Aurora malware operation was identified recently and made public by Google and McAfee.
This malware operation has been associated with intellectual property theft including source
code and technical diagrams (CAD, oil exploration bid-data, etc) [21]. The key idea of any
malware to perform malicious operation on a system is its usage of system internal files and DLL
files.
According to the research done by HB Gary Inc., operation Aurora is no way different, as it
creates DLL files in the process to access the system’s intellectual information through remotely
characterized backdoor. It uses embedded DLL’s present in the dropper to start the malicious
action on the system. Before the deletion of the dropper from the system, it initiates the payload
for execution. Finally, payload executes and establishes a connection to a control server which is
selected randomly using https communication using port 443. They have run the malware on
several test samples and recorded its behavior. Looking at the data they have collected, it is clear
that, all those behavioral traces can be collected from the Norman Sandbox Analyzer.
Hence, all the four views of this model might provide potential analysis regarding the attack in a
visualized manner, which would be helpful in developing anti-threat models. Analyzing
Operation Aurora’s structure through its behavioral traces collected from a sandbox is intended
27
Appendix A: Code for DLL View
package flare.apps{
import flare.animate.Transitioner; import flare.apps.PackageMap; import flare.data.DataSet; import flare.data.DataSource; import flare.display.TextSprite; import flare.query.methods.eq; import flare.query.methods.iff; import flare.util.Orientation; import flare.util.Shapes; import flare.util.Strings; import flare.vis.Visualization;
import flare.vis.controls.ClickControl; import flare.vis.controls.HoverControl; import flare.vis.controls.TooltipControl; import flare.vis.data.Data;
import flare.vis.data.DataSprite; import flare.vis.data.NodeSprite; import flare.vis.events.SelectionEvent; import flare.vis.events.TooltipEvent; import flare.vis.legend.Legend; import flare.vis.legend.LegendItem;
import flare.vis.operator.filter.VisibilityFilter; import flare.vis.operator.label.StackedAreaLabeler; import flare.vis.operator.layout.StackedAreaLayout; import flare.widgets.ProgressBar;
import flare.widgets.SearchBox; import flash.display.Shape; import flash.events.Event;
import flash.filters.DropShadowFilter; import flash.geom.Rectangle;
import flash.net.URLLoader; import flash.text.TextFormat;
[SWF(backgroundColor="#ffffff", frameRate="30")] publicclass Dll view extends App
{
28
privatevar _fmt:TextFormat = new TextFormat("Helvetica,Arial",16,0,true); privatevar _dur:Number = 1.25; // animation duration
privatevar _t:Transitioner; privatevar _query:Array;
privatevar _filter:String = "All"; privatevar _exact:Boolean = false;
privatevar _url:String = "C:/Users/Shravan/Desktop/sample.txt"; privatevar _cols:Array = [0,1,2,3,4,5,6,7,
8,9,10];
privatevar _titleText:String =
"Sample data for functionality testing";
protectedoverridefunction init():void {
addChild(_bar = new ProgressBar());
_bar.bar.filters = [new DropShadowFilter(1)];
var ds:DataSource = new DataSource(_url, "tab"); var ldr:URLLoader = ds.load();
_bar.loadURL(ldr, function():void {
// get loaded data, reshape for stacked columns
var ds:DataSet = ldr.data as DataSet;
//var dr:Array = buildData(ds.nodes.data);
var dr:Array = reshape(ds.nodes.data, ["dll","type"], "time", "hits", _cols);
visualize(Data.fromArray(dr)); _bar = null;
}); }
privatefunction visualize(data:Data):void {
// prepare data with default settings and sort
data.nodes.sortBy("data.dll" ,"data.type"); data.nodes.setProperties({ shape: Shapes.POLYGON, lineColor: 0, fillValue: 1, fillSaturation: 0.5 });
// expression sets male -> blue, female -> red
data.nodes.setProperty("fillHue", iff(eq("data.type",1), 0.7, iff(eq("data.type",2),0,0.35)));
// define the visualization
_vis = new Visualization(data);
// first, set the visibility according to the query
29
_vis.operators[0].immediate = true; // filter immediately! // second, layout the stacked chart
_vis.operators.add(new StackedAreaLayout(_cols, 0));
_vis.operators[1].scale.labelFormat = "0.####%"; // show as percent // third, label the stacks
_vis.operators.add(new StackedAreaLabeler("data.dll"));
// fourth, set the color saturation for the current view
_vis.operators.add(new SaturationEncoder());
// initialize y-axis labels: align and add mask
_labelMask = new Shape();
_vis.xyAxes.addChild(_labelMask); // hides extreme labels
_vis.xyAxes.yAxis.labels.mask = _labelMask;
_vis.xyAxes.yAxis.verticalAnchor = TextSprite.TOP; _vis.xyAxes.yAxis.horizontalAnchor = TextSprite.RIGHT; _vis.xyAxes.yAxis.labelOffsetX = 50; // offset labels to the right
_vis.xyAxes.yAxis.lineCapX1 = 15; // extra line length to the left
_vis.xyAxes.yAxis.lineCapX2 = 50; // extra line length to the right
_vis.xyAxes.showBorder = false;
// place and update
_vis.update(); addChild(_vis);
// add mouse-over highlight
_vis.controls.add(new HoverControl(NodeSprite,
// move highlighted node to be drawn on top
HoverControl.MOVE_AND_RETURN,
// highlight node to full saturation
function(e:SelectionEvent):void {
e.node.props.saturation = e.node.fillSaturation; e.node.fillSaturation = 1;
},
// return node to previous saturation
function(e:SelectionEvent):void {
e.node.fillSaturation = e.node.props.saturation; }
));
// add filter on click
_vis.controls.add(new ClickControl(NodeSprite, 1,
// set search query to the dll name
function(e:SelectionEvent):void {
//_exact = true; // force an exact search //_search.query = e.node.data.dll;
addChild(_package = new PackageMap()); _vis.alpha = 0;
30
));
// add tooltips
_vis.controls.add(new TooltipControl(NodeSprite, null,
// update on both roll-over and mouse-move
updateTooltip, updateTooltip));
// add title and search box
addControls(); layout(); }
privatefunction updateTooltip(e:TooltipEvent):void {
// get current time value from axes, and map to data
var yr:Number = Number(
_vis.xyAxes.xAxis.value(_vis.mouseX, _vis.mouseY)); var time:String = (Math.round(yr)).toString();
var def:Boolean = (e.node.data[time] != undefined);
TextSprite(e.tooltip).htmlText = Strings.format( "<b>{0}</b><br/>{1} call at time {2}: "+(def?"{3:0.###%}":"<i>{3}</i>"),
e.node.data.dll, e.node.data.type==1?"System": e.node.data.type==2?"Kernel":"Other",
time, (def ? e.node.data[time] : "Missing Data"));
}
publicoverridefunction resize(bounds:Rectangle):void {
if (_bar) {
_bar.x = bounds.width/2 - _bar.width/2; _bar.y = bounds.height/2 - _bar.height/2; }
bounds.width -= (15 + 50); bounds.height -= (75 + 25); bounds.x += 15;
bounds.y += 75; _bounds = bounds; layout();
}
privatefunction layout():void {
if (_vis) {
// compute the visualization bounds
31
// mask the y-axis labels to hide extreme animation
_labelMask.graphics.clear(); _labelMask.graphics.beginFill(0);
_labelMask.graphics.drawRect(_vis.bounds.right, _vis.bounds.top, 60, 1+_vis.bounds.height);
// update
_vis.update(); }
if (_title) {
_title.x = -1;
_title.y = _bounds.top - _title.height - 45; }
if (_search) {
_search.x = 0;
_search.y = _title.y + _title.height + 4; }
if (_gender) {
_gender.x = stage.stageWidth - _gender.width; _gender.y = _search.y;
}
}
/** Filter function for determining visibility. */ privatefunction filter(d:DataSprite):Boolean {
if (_filter == "System call" && d.data.type != 1) { returnfalse;
} elseif (_filter == "Kernel call" && d.data.type != 2) { returnfalse;
}elseif (_filter == "Other" && d.data.type != 3) { returnfalse;
}elseif (!_query || _query.length==0) { returntrue;
} else {
var s:String = String(d.data["dll"]).toLowerCase(); for each (var q:String in _query) {
var len:int = q.length; if (len == 0) continue;
if (!_exact && s.substr(0,len)==q) returntrue; if (_exact && q==s) returntrue;
}
returnfalse; }
}
/** Callback for filter events. */
32
{
_query = _search.query.toLowerCase().split(/\|/);
if (_query.length==1 && _query[0].length==0) _query.pop();
if (_t && _t.running) _t.stop(); _t = _vis.update(_dur);
_t.play();
_exact = false; // reset exact match after each search
}
//
---privatefunction addControls():void {
// create title
_title = new TextSprite("", _fmt, TextSprite.DEVICE); _title.htmlText = _titleText;
_title.textField.selectable = false; addChild(_title);
// create search box
_search = new SearchBox(_fmt, ">", 250); _search.borderColor = 0xdedede;
_search.input.tabIndex = 0;
_search.input.restrict = "a-zA-Z \\-";
_search.addEventListener(SearchBox.SEARCH, onFilter); addChild(_search);
// create gender filter
_gender = Legend.fromValues(null, [ {label:"All", color:0xff888888},
{label:"System call", color:0xff8888ff}, {label:"Kernel call", color:0xffff8888}, {label:"Other", color:0x3DD00} ]);
_gender.orientation = Orientation.LEFT_TO_RIGHT; _gender.labelTextFormat = _fmt;
_gender.margin = 3;
_gender.setItemProperties({buttonMode:true, alpha:0.3}); _gender.items.getChildAt(0).alpha = 1;
_gender.update(); addChild(_gender);
// change alpha value on legend mouse-over
new HoverControl(LegendItem, 0,
33
var li:LegendItem = LegendItem(e.object); if (li.text != _filter) li.alpha = 0.3;
}
).attach(_gender);
// filter by gender on legend click
new ClickControl(LegendItem, 1, function(e:SelectionEvent):void { _gender.setItemProperties({alpha:0.3});
e.object.alpha = 1;
_filter = LegendItem(e.object).text; onFilter();
}).attach(_gender); }
//
---publicstaticfunction reshape(tuples:Array, cats:Array, dim:String,
measure:String, cols:Array, normalize:Boolean=true):Array
{
var t:Object, d:Object, val:Object, name:String; var data:Array = [], names:Array = []
var totals:Object = {};
for each (val in cols) totals[val] = 0;
// create data set
for each (t in tuples) {
// create lookup hash for tuple
var hash:String = "";
for each (name in cats) hash += t[name];
if (names[hash] == null) {
// create a new data tuple
data.push(d = {});
for each (name in cats) d[name] = t[name]; d[t[dim]] = t[measure];
names[hash] = d; } else {
// update an existing data tuple
names[hash][t[dim]] = t[measure]; }
totals[t[dim]] += t[measure]; }
// zero out missing data
for each (t in data) {
34
if (!t[name]) t[name] = 0; // zero out null entries
if (normalize)
t[name] /= totals[name]; // normalize
if (t[name] > max) max = t[name]; }
t.max = max; }
return data; }
} // end of class Stacks
}
import flare.animate.Transitioner; import flare.vis.data.DataSprite; import flare.vis.operator.Operator;
class SaturationEncoder extends Operator {
publicoverridefunction operate(t:Transitioner=null):void {
t = (t ? t : Transitioner.DEFAULT); var m:Number=0, f:Number=0;
// first pass: determine maximum visible value
visualization.data.nodes.visit(function(d:DataSprite):void { if (d.data.type == 1) {
m = Math.max(m, d.data.max); } else {
f = Math.max(f, d.data.max); }
}, "visible");
// second pass: set saturation
visualization.data.nodes.visit(function(d:DataSprite):void {
var s:Number = .3 + .3*d.data.max/((d.data.type==1)?m:f); t.$(d).fillSaturation = s;
}, "visible"); }
35
Appendix B: Code for Function View
package flare.apps{
import com.adobe.serialization.json.JSON; import flare.apps.Circularlayout;
import flare.display.TextSprite; import flare.query.methods.eq; import flare.query.methods.fn; import flare.util.Shapes; import flare.util.Strings; import flare.vis.Visualization;
import flare.vis.controls.ClickControl; import flare.vis.controls.HoverControl; import flare.vis.controls.TooltipControl; import flare.vis.data.Data;
import flare.vis.data.NodeSprite; import flare.vis.data.Tree;
import flare.vis.events.SelectionEvent; import flare.vis.events.TooltipEvent;
import flare.vis.operator.encoder.PropertyEncoder; import flare.vis.operator.label.Labeler;
import flare.vis.operator.layout.TreeMapLayout; import flare.widgets.ProgressBar;
import flash.display.StageQuality; import flash.filters.DropShadowFilter; import flash.geom.Rectangle;
import flash.net.URLLoader; import flash.net.URLRequest; import flash.net.navigateToURL; import flash.text.TextFormat;
[SWF(backgroundColor="#ffffff", frameRate="30")] publicclass PackageMap extends App
{
privatestaticvar _tipText:String = "<b>{0}</b><br/>{1:,0} times"; privatevar _url:String = "C:/Users/Shravan/Desktop/data.json"; privatevar _vis:Visualization;
privatevar _bar:ProgressBar;
protectedoverridefunction init():void {
// create progress bar
addChild(_bar = new ProgressBar());
_bar.bar.filters = [new DropShadowFilter(1)];
// load data file
36
_bar.loadURL(ldr, function():void {
var obj:Array = JSON.decode(ldr.data as String) as Array; var data:Data = buildData(obj);
visualize(data); _bar = null;
});
}
privatefunction visualize(data:Data):void {
// we're only drawing rectangles, so no one should notice...
stage.quality = StageQuality.LOW;
// create and add visualization
addChild(_vis = new Visualization(data));
// -- initialize visual items
---// nodes are blocks, lower depths have thicker edges
_vis.data.nodes.visit(function(n:NodeSprite):void { n.buttonMode = true;
n.shape = Shapes.BLOCK; n.fillColor = 0xff4444ff; n.lineColor = 0xffcccccc;
n.lineWidth = n.depth==1 ? 2 : n.childDegree ? 1 : 0; n.fillAlpha = n.depth / 25;
});
// no fill or mouse interaction for nodes with children
_vis.data.nodes.setProperties({ fillColor: 0,
mouseEnabled: false }, null, "childDegree");
// don't show any edges
_vis.data.edges["visible"] = false;
// -- define operators
---// perform a tree map layout
_vis.operators.add(new TreeMapLayout("data.size"));
// label top-level packages in new layer
_vis.operators.add(new Labeler(
// strip off the "flare." prefix
fn("substring","data.name",6),
37
// showText("GraphML loaded"+data.nodes+" edges and nodes!");
// add drop shadow to generated labels
_vis.operators.add(new PropertyEncoder({
"props.label.filters": [new DropShadowFilter(3,45,0x888888)] }, Data.NODES, eq("depth",1)));
// run the operators
_vis.update();
// -- define interactive controls
---// highlight nodes on mouse over
_vis.controls.add(new HoverControl(NodeSprite,
// don't change drawing order of nodes
HoverControl.MOVE_AND_RETURN,
// highlight
function(evt:SelectionEvent):void { evt.node.lineColor = 0xffFF0000; evt.node.fillColor = 0xffFFAAAA; },
// unhighlight
function(evt:SelectionEvent):void { var n:NodeSprite = evt.node; n.lineColor = 0xffcccccc; n.fillColor = 0xff4444FF; n.fillAlpha = n.depth / 25; }
));
// provide tooltip on mouse hover
_vis.controls.add(new TooltipControl(NodeSprite, null, function(evt:TooltipEvent):void {
TextSprite(evt.tooltip).htmlText = Strings.format(_tipText, evt.node.data.name, evt.node.data.size);
} ));
// click to hyperlink to source code
_vis.controls.add(new ClickControl(NodeSprite, 1, function(evt:SelectionEvent):void {
// var cls:String = evt.node.data.name;
// var url:String = _src + cls.split(".").join("/") + ".as";
// navigateToURL(new URLRequest(url), "_code");
addChild(new Circularlayout()); _vis.alpha = 0;
38
// perform layout
resize(_appBounds); }
privatefunction showText(text:String):void{
var fmt:TextFormat = new TextFormat("Verdana",10,0x000000); var ts:TextSprite = new TextSprite(text,fmt);
}
publicoverridefunction resize(b:Rectangle):void {
if (_bar) {
_bar.x = b.width/2 - _bar.width/2; _bar.y = b.height/2 - _bar.height/2; }
if (_vis) {
// make some extra room for the treemap border
b.x += 1; b.y += 1; b.width -= 1; b.height -= 1; _vis.bounds = b;
_vis.update(); }
}
//
---/**
* Creates the visualized data. */
publicstaticfunction buildData(tuples:Array):Data {
var tree:Tree = new Tree(); var map:Object = {};
map.flare = tree.addRoot();
tree.root.data = {name:"flare", size:0};
var t:Object, u:NodeSprite, v:NodeSprite; var path:Array, p:String, pp:String, i:uint;
// build package tree
tuples.sortOn("name"); for each (t in tuples) {
path = String(t.name).split("."); for (i=0, p=""; i<path.length-1; ++i) {
pp = p;
39
map[p] = (u = tree.addChild(map[pp])); u.data = {name:p, size:0};
} }
t["package"] = p;
map[t.name] = (u = tree.addChild(map[p])); u.data = t;
}
// sort the list of children alphabetically by name
for each (u in tree.nodes) {
u.sortEdgesBy(NodeSprite.CHILD_LINKS, "target.data.name"); }
return tree; }
} // end of class PackageMap
40
Appendix C: Code for B-matrix Construction
package Thesis;
import java.io.*;
import java.text.DecimalFormat;
import java.util.*;
import java.lang.*;
public class Thesis {
static int nodes = 174;
static int max_dist = 4;
static int data[][]=new int[nodes*nodes][2];
static int node_distance[][]=new int[nodes][max_dist+1];
static int distance_freq_mat[][]=new int[max_dist][nodes];
public static void main(String[] args) {
readData();
node_distance_occurences();
distance_frequency();
for(int i=0;i<max_dist;i++)
{
for(int j=0; j<nodes; j++)
System.out.print(" "+distance_freq_mat[i][j]);
System.out.println("");
41
}
public static void distance_frequency()
{
for(int i=0; i<max_dist; i++)
for(int j=0; j<nodes; j++)
distance_freq_mat[i][j]=0;
for(int j=1; j<max_dist+1; j++)
for(int i=0; i<nodes; i++)
{
int k=node_distance[i][j];
distance_freq_mat[j-1][k]++;
}
}
public static void node_distance_occurences()
{
int k=0;
for(int i=0; i<nodes; i++)
{
for(int j=0; j<max_dist+1; j++)
node_distance[k][j]=0;
42
{
int x=data[j][1];
if(x==0)
node_distance[k][0]=data[j][0];
else
node_distance[k][x]++;
}
k++;
}
}
public static void readData()
{
try
{
FileReader fr = new
FileReader("C:/Users/Shravan/Desktop/implementation/neighbors/target.txt");
BufferedReader br = new BufferedReader(fr);
String line;
int i = 0;
while ((line = br.readLine()) != null)
{
int j=0;
StringTokenizer st = new StringTokenizer(line);
43
data[i][j++]=Integer.parseInt(element);
if(st.hasMoreTokens())
element=st.nextToken().trim();
data[i][j++]=Integer.parseInt(element);
i++;
}
fr.close();
} catch (Exception e)
{
e.printStackTrace();
}
}
44
Bibliography
[1] Robert Spence, “Information Visualization: Design for Interaction” (Second Edition,Pearson Prentice Hall) 2007.
[2] Edward Tufte, “Envisioning Information” (Cheshire, CT:Graphics Press) 1990. [3] Edward Tufte, “Visual Explanations” ( Cheshire, CT:Graphics Press) 1997.
[4] Edward Tufte, “The Visual Display of Quantitative Information” (Cheshire, CT:Graphics Press) 2001.
[5] B.Paley, perceptually/cognitively – motivated information design techniques. In
Visual Analytics:Science and Application, University of British Columbia,
Vancouver, Canada, February 2008.
[6] Y.Hideshima and H.Koike. Starmine: a visualization system for cyber attacks. In APVis’06: Proc. of the 2006 Asia-Pacific Symposium on Information Visualization, pages 131-138, 2006.
[7] Ying-Huey Fua, Matthew O. Ward and Elke A. Rundensteiner, Hierarchical Parallel Coordinates for Exploration of Large Datasets
[8] “Andrew’sPlot”,
<http://www.itl.nist.gov/div898/software/dataplot/refman1/ch2/andrews.pdf> [9] Flare Introduction <http://flare.prefuse.org/>
[10] “UC Berkeley Visualization lab” http://vis.berkeley.edu/
[11] “Pajek Networks” <http://vlado.fmf.uni-lj.si/pub/networks/pajek/> [12] “Matlab” < http://www.mathworks.com/products/matlab/>
[13] J.P.Bagrow, E.M.Bollt, J.D.Skufca and D.Ben-Avraham, Portraits of Complex Networks, A Letter Journal Exploring Frontiers of Physics, 27 February,2008.
[14] “JSON” <http://www.json.org/> [15] “KEDS” < http://web.ku.edu/~keds/>
[16] “Pajek datasets”< http://vlado.fmf.uni-lj.si/pub/networks/data/KEDS/KEDS.htm> [17] <http://flare.prefuse.org/api/flare/vis/operator/layout/NodeLinkTreeLayout.html#
protectedPropertySummary>
[18] < http://flare.prefuse.org/api/flare/vis/operator/layout/StackedAreaLayout.html> [19] < http://flare.prefuse.org/api/flare/vis/operator/layout/TreeMapLayout.html> [20] "Squarified Treemaps" In Data Visualization 2000, Proceedings of the Joint
Eurographics and IEEE TCVG Symposium on Visualization, 2000, pp. 33-42. Available online at: <http://www.win.tue.nl/~vanwijk/stm.pdf>
[21] “HB Gary Threat Report: Operation Aurora”,
45
VITA
Sravan Kumar Pappu was born in Hyderabad, Andhra Pradesh, India on 5th August 1986. He received his Bachelors in Technology from Jawaharlal Nehru Technological University with Electronics and Communications Engineering as Major in May 2007. He was admitted to the graduate school of the University of New Orleans in Department of Computer Science in spring 2009.