University of New Orleans University of New Orleans
ScholarWorks@UNO
ScholarWorks@UNO
University of New Orleans Theses and
Dissertations Dissertations and Theses
12-17-2010
Visualization for Verification Driven Learning in Database Studies
Visualization for Verification Driven Learning in Database Studies
Aditya Kallem
University of New Orleans
Follow this and additional works at: https://scholarworks.uno.edu/td
Recommended Citation Recommended Citation
Kallem, Aditya, "Visualization for Verification Driven Learning in Database Studies" (2010). University of New Orleans Theses and Dissertations. 99.
https://scholarworks.uno.edu/td/99
This Thesis-Restricted is protected by copyright and/or related rights. It has been brought to you by
ScholarWorks@UNO with permission from the rights-holder(s). You are free to use this Thesis-Restricted in any way that is permitted by the copyright and related rights legislation that applies to your use. For other uses you need to obtain permission from the rights-holder(s) directly, unless additional rights are indicated by a Creative Commons license in the record and/or on the work itself.
Visualization for Verification Driven Learning in Database Studies
A Thesis
Submitted to the Graduate Faculty of the University of New Orleans in partial fulfillment of the requirements for the degree of
Master of Science In
Computer Science
by
Aditya Reddy Kallem
ii
ACKNOWLEDGEMENT
I would like to thank Dr. Shengru Tu for guiding me throughout my thesis. Without his help, I
could not finish this thesis.
I would like to thank Dr. Adlai DePano and Dr. Christopher Taylor to be part of my defense
committee members.
Lastly, I would like to thank all my friends and my parents who gave me so much love and
iii
Table of Contents
List of Figures ... iv
Abstract ... v
1. Introduction ... 1
2. Background ... 4
2.1 Query Parser ... 4
2.2 Adobe Flash ... 5
2.3 JavaFX ... 6
3. Visualization Design for Database Studies ... 8
3.1 Visualization of Data Retrieved from Databases ... 8
3.2 Visualization of Data Manipulation in Databases ... 10
3.3 Visualization of Communication Messages ... 15
4. Implementation of Data Visualization ... 19
4.1 Implementation of Visualization of Data Manipulation in Database ... 19
4.1.1 Insert ... 19
4.1.2 Update ... 21
4.1.3 Delete ... 23
4.1.4 JavaFX Code For Visualization ... 24
4.2 Implementation of Visualization of Data Retrieved from Database ... 26
4.3 Implementation of Visualization of Communication Messages ... 31
5. Applying Data Visualization in Database Studies ... 35
5.1 Description of the Database Application System ... 35
5.1.1 Developing The Underlying System ... 37
5.2 Turning the Production System to a VDL System ... 39
5.2.1 Learning Case ... 39
6. Discussion & Conclusion ... 58
References ... 59
iv
List of Figures
Figure 1 ... 10
Figure 2 ... 12
Figure 3 ... 13
Figure 4 ... 14
Figure 5 ... 15
Figure 6 ... 17
Figure 7 ... 18
Figure 8 ... 20
Figure 9 ... 22
Figure 10 ... 24
Figure 11 ... 25
Figure 12 ... 27
Figure 13 ... 29
Figure 14 ... 31
Figure 15 ... 32
Figure 16 ... 34
Figure 17 ... 36
Figure 18 ... 38
Figure 19 ... 41
Figure 20 ... 42
Figure 21 ... 43
Figure 22 ... 45
Figure 23 ... 46
Figure 24 ... 48
Figure 25 ... 50
Figure 26 ... 52
Figure 27 ... 54
Figure 28 ... 55
v
Abstract
This thesis aims at developing a data visualization tool to enhance database learning
based on the Verification Driven Learning (VDL) model. The goal of the VDL model is to
present abstract concepts in the contexts of real-world systems to students in the early stages of
computer science program. In this project, a personnel/training management system has been
turned into a learning platform by adding a number of features for visualization and quizzing.
We have implemented various tactics to visualize the data manipulation and data retrieval
operations in database, as well as the message contents in data messaging channels. The results
of our development have been utilized in eight learning cases illustrating the applications of our
visualization tool. Each of these learning cases were made by systematically implanting bugs in a
functioning component; the students are assigned to identify the bugs and at the same time to
learn the structure of the software system active
1
1. Introduction
One of the efforts of computer science education community is the push for presenting abstract
computer science concepts in the context of familiar world applications [1]. However,
real-world working software systems are very complex to implement. Developing such working
software systems requires thorough understanding of many concepts which can take years of
learning. Therefore, students often do not see their learning directly related to the real world until
they complete many computer science courses which take couple of years. Such a prolong
process can make students lose their interest in the computer science program.
The objective of Verification Driven Learning (VDL) is to bind the students to real-world
challenges. By facilitating students doing the verification activities, we can let students see their
future roles in real-world projects. Students will realize their learning of computation is relevant
to the real world.
In a general VDL process, the students go through a series of activities listed below.
1) The students begin the process by reading the functional description of the subject
system. A simplified version of the functional requirements specification of the subject system
can serve this purpose well.
2) The students execute the program and interact with the system as a user. The purpose is
for the students to get familiar to the subject system.
3) The students are assigned to verify the system’s functionalities by comparing the features and
capabilities experienced in Step 2 against the document read in Step 1. If needed, the students
can go back to Step 1 (to review the document) or go back to Step 2 (to try out more
2
4) The students are quizzed with multiple-choice questions which challenge the students
about “what’s wrong”. Answering these questions requires a comprehension of the problem. At
the same time, the multiple-choice questions illustrate examples of concise, hit-the-point
language style for describing problems.
5) The students are asked to find the bug. The objective is for the students to locate the
planted bug through critical thinking. In order to help the students to achieve their goals, a
collection of facilities are provided including system structure diagrams, data flow observers
(e.g., a message viewer), illustrations of component structure drill down. For some complex
components with a planted bug, an animation that points out the problematic code is prepared.
A verification-driven learning case should consist of the following elements.
1) a working system,
2) the justification of the system’s existence and background information,
3) the simplified requirements specification of the system,
4) the description of the functionality of the system including intuitive explanation of the
business rules and solution logic,
5) test cases (pairs of input data and expected output),
6) decomposition of the system is prepared and presented to the students as subsystems,
components and objects; each has its functionality specification and user’s guide,
7) the specifications of interfaces between components and objects,
8) intuitive user interfaces for students to interact with the components and objects, or to
3
A database is a collection of organized data which is accessed depending on the
requirement of the organizations. A database always serves as the backend of applications to
store the information that has been collected by the frontend clients. Database is an elective
course in many computer science curriculums. Due to the strong demanding from the job market,
most computer science students take one or more database courses in their studies. Traditionally,
relational database learning starts from the foundation in mathematics – relational algebra and
relational calculus. While the foundation is essential for a thorough study, students often need
help in grasping the abstract concepts.
As part of our research on the VDL model [2], this project aims at enhancing the VDL
model with data visualization tools for database learning. For example, the dynamic visual tool is
used to identify and verify database results. The output of a query is highlighted in the table
visually by the dynamic visual tool. We will visually present the operations performed on a
database in order to make easy to understand the logic that is being executed in the database. The
visualization is to bring real-world problems and solutions to the classrooms. All the database
operations ranging from SELECT statements to INSERT and DELETE operations are performed
4
2. Background
Based on the concepts of VDL, a module for database is developed which is a FLASH/JavaFX
file that can be integrated and reused in any Web application. This FLASH/JavaFX file can
visually interpret the queries applied to a database. It takes the query as an input parameter and
visually shows the way this query is applied onto the database. Every data that is
retrieved/inserted/updated/deleted is represented in this FLASH/JavFX file discretely.
The prime components of this FLASH/JavaFX module are the Query Parser and the ability of
FLASH/JavaFX to visually represent the dynamic content in an appealing manner.
2.1 Query Parser
The queries that are used by working software systems are basically very complex and very
difficult to understand. Consider a simple SELECT statement which is supposed to retrieve an
employee’s name that works in a particular company, for this query to return results it needs to
access two tables i.e. employee & company and apply the conditions company name and
employee name on respective tables, In another example consider the SELECT statement to
retrieve the names of employee’s in a branch in descending order of their salary, in this case we
need to query the location table, employee table and sort it in descending order. The
aforementioned operations are very simple and can be used only for demonstration purposes but
In a working software systems the resulting queries are very complex which includes JOINs,
multiple tables, multiple conditions and sorting of database values. In order to effectively show
each of the database operations performed by the working software systems, we need an efficient
5
enough meta data to FLASH/JavaFX so that the FLASH/JavaFX can visually interpret the
Database operations. This is where we need a Query Parser which can understand the query and
retrieve the required meta data from the query and the database.
2.2 Adobe Flash
An Adobe generated FLASH file can be readily integrated into any Web application. And since
the FLASH file is already compiled, the Web server just needs to load the FLASH file to the
clients. The purpose of FLASH is to show the communication messages between the key
components of working software systems i.e. the communication between the client, server,
database, Web-services, etc. The FLASH essentially shows the key values that are being passed
from one component to other component. Since we implant bugs in the system to make the
students learn about database queries, these incorrect values are shown in the communication
which helps the students understand that the bugs are implanted in the Database component. This
communication messages module is a basically a FLASH file showing the structure of the
working software systems. And the dataflow between these components are dynamically shown
in the FLASH animation in which an envelope carries the messages between all the key
components.
There are two key components used to build such a dynamic FLASH file which can show the
communication between components,
1) Tweened Animation and
6 1) Tweened Animation:
We can create two types of tweened animation in flash i.e. motion tweening and shape tweening,
between which we have made an effective use of motion tween. The motion tween was used to
define the animated motion of the communication messages among different components of the
learning system. But the dynamic messages which were passed in the communications were
completely controlled by Action Script, which is the second key component.
2) Action Script:
The Action Script language adds the complex interactivity, playback control and data display in
the application. Action Script includes a large library of built-in classes that allows us to create
such a visually application. Flash includes more than one version of Action Script to meet the
need to different kinds of application, but in this application we have made use of Action Script
3.0 which thoroughly follows the rules of object oriented programming style. Action Script 3.0
executes extremely fast which makes it a perfect choice for complex operations and data
manipulations.
The Action Script is the major component which played a crucial role in animated
communication messages. The messages in the animated communication messages were
dynamically updated by Action Script.
2.3 JavaFX
JavaFX is an expressive rich client platform for creating and delivering rich Internet experiences
across many devices and platforms. JavaFX is fully integrated with the Java Runtime and takes
advantage of the performance and ubiquity of Oracle's Java Runtime Environment that is
7
collaborative developer-designer workflow. The JavaFX platform contains an essential set of
tools and technologies that enable developers and designers to collaborate, create, and deploy
applications with expressive content to browsers and desktops. In addition, mobile application
developers can use built-in emulators to preview applications for mobile and television devices
using the JavaFX platform.
Initially the modules of VDL program were developed using Adobe’s Flash due to its
industry standards. But later we switched the development environment to JavaFX because the
developer tools were readily available from Oracles Java Environment for deployment of
products on to the client interfaces without having to deal with the pricing and the licensing
options. JavaFX provides an environment which is comparably as good as Adobes developer
environment.
The main advantage of JavaFX over Adobe is the scripting language that is used to
8
3. Visualization Design for Database Studies
The visualization of tables and operations performed in databases is to help the students to better
understand the working process of a database. We have designed a visualization model to
address the issue. The primary techniques employed in our thesis to help the students are:
a) Highlight the critical data items to capture the students attention ,
b) Provide the complete table schema beyond the selected columns to help the students get a
better idea about the table.
3.1 Visualization of Data Retrieved from Databases
A common way to retrieve data from a database is to use the SELECT statement on a table in the
database. This data retrieved is displayed to the user in the order the SELECT statement
prescribed.
Example 1:
Consider a SELECT statement which retrieves employee names of a company. For this SELECT
statement, we need to retrieve the rows from the person and the job tables by performing a join
and then filter the results by applying the WHERE conditional statement which extracts the
employee names working in a specific company.
SELECT
person.first_name, person.last_name FROM person, job
9
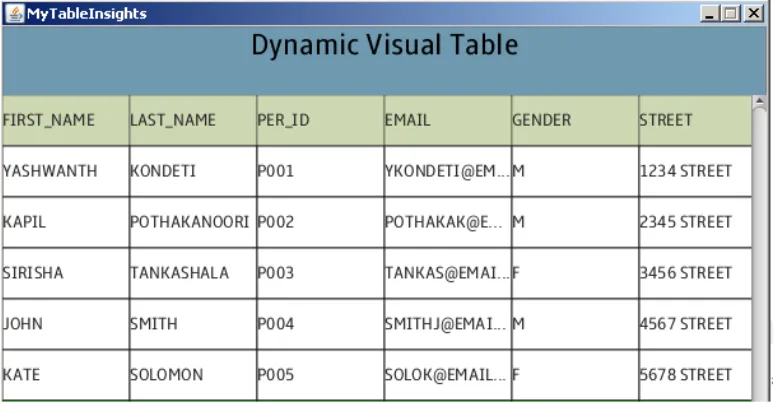
The above query retrieves the first names and the last names of all the employees from the
person table who are working in the company “MICROSOFT”. This simple query will be a
challenge for a beginner student. In this scenario, our goal is to present the user not only the
values of “first_name” and the “last_name” columns but also the table structure, the remaining
fields in the table, and the way the data is organized in the query result. If the aforementioned
details about a table are readily available, even a beginner student will be able to get a proper
understanding of the way data is organized in the database and also the sequence in which the
query accesses the data in the table.
To effectively present this information to the user we have designed a module which
visually shows the table structure, table fields and complete data that is currently organized in the
table.
10
Figure 1
The highlighted data represents the data that is requested by the SELECT statement
3.2 Visualization of Data Manipulation in Databases
Manipulation of data in database becomes confusing if the user doesn’t have a clear idea about
the database schema. Our visualization will help students in understanding three types of data
11
The insertion operation is very intuitive. However, if the table contains certain constraints
such as “primary key”, “unique key”, “not null”, then the student might have problem if the new
row violates some constraint
Example 2:
Consider the following statement which inserts a new row into the “person” table.
INSERT INTO person
VALUES ('PETER', 'SOLOMON', 'P001', '[email protected]', 'M', '6789 STREET ', 'MEMPHIS', 'TN', 'J006')
The person table has PRIMARY KEY constraint on the per_id field. Therefore, the new row’s
“per_id” column’s value has to be a unique key in the person table. Thus, assuring uniqueness of
the per_id value is the key criterion for successful insertion. To address these common issues, we
have visually interpreted the table and supported viewing all the rows and the columns. With this
information, the student will be able to understand a rejection decision and make considerable
changes to the query on the fly.
When the students execute the above statement, the database returns execution failure
result and the dynamic visual tool provides the following information for the students to reason
12
Figure 2
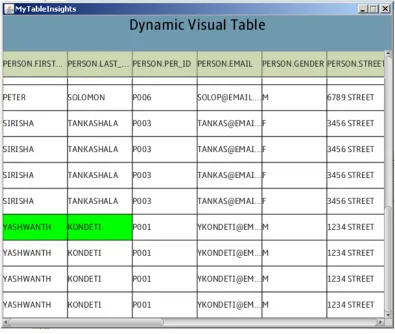
By examining the above information it is clear that the “per_id” value in the new row that
we are trying to insert is already present in the table. Therefore, we need to verify the “per_id”
values from the database and provide a new value for the new row we are trying to insert. After
making the following required modification to the values of the INSERT statement we
re-execute the INSERT statement to insert the new row.
INSERT INTO person
VALUES ('PETER', 'SOLOMON', 'P006', '[email protected]', 'M', '6789 STREET ', 'MEMPHIS', 'TN', 'J006')
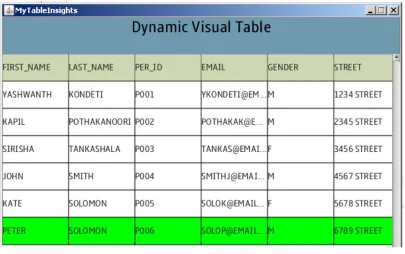
The execution of the above statement will result a success notification from the database
and following information is displayed by the visual tool. The highlighted row clearly identifies
13
Figure 3
Example 3:
Now, we consider the UPDATE operation. The SQL statement in this example updates the
pay_type field of a job in a company. Here we use the UPDATE statement which requires the
table name, the column name, and the row selection criteria.
UPDATE job
SET pay_type=’HOURLY’ WHERE comp_id = ‘YAHOO’
This query update all the rows in the table which satisfy the row selection criteria and sends back
a success notification. Our goal is to visually interpret the data manipulation operations that are
performed on the table by the UPDATE statement. To achieve this goal we display the complete
table with all the records and highlight all the updated data in the specified column which makes
14
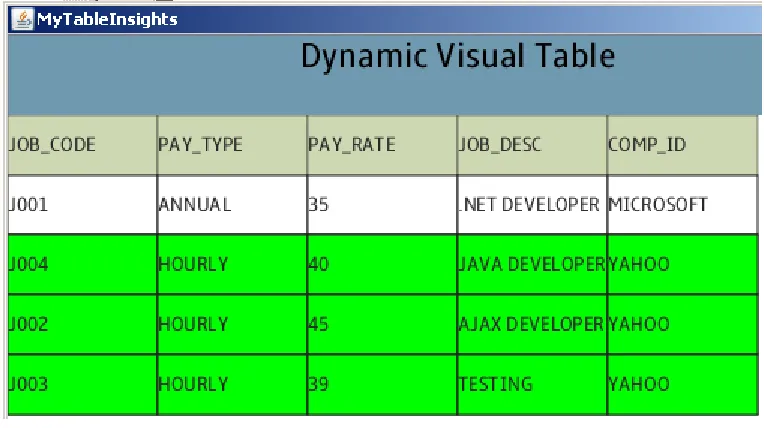
The following snapshot shows the representation of data that has been updated in the table.
Figure 4
The highlighted data clearly identifies the data that has been updated by the query.
A DELETE statement can be applied on a table to delete obsolete or unwanted data from
the table. If the student is unaware of the required constraints to delete the obsolete data then a
disastrous result can happen.
Example 4:
Consider the following delete statement which deletes all the expired certificates from the
15 DELETE certificate WHERE expiry_date < ’08-18-10’
This query deletes all the records whose expiration dates are earlier than 08-18-10. In
order to interpret this operation visually we highlight all the deleted records in the table and these
deleted records are shown along with the remaining records in the table. This makes it easy for
the student to understand the records which are deleted. The following snapshot shows the visual
representation of data that has been deleted in the table. The highlighted data clearly identifies
the data that has been deleted by the query.
Figure 5
3.3 Visualization of Communication Messages
In addition to the visual tool showing the query results, we have also developed an animation
component to visualize the messages in communication channels. The animation component is to
16
Databases typically serve as the back end of information systems. In modern database
applications, users’ requests and query results are passing through multiple components in
multiple tiers by messages. For a learner, viewing the contents of the messages can often assist
his/her analysis in critical thinking. We have designed a module specifically for this purpose.
This module can carry out animations that dynamically display the contents of the selected
message and reflect any changes.
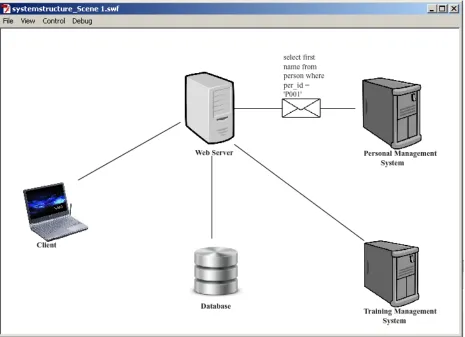
In order to achieve this goal we have designed a FLASH based module which visually
represents the working software system structure and dynamically updates the messages that are
17
Figure 6
The communication between these components is shown by a flying envelop carrying the
messages between these components. The message which is carried by the envelope is
dynamically generated, so any real time communications are reflected over the envelope. This
feature makes it easy to track the query requests that are sent to the database and the results
returned by the database to the client systems. In our project we have used a “flying envelope” to
18
Figure 7
The animation is achieved using the Action Script 3.0 scripting language provided by
Adobe Flash Professional. Action Script 3.0 thoroughly follows the concepts of object oriented
19
4. Implementation of Data Visualization
In the implementation of Data visualization, there are two critical operations:
a. To extract the meta data required from the SQL query
b. To extract the key values needed to be highlighted
The meta data of an SQL query is used to display the column names of the table and
highlight the result of the query in the dynamic visual tool. To extract this meta data we have
created a “QueryParser” class which takes the SQL query as a parameter and extract’s the
required meta data. This query parser is designed to parse four important SQL statements,
namely the SELECT, INSERT, UPDATE and DELETE statements.
4.1 Implementation of Visualization of Data Manipulation in Database
INSERT, UPDATE and DELETE are the three data manipulation operations that our tool
visualizes. A precondition for doing visualization is to collect the proper set of information for
each statement from the database. In section 4.1.1 through 4.1.3, we have described this
information collection process for the three statements. In section 4.1.4 we have described the
actual visualization.
4.1.1 Insert
We have used simple string manipulation functions such as substring and indexOf to extract the
table names and the values in the INSERT statement. These values serve as key values for our
20
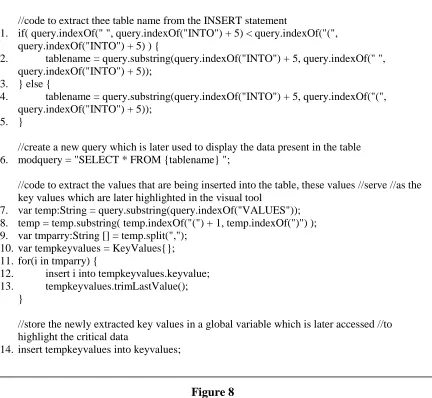
The code in Figure 8 extracts the table name and the key values from the query. The key
values are stored in a global “keyvalues” variable which is later used to highlight the newly
inserted row. The following steps describe more about the code in Figure 8,
Step 1: The code from line 1-5 extracts the table name from the INSERT statement Figure 8
//code to extract thee table name from the INSERT statement
1. if( query.indexOf(" ", query.indexOf("INTO") + 5) < query.indexOf("(", query.indexOf("INTO") + 5) ) {
2. tablename = query.substring(query.indexOf("INTO") + 5, query.indexOf(" ", query.indexOf("INTO") + 5));
3. } else {
4. tablename = query.substring(query.indexOf("INTO") + 5, query.indexOf("(", query.indexOf("INTO") + 5));
5. }
//create a new query which is later used to display the data present in the table 6. modquery = "SELECT * FROM {tablename} ";
//code to extract the values that are being inserted into the table, these values //serve //as the key values which are later highlighted in the visual tool
7. var temp:String = query.substring(query.indexOf("VALUES")); 8. temp = temp.substring( temp.indexOf("(") + 1, temp.indexOf(")") ); 9. var tmparry:String [] = temp.split(",");
10. var tempkeyvalues = KeyValues{}; 11. for(i in tmparry) {
12. insert i into tempkeyvalues.keyvalue; 13. tempkeyvalues.trimLastValue();
}
//store the newly extracted key values in a global variable which is later accessed //to highlight the critical data
21
Step 2: In line 6, we create a new query which is used to display the data present in the table
Step 3: The code from 7-10 will extract the values of newly inserted row, which are used as key
values during the visualization of INSERT statement.
Step 4: The code from 11-13 will format the key values and store them in a temporary array,
which is later stored in a global variable in line number 14.
4.1.2 Update
The interpretation of the UPDATE statement was relatively simple compared to the INSERT
statement. After extracting the table name from the SQL query using simple string manipulation
functions, we need to search and extract the WHERE clause in the update statement. This
WHERE clause plays the crucial role in extracting the key values that are needed to be
highlighted. Using this WHERE clause we create a new SELECT statement that is applied on the
table. The result that we obtain after applying this new query on the table is the key values that
are necessary for our visual tool. This result is stored in our global “keyvalues” variable which is
later accessed to highlight the newly updated row(s).
The following code shows the implementation of the above,
(figure continued)
//code to extract the table name from the UPDATE statement
1. tablename = query.substring(query.indexOf("UPDATE") + 7, query.indexOf(" ", query.indexOf("UPDATE") + 7));
//create a new query which is later used to display the data present in the //table 2. modquery = "SELECT * FROM {tablename} ";
//we need to extract the WHERE clause used by the UPDATE statement which is later //used to retrieve the key values from the database
22
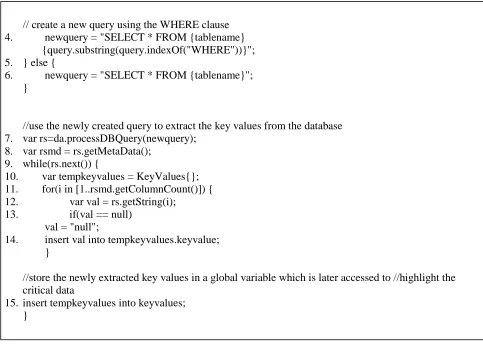
In Figure 9, the method of extracting the table name from the query is similar to that of
INSERT statement. The process of extracting the key values is different, the following steps give
an explanation.
Step 1: The UPDATE statement only updates the values which satisfy the criteria specified in the
WHERE clause, so to obtain the key values in this case we extract the WHERE clause from the
UPDATE statement from line 3-6
Step 2: Using the WHERE clause extracted in previous step we create a new SELECT statement
in line 4/6 which is used to extract key values from the database in line 7-14
// create a new query using the WHERE clause
4. newquery = "SELECT * FROM {tablename} {query.substring(query.indexOf("WHERE"))}"; 5. } else {
6. newquery = "SELECT * FROM {tablename}"; }
//use the newly created query to extract the key values from the database 7. var rs=da.processDBQuery(newquery);
8. var rsmd = rs.getMetaData(); 9. while(rs.next()) {
10. var tempkeyvalues = KeyValues{}; 11. for(i in [1..rsmd.getColumnCount()]) { 12. var val = rs.getString(i);
13. if(val == null) val = "null";
14. insert val into tempkeyvalues.keyvalue; }
//store the newly extracted key values in a global variable which is later accessed to //highlight the critical data
15. insert tempkeyvalues into keyvalues; }
23
Step 3: Finally, after storing the key values in a global variable in line 15, we can now use these
key value to perform visualization
4.1.3 Delete
The interpretation of DELETE statement is similar to that of the implementation of UPDATE
statement. The only major difference is that the key values in this case are extracted from a
backup table keeps a backup of the table on which the DELETE statement was applied.
The following code shows the implementation of DELETE statement,
(figure continued )
//code to extract the table name from the DELETE statement
1. tablename = query.substring(query.indexOf("DELETE") + 7, query.indexOf(" ", query.indexOf("DELETE") + 7));
//delete rows are backed up a backup table, therefore we use the //backup //table //rather than the original table
2. tablename = "{tablename}BACKUP001";
//create a new query which is later used to display the data present in the table 3. modquery = "SELECT * FROM {tablename} ";
//we need to extract the WHERE clause used by the UPDATE statement which is //later //used to retrieve the key values from the database
4. if(query.indexOf("WHERE") != -1){
// create a new query using the WHERE clause 5. newquery = "SELECT * FROM {tablename}
{query.substring(query.indexOf("WHERE"))}"; 6. } else {
24
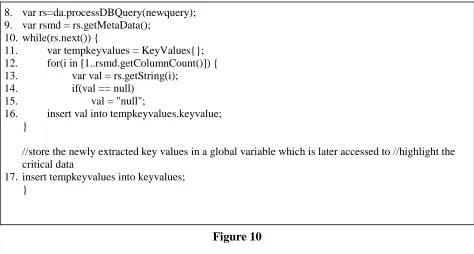
In Figure 10, the method of information collection for the DELETE statement is identical
to that of UPDATE statement. The difference is that we make use a backup table instead of the
target table in order to extract the key values from the target table. The backup table is the table
which contains all the values that were deleted from the target table.
4.1.4 JavaFX Code For Visualization
After obtaining the required data for visualization of data manipulation operations by following
any of the previous methods, we perform visualization by highlighting the crucial data from the
rest of the rows present in the table. This crucial data will help the students in making critical
decisions and brainstorming their understanding of database during the learning cases. The
Figure 11 shows the implementation of visualization,
8. var rs=da.processDBQuery(newquery); 9. var rsmd = rs.getMetaData();
10. while(rs.next()) {
11. var tempkeyvalues = KeyValues{}; 12. for(i in [1..rsmd.getColumnCount()]) { 13. var val = rs.getString(i);
14. if(val == null) 15. val = "null";
16. insert val into tempkeyvalues.keyvalue; }
//store the newly extracted key values in a global variable which is later accessed to //highlight the critical data
17. insert tempkeyvalues into keyvalues; }
25
// this function compares the values of every row with the key values that were extracted earlier
1. public class DataCell extends HeaderCell {
2. public var notifyData = bind data on replace { 3. if(index.size() == 0) {
//search all the keyvalues for a matching data 4. for(tempkv in QueryParser.keyvalues) {
//if found then set match = true and load the current row into the key and set index = 1 5. if(tempkv.keyvalue[0] == notifyData){
6. keysize = tempkv.keyvalue.size(); 7. insert tempkv into key;
8. insert 1 into index; 9. }
10. } else {
//if key[index] == notifyData then set match = true and index++ 11. var i:Integer = 0;
12. for(tempkv in key) {
13. if(tempkv.keyvalue[index[i]] == notifyData){ 14. index[i]++;
15. } 16. i++; 17. } 18. } 19. }
//after searching a row to see if it contains any crucial data that need to be highlighted we call the //following function to reset variables before searching the next row
20. public function resetGlobalVariables() { 21. delete index;
22. delete key; 23. keysize = -1 24. }
//this function is crucial in taking the decision to highlight a row in the presented table
25. public function colorRow():Boolean { 26. for(tempindex in index){
//check if all the values in this row have matched with the key values 27. if(keysize == tempindex) {
28. resetGlobalVariables(); 29. return true;
30. } 31. }
32. resetGlobalVariables(); 33. return false;
34. }
26 In Figure 11, the logic is simple,
Step 1: The code section 2-19 will search every row of the table and tries to compare these
values with the key values.
Step 2: After comparing all the values of a row in the previous step, the code section from 25-34
checks if all the values in this row have matched
Step 3: If all the values match in the previous step then it returns “true” when the function is
called. Then we can externally set the color of the row with a simple boolean value.
Step 4: The code section from 20-24 resets the temporary variables which were used to validate a
row with key values. These variables can now be used to validate the next row.
4.2 Implementation of Visualization of Data Retrieved from Database
To identify the data that have been retrieved from the database among the rest of the table, we
highlight each of the rows that satisfy the selection criteria.
Implementation of visualization of data retrieved from database is the complicated and
important part of the “QueryParser” class. Parsing SELECT statements is not as simple as
parsing the data manipulation statements. The string manipulation functions available in JavaFX
are not sufficient to parse SELECT statements. To be able to parse SELECT statements we make
use of the tools available in the database. The EXPLAIN PLAN1 utility in the Oracle database is
used to structurally break down any SELECT statement. We use this information to obtain the
required meta data from the SELECT statement. The sequence of SQL statements shown in
Figure 12 breaks down any complex SELECT statement and extract the meta data, from which,
we can retrieve the table name, selected column names, and the key values.
27
The code in Figure 13 shows the implementation of the above,
(figure continued)
1. DELETE query_parser
2. EXPLAIN PLAN into query_parser for SELECT person.first_name, person.last_name FROM person, job
WHERE person.job_code = job.job_code ORDER BY first_name
3. SELECT projection, object_alias FROM query_parser
WHERE object_alias!='null' AND projection!='null' ORDER BY object_instance
Figure 12
//create new query which is used to retrieve the data present in the table 1. newquery = "SELECT * {query.substring(query.indexOf("FROM"))}";
//create a modified query to retrieve the key values from the table
2. modquery = "SELECT * {orgquery.substring(query.indexOf("FROM"))}";
//code to preserver the WHERE, GROUP, ORDER BY clauses in the modified query 3. if(query.indexOf("WHERE")!=-1){
4. if((query.indexOf("GROUP")==-1 and query.indexOf("ORDER")!=-1) or (query.indexOf("ORDER")!=-1 and ( query.indexOf("ORDER") < query.indexOf("GROUP") ) )){
5. modquery = "{modquery.substring(0, query.indexOf("WHERE") - (query.length() - modquery.length()))} {modquery.substring(query.indexOf("ORDER") –
(query.length() - modquery.length()))}"; 6. }
7. else if((query.indexOf("ORDER")==-1 and query.indexOf("GROUP")!=-1) or query.indexOf("GROUP")!=-1 and ( query.indexOf("ORDER") >
query.indexOf("GROUP") )){
8. modquery = "{modquery.substring(0, query.indexOf("WHERE"))} {modquery.substring(query.indexOf("GROUP"))}";
9. } else {
10. modquery = "{modquery.substring(0,
28
(figure continued)
11. } 12. }
//retrieve the key values from the database using the modified query 13. var rs=da.processDBQuery(newquery);
14. var rsmd = rs.getMetaData(); 15. while(rs.next()) {
16. var tempkeyvalues = KeyValues{}; 17. for(i in [1..rsmd.getColumnCount()]) {
18. insert rs.getString(i) into tempkeyvalues.keyvalue; 19. }
//store the key values in a global variable which is accessed later to highlight the critical //data 20. insert tempkeyvalues into keyvalues;
21. }
//use the EXPLAIN PLAN database tool to structurally break down the query and retrieve //all the columns names of the table
22. da.processDBQuery("delete query_parser");
23. da.processDBQuery("explain plan into query_parser for {modquery}");
24. rs=da.processDBQuery("select projection from query_parser where operation='TABLE ACCESS' order by object_instance");
25. while(rs.next()) {
26. var temp = rs.getString(1);
27. var pattern = Pattern.compile("\""); 28. var matcher = pattern.matcher(temp); 29. if(matcher.find()) {
temp = matcher.replaceAll(""); 30. }
//code to format the retrieved columns names 31. pattern = Pattern.compile("\\s*" ); 32. matcher = pattern.matcher(temp); 33. if(matcher.find()) {
temp = matcher.replaceAll(""); 34. }
35. pattern = Pattern.compile("\\]," ); 36. var tempcolnames = pattern.split(temp); 37. for(colname in tempcolnames){
38. pattern = Pattern.compile("\\[.*" ); 39. matcher = pattern.matcher(colname); 40. if(matcher.find()) {
insert matcher.replaceAll("") into colnames; 41. }
42. } 43. }
29
//retrieve the key column names that were requested by the original query 44. da.processDBQuery("delete query_parser");
45. da.processDBQuery("explain plan into query_parser for {orgquery}");
46. rs=da.processDBQuery("select projection, object_alias from query_parser where
object_alias!='null' AND projection!='null' order by object_instance"); 47. while(rs.next()) {
//properly format the retrieved key column names 48. var temp = rs.getString(1);
49. var tablename = rs.getString(2);
50. tablename = tablename.substring(0, tablename.indexOf("@")) ; 51. var pattern = Pattern.compile("\"");
52. var matcher = pattern.matcher(temp); 53. if(matcher.find()) {
54. temp = matcher.replaceAll(""); 55. }
56. pattern = Pattern.compile("\\s*" ); 57. matcher = pattern.matcher(temp); 58. if(matcher.find()) {
59. temp = matcher.replaceAll(""); 60. }
61. pattern = Pattern.compile("\\]," ); 62. var tempcolnames = pattern.split(temp); 63. for(colname in tempcolnames) { 64. pattern = Pattern.compile("\\[.*" ); 65. matcher = pattern.matcher(colname); 66. if(matcher.find()) {
67. temp = matcher.replaceAll(""); 68. pattern = Pattern.compile("\\." ); 69. matcher = pattern.matcher(temp); 70. if(matcher.find()!=true){
71. insert "{tablename}.{temp}" into keycolnames; 72. } else {
//store these key column names in a global variable which is later accessed to highlight the //critical data
73. insert temp into keycolnames; 74. }
75. } 76. }
77. }
30
The Figure 13 shows the raw JavaFX code used to parse the SELECT statement; the following
steps give a more detailed explanation of the logic executed by the code:
Step 1: the code section from 3-12 will create a new query which we use to retrieve key values
from database. Besides, the WHERE clause, the ORDER BY, GROUP clause can also be
applied on SELECT statement. This code will preserve all these clauses in order to extract the
key values.
Step 2: the code section from 13-19 will use the query created in Step 1 to retrieve the key values
and store the values in a global variable in line 20.
Step 3: Along with the key values, we also need the column names that are associated with each
table in original query. To find the column names, the code section from 22-24 will extract the
column names of all the tables that were referred in the original query using the EXPLAIN
PLAN tool. These column names are properly formatted and stored in a global variable from line
25-43.
Step 4: We also need the key column names that were requested in the original query in order to
highlight the specific data that was requested by the query. To find the key column names, the
code section from 44-46 is executed. These column names are properly formatted and stored in a
global from line 47-77.
By following the above four steps we have collected the required meta data to visually
represent the SELECT statement. The JavaFX code for actual visualization is similar to that in
31
4.3 Implementation of Visualization of Communication Messages
The communication messages in this project are visualized in Adobe’s FLASH environment.
The static diagram which represents the structural design of this project is purely implemented in
FLASH, but the communication messages which are carried by the flying envelop between any
two applications is mixed with both static and dynamic content. The motion between the
applications is defined using the motion tweening feature available in FLASH.
32
In order to make this static content carry a dynamic message we need to access this motion
tween at the code level. So we convert this motion into the Action Script 3.0 code.
Figure 15
After obtaining the code to perform motion, we can make use of the code to move any
object on the same path. We have taken the advantage of this feature and apply this technique on
textual objects to make them move along with the flying envelop. Figure 15 illustration an
33
(figure continued) 1. var __motion_envelop_3:MotionBase;
2. if(__motion_envelop_3 == null) { 3. __motion_envelop_3 = new Motion(); 4. __motion_envelop_3.duration = 90;
// Call overrideTargetTransform to prevent the scale, skew, // or rotation values from being made relative to the target // object's original transform.
// __motion_envelop_3.overrideTargetTransform();
// The following calls to addPropertyArray assign data values // for each tweened property. There is one value in the Array // for every frame in the tween, or fewer if the last value // remains the same for the rest of the frames.
5. __motion_envelop_3.addPropertyArray("x", [0,2.53933,5.07865,7.61798,10.1573,12.6966,15.236,17.7753,20.3146,22.8539,25.3933,27.9 326,30.4719,33.0112,35.5506,38.0899,40.6292,43.1685,45.7079,48.2472,50.7865,53.3258,5 5.8652,58.4045,60.9438,63.4831,66.0225,68.5618,71.1011,73.6404,76.1798,78.7191,81.258 4,83.7978,86.3371,88.8764,91.4157,93.9551,96.4944,99.0337,101.573,104.112,106.652,109 .191,111.73,114.27,116.809,119.348,121.888,124.427,126.966,129.506,132.045,134.584,13 7.124,139.663,142.202,144.742,147.281,149.82,152.36,154.899,157.438,159.978,162.517,1 65.056,167.596,170.135,172.674,175.213,177.753,180.292,182.831,185.371,187.91,190.449 ,192.989,195.528,198.067,200.607,203.146,205.685,208.225,210.764,213.303,215.843,218. 382,220.921,223.461,226]);
6. __motion_envelop_3.addPropertyArray("y", [0,-4.89831,-9.79663,-14.6949,-19.5933,- 24.4916,-29.3899,-34.2882,-39.1865,-44.0848,-48.9831,-53.8815,-58.7798,-63.6781,- 68.5764,-73.4747,-78.373,-83.2713,-88.1697,-93.068,-97.9663,-102.865,-107.763,-112.661,- 117.56,-122.458,-127.356,-132.254,-137.153,-142.051,-146.949,-151.848,-156.746,- 161.644,-166.543,-171.441,-176.339,-181.238,-186.136,-191.034,-195.933,-200.831,- 205.729,-210.628,-215.526,-220.424,-225.322,-230.221,-235.119,-240.017,-244.916,- 249.814,-254.712,-259.611,-264.509,-269.407,-274.306,-279.204,-284.102,-289.001,- 293.899,-298.797,-303.696,-308.594,-313.492,-318.39,-323.289,-328.187,-333.085,- 337.984,-342.882,-347.78,-352.679,-357.577,-362.475,-367.374,-372.272,-377.17,-382.069,- 386.967,-391.865,-396.763,-401.662,-406.56,-411.458,-416.357,-421.255,-426.153,-431.052,-435.95]);
7. __motion_envelop_3.addPropertyArray("scaleX", [0.225891]); 8. __motion_envelop_3.addPropertyArray("scaleY", [0.145889]); 9. __motion_envelop_3.addPropertyArray("skewX", [0]);
10. __motion_envelop_3.addPropertyArray("skewY", [0]);
34
The function __animFactory_envelop_3.addTarget(); is called at line 17 to add motion
of textual objects. At this point, we can add any object to follow the same animation path. These
textual messages are dynamically loaded during runtime which shows the communication
messages between working software systems. This process is repeated for all the messages that
need to be passed between any two entities.
12. __motion_envelop_3.addPropertyArray("blendMode", ["normal"]); 13. __motion_envelop_3.addPropertyArray("cacheAsBitmap", [false]);
// Create an AnimatorFactory instance, which will manage // targets for its corresponding Motion.
14. var __animFactory_envelop_3:AnimatorFactory = new AnimatorFactory(__motion_envelop_3);
15. __animFactory_envelop_3.transformationPoint = new Point(0.545742, 0.597940);
// Call the addTarget function on the AnimatorFactory // instance to target a DisplayObject with this Motion.
// The second parameter is the number of times the animation // will play - thae default value of 0 means it will loop. 16. __animFactory_envelop_3.addTarget(envelop1, 0); 17. __animFactory_envelop_3.addTarget(text1, 0);
18. envelop1.alpha = 0.5;
19. text1.alpha = Flash2GlobalVariables.alphavalue; 20. }
35
5. Applying Data Visualization in Database Studies
We need a working software system to demonstrate the VDL model in real time. For this
purpose we have chosen a personnel and training management system,
5.1 Description of the Database Application System
The Personnel Training System is a Web based system which maintains all the details regarding
the employee’s skills, certificates, projects, and companies and properly shows the required skills
for an employee to be placed in a project. This Web based system is backed up by a database to
store the details regarding the employee’s & companies which gives us the opportunity to turn
this system into an efficient learning system.
A personnel training system collects the working skills of employee’s and finds the
missing skills in each employee to provide them with proper training. Once the employee has all
the skills required according to industry standards the employee is placed in an appropriate
company. We have simplified this system. The following diagram provides an overview of the
36
Figure 17
The considered database serves two subsystems namely the personnel system and the
training system.
The personnel system manages information of persons and organizations that hold jobs of
positions. Some jobs are associated with projects. The training system provides two types of
learning opportunities, academic courses and job related training. The mission of the training
system is to fill up any knowledge/skill gap between the personnel’s possession and the
requirements of the jobs.
A person may work on one or more jobs. A job is described as a position that requires
37
special skills in addition to the skills required by its corresponding position. Typically, there are
multiple jobs of the same position.
The training system manages information of workers’ education, skills and training, and
to help find workers suitable for a job. Generally, academic courses help students learn
knowledge; training courses help trainees gain skills.
5.1.1 Developing The Underlying System
The underlying system is a three tier architecture with the following components,
a) JSP pages serve as the front end
b) Java Beans as the middle end and
c) Oracle server as the back end.
The front end JSP pages play a simple role of collecting the required information and send it to
the Java Bean classes in the middle end. These java classes serve as the core of this system.
These classes communicate with front end and the back end applications to run the system, so we
have carefully developed three categories of these bean classes.
a) PersonCatalog
The PersonCatalog retrieves and processes all the information regarding the employees ranging
from personal information to current working status of employees
b) JobCatalog
The JobCatalog processes the information regarding the available jobs, required knowledge
skills, and missing knowledge skills.
38
The Company bean accesses the company profiles, the number of employees working in
company and the salary for each of the company employees.
The backend Database plays a key role of storing the information processed by the bean
classes in the middle tier. The following ER-diagram provides basic outline about the database
architecture.
39
5.2 Turning the Production System to a VDL System
In order to use the aforementioned database application as a VDL system, many features have
been added to turn it into a learning system. The two major changes are the bugs implanted in the
queries, and a visual tool that shows the operations performed on a database.
We have systematically implanted bugs in the functioning system in order to make the
students identify the bug and get a better understanding of the working software systems.
The goal of this learning system is to make students understand the query operations
performed on database, so we have implanted the bugs in SQL queries. The visual tool is the tool
which interprets the query operations. This tool used by the students to examine the query
operation performed on the database. We have developed learning cases to systematically
implant bugs.
5.2.1 Learning Case
Learning Case #1: List a company’s workers by names.
In the first learning case, the Web application sends a request to the database to list all the
employees working in a company.
The query to retrieve the workers names by company is,
SELECT person.first_name, person.last_name FROM person, job
WHERE person.job_code=job.job_code AND job.comp_id='"+comp_name+"' ORDER BY first_name
To convert this case into a learning case we have implanted a bug by removing the WHERE clause from the original query,
SELECT person.first_name,person.last_name FROM person, job
40
Since the WHERE clause is omitted, the modified query’s result will display employee names from all the companies.
Objective: To learn about the importance of conditions in the WHERE clause.
Procedure:
The student selects the company id for which he/she wishes to list the names of employees and
hit the submit button.
Results:
The result from the database contains the following values,
FIRST_NAME LAST_NAME
JOHN SMITH
JOHN SMITH
JOHN SMITH
JOHN SMITH
KAPIL POTHAKANOORI
KAPIL POTHAKANOORI
KAPIL POTHAKANOORI
KAPIL POTHAKANOORI
KATE SOLOMON
KATE SOLOMON
KATE SOLOMON
KATE SOLOMON
PETER SOLOMON
PETER SOLOMON
PETER SOLOMON
PETER SOLOMON
SIRISHA TANKASHALA
SIRISHA TANKASHALA
SIRISHA TANKASHALA
SIRISHA TANKASHALA
By observing the above values, students can understand that a bug is implanted in the query. To
identify the bug, students can examine the dynamic visual tool which provides with detailed
41
42
Figure 20
By examining the extended query results displayed by the visual tool, student can understand
that employee names from all the companies are displayed instead of the specified company.
Now the “what’s wrong?” option in the learner’s corner can be utilized to check the answer.
After selecting the option “Employees from all the companies are displayed” we will advance to
43
Figure 21
Learning Case #2: List a company’s staff in the descending order of their salary.
In the second learning case, the Web application sends a request to the database to list all the
employees working in a company in descending order of their par rate.
The following query is used by the underlying system to list the employee names,
SELECT person.first_name, person.last_name FROM person, job
WHERE person.job_code = job.job_code AND job.comp_id='"+comp_name+"' ORDER BY pay_rate DESC
But to transform this case into a learning case, the “DESC” parameter on the ORDER BY clause,
which sorts all the resulting tuples in descending order of the pay rate, was purposefully omitted
44 SELECT person.first_name, person.last_name FROM person, job
WHERE person.job_code=job.job_code AND job.comp_id='"+comp_name+"' ORDER BY pay_rate
Objective: To show that the default sorting may not meet the requirement of an application
Procedure:
The student select’s the appropriate company id from the given list of companies and hit the
submit button
Results:
The results displayed after executing the incorrect query is,
When the student examines the dynamic visual tool, the student can easily spot that the employee
names are displayed in ascending order instead of the requested descending order. FIRST_NAME LAST_NAME
SIRISHA TANKASHALA
JOHN SMITH
45
46
Figure 23
The “what’s wrong?” option in the learner’s corner can be utilized to check the answer. After
selecting the option “Ascending order of employees is displayed” we will advance to the next
learning case.
Learning Case #3: List all the workers who are working for a specific project.
In the third test case, the Web application sends a request to the database to list all the employees
working in a specific project.
47 SELECT first_name, last_name
FROM project, person, project_jobs
WHERE project.proj_id = 'proj_id' AND person.job_code = project_jobs.job_id AND project.proj_id = project_jobs.proj_id
But to convert this case into a learning case, the person id and gender of the each of the
employees is displayed instead of the first and last names of the employees working in the
project
SELECT per_id, gender
FROM project, person, project_jobs
WHERE project.proj_id = 'proj_id' AND person.job_code = project_jobs.job_id AND project.proj_id = project_jobs.proj_id
Objective: To find the missing column in the result
Procedure:
Select the appropriate project id from the given list of projects and hit the submit button
Results:
FIRST_NAME LAST_NAME
P002 M
P003 F
P004 M
With the obtained result student clearly understands that the query was executed incorrectly. To
48
Figure 24
By looking at the visual interpretation, students can easily identify that instead of showing the
employee names working in the projects, the person id and gender is being displayed. The
“what’s wrong?” option in the learner’s corner can be utilized to check the answer. After
selecting the option “person id and gender of employees is displayed” we will advance to the
next learning case.
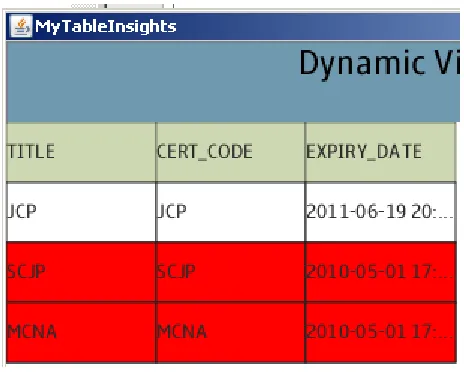
Learning Case #4: List a person’s active certificates.
In the fourth test case, the Web application sends a request to the database to list the person’s
active certificates.
49 SELECT title
FROM certificate, person_certificate
WHERE per_id = 'person_id' AND person_certificate.cert_code = certificate.cert_code AND certificate.expiry_date > current_timestamp
In this case the condition in the WHERE clause which compares the dates is omitted, so both
active and inactive certificates are displayed
SELECT title
FROM certificate, person_certificate
WHERE per_id = 'person_id' AND person_certificate.cert_code = certificate.cert_code
Objective: To show that the date field plays a crucial role in systems
Procedure:
Select the appropriate person id from the given list of person’s and hit the submit button
Results:
TITLE SCJP JCP
After reviewing the above results and the following visual tool the student can grasp that both
50
Figure 25
The “what’s wrong?” option in the learner’s corner can be utilized to check the answer. After
selecting the option “Both the active and inactive certificates are displayed” we will advance to
the next learning case.
Learning Case #5: List the required knowledge/skills of a position in a readable format.
In the fifth test case, the Web application sends a request to the database to list the required
51
In this case we have not implanted any bug in the SQL query.
SELECT ks.title
FROM position p, position_skills ps, knowledge_skill ks
WHERE ks.ks_code = ps.ks_code AND ps.pos_code = p.pos_code AND p.pos_code = 'position_id'
Objective: To demonstrate the working of a system without any bugs
Procedure:
Select the appropriate position id from the given list of positions and hit the submit button
Results:
TITLE
KnowledgeSkill001 KnowledgeSkill002 KnowledgeSkill004
Now, if the student examines the above result and the following visual tool, he/she can infer that
52
Figure 26
The “what’s wrong?” option in the learner’s corner can be utilized to check the answer. After
selecting the option “Nothing is wrong” we will advance to the next learning case.
Learning Case #6: Insert a new person with all the required details into the database.
In the sixth test case, the Web application sends a request to the database to insert data about a
person into person table.
The original query is,
53
VALUES ('TOM', 'WILLIAMS', 'P000', '[email protected]', 'M', '3456 STREET ', 'NEW ORLEANS', 'LA', 'J000');
The first and last names of the person are swapped with each other to convert this case into a
learning case,
INSERT INTO person (FIRST_NAME, LAST_NAME, PER_ID, EMAIL, GENDER, STREET, CITY, STATE, JOB_CODE)
VALUES ('WILLIAMS', 'TOM', 'P000', '[email protected]', 'M', '3456 STREET ', 'NEW ORLEANS', 'LA', 'J000');
Objective: To learn about the INSERT statement
Procedure:
Enter the person details in the form and click on the submit button
After getting a success notification from the database the student can review the table by looking
54
Figure 27
In the visual tool the student can inferred that the first and last names are swapped.
The “what’s wrong?” option in the learner’s corner can be utilized to check the answer. After
selecting the option “first and last name are swapped in database” we will advance to the next
learning case.
Learning Case #7: Update a previously inserted record in the database.
In the seventh learning case, the Web application sends a request to the database to update data
about a person in the person table. The where clause is omitted because of which all the persons
job_code is updated with new job_code
//original query UPDATE job
55 //modified query
UPDATE job
SET job_desc='DEVELOPER'
Objective: To emphasize the critical role of the WHERE clause in UPDATE statement by
illustrating a disastrous result of a mistake.
Procedure:
Student selects the desired row whose job description has to be updated
After receiving a success notification from database, the visual tool shows the table with all the
changes that have been made.
Figure 28
From the visual tool the student can understand that all the rows are updated instead of the
56
The “what’s wrong?” option in the learner’s corner can be utilized to check the answer. After
selecting the option “All records are updated instead of one record” we will advance to the next
learning case.
Learning Case #8: Delete expired certificates from the certificates table.
In the eight and the last test case, the Web application sends a request to the database to delete
expired certificates from certificate table.
The where clause is again omitted because of which all the rows are deleted from the table.
//original query DELETE certificate
WHERE expiry_date < current_timestamp
//modified query DELETE certificate
Objective: To emphasize the critical role of WHERE clause in DELETE statement
Procedure:
Enter the expiry date to compare with the records in the table
After getting the success notification from the database, the visual tool highlights the disaster
57
Figure 29
The “what’s wrong?” option in the learner’s corner can be utilized to check the answer. After
selecting the option “All records are deleted instead of expired record” we will advance to the
58
6. Discussion & Conclusion
The aim of Verification Driven learning model is to help the students understand the key
elements of database systems more thoroughly and intriguingly. To achieve this goal a rigorous
research work is still needed. In order to validate our tool, we have to develop more learning
cases and apply the learning cases in classrooms. The modulized components for visualization
59
References
[1] K. Sung, “Computer Games and Tranditional CS Courses”, CACM, 52(12), 74-78, Dec. 2009
60
Vita
Aditya Reddy Kallem was born in Hyderabad, India. He earned his Bachelor’s Degree in
Computer Science as major at Osmania University, India from 2004 to 2008. He was enrolled in
the graduate program in Computer Science Department at the University of New Orleans in