University of New Orleans University of New Orleans
ScholarWorks@UNO
ScholarWorks@UNO
University of New Orleans Theses and
Dissertations Dissertations and Theses
5-14-2010
Exploring the Moderating Effects of CU traits on the Relationship
Exploring the Moderating Effects of CU traits on the Relationship
Between Social Intelligence and Aggression
Between Social Intelligence and Aggression
Gregory Fassnacht
University of New Orleans
Follow this and additional works at: https://scholarworks.uno.edu/td
Recommended Citation Recommended Citation
Fassnacht, Gregory, "Exploring the Moderating Effects of CU traits on the Relationship Between Social Intelligence and Aggression" (2010). University of New Orleans Theses and Dissertations. 1186.
https://scholarworks.uno.edu/td/1186
Exploring the Moderating Effects of CU traits on the Relationship Between Social Intelligence and Aggression
A Thesis
Submitted to the Graduate Faculty of the University of New Orleans in partial fulfillment of the requirements for the degree of
Master of Science In
Psychology
By
Gregory Fassnacht
B.A., Loyola University, 2005
Table of Contents
List of Tables ... iii
Abstract ... iv
Introduction ...1
Methods...21
Measures ...22
Procedures ...25
Results ...26
Discussion ...39
References ...46
Vita ...54
List of Tables
Table 1 ...27
Table 2 ...32
Table 3 ...34
Table 4 ...36
Table 5 ...37
Abstract
The purpose of this study was to examine the potential moderating effects of CU traits on
the relationship between self-reported social intelligence and aggression in a community sample
of boys and girls (ages 14-18). Four subtypes of aggression were measured: reactive overt,
reactive relational, proactive overt, and proactive relational. Results indicated that there was not
a significant association between social intelligence and any of the aggression subtypes. Neither
CU traits nor empathy moderated the association between social intelligence and any of the four
subtypes of aggression. Supplementary analyses were conducted to investigate whether level and
type of aggression was related to levels of social intelligence and CU traits (or an interaction
between the two). Results indicated that at high levels of CU traits, youth exhibited significantly
higher levels of proactive overt and reactive overt aggression (t(113.06) than at low levels of CU
traits.
Introduction
Overview of Aggressive Subtypes
Over the years, research has demonstrated that aggression is not a unified construct, but
one that can be broken down into distinctive forms and functions (Bailey & Ostrov, 2008; Card
& Little, 2006; Marsee & Frick, 2007). Research has supported two distinct forms of aggression
(overt and relational) (Card, Stucky, Sawalani, & Little, 2008; Crick, 1996; Crick & Grotpeter,
1996; Rys & Bear, 1997). Overt aggression, commonly referred to as physical or direct
aggression, consists of behaviors that are intended to cause bodily or emotional harm through
direct physical (e.g., hitting or kicking) or verbal assaults (Crick & Grotpeter, 1996). In contrast,
researchers have defined relational aggression as behaviors that “represent purposeful attempts to
harm, or threats to harm, another’s peer relationships” (e.g., gossiping or group exclusion) (Crick
& Grotpeter, 1995, p. 712). Research has shown that relational and overt aggression are
generally moderately to highly positively correlated in measures of peer nominations (e.g., r=
.57, Crick & Grotpeter, 1996; r = .54, Crick & Grotpeter, 1995) and self-report measures of
community and detained samples of adolescents (disattenuated r =.83, Little, Jones, Henrich, &
Hawley, 2003; r= 0.73, Marsee & Frick, 2007) and this is generally consistent across age and
gender. Using factor analyses, research has supported the distinction of overt/physical and
relational/indirect aggression in a sample of preschoolers using teacher and peer-nomination
measures (Crick, Casas, & Mosher, 1997) and maternal reports of aggression in a four year
longitudinal study of boys and girls between the ages of 4 to 11 (Vaillancourt, Bredgen, Boivin,
& Tremblay, 2003).
Similar to relational aggression, researchers have also identified both indirect and social
behaviors that use social manipulation to attack others in a covert way that does not place the
attacker directly into any harm that may result from retaliation. Although it has been argued that
relational and indirect aggression are one and the same (Björkvist, 2001), the subtle difference
between the two types of aggression is that indirect aggression is covert (e.g., spreading harmful
rumors), whereas relational aggression encompasses both indirect and direct acts (e.g., telling
someone that you will not be his or her friend anymore) that are geared to destroying someone’s
social support. In addition, Galen and Underwood (1997) use the term “social aggression” to
refer to aggression that focuses on “damaging another’s self-esteem, social status, or both, and
may take direct forms such as verbal rejection, negative facial expressions or body movements,
or more direct forms such as slanderous rumors or social exclusion” (p. 589). Thus, social
aggression includes both indirect and direct acts, as well as some non-verbal bodily cues. Despite
the conflict in names, most researchers agree that relational, indirect, and social aggression share
the common underlying goal of harming another individual using social manipulation strategies
(Björkqvist, 2001).
Two functions of aggression have also been identified (proactive and reactive), and they
are based on the reason behind the aggressive act. Proactive aggression has been defined as
aggression that is designed to acquire some sort of gain (Dodge, 1991; Dodge & Coie, 1987),
whereas reactive aggression has been defined as aggression that is an angry response to some
perceived harm or wrong (Berkowitz, 1993). These functions of aggression tend to be highly
correlated in teacher reports of children who were about 8 years old (r= .77, Hubbard et al.,
2002) and self reports of detained adolescents(r= .65, Marsee & Frick, 2007) and are generally
consistent across gender. Factor analyses have supported a two factor model for reactive and
= 10. 65 years) (Poulin & Boivin, 2000) and a sample (N= 334) of sixteen year old adolescent
boys (Raine, et al., 2006). Each of these functions of aggression has unique cognitive and
emotional correlates, which supports the distinction between them and suggests that they may
develop differently and require different types of treatment.
Recent research has started to emerge that suggests that both relational and overt
aggression can be used reactively and proactively (Bailey & Ostrov, 2008; Marsee & Frick,
2007; Marsee, Weems, & Taylor, 2008; Ostrov & Houston, 2008). Self-report studies of children
(Marsee et al., 2008), adolescents (Marsee & Frick, 2007; Marsee et al., 2008), and emerging
adults (Bailey & Ostrov, 2008; Ostrov & Houston, 2008) have shown that the four subtypes are
moderately to highly positively correlated and demonstrate acceptable internal consistency
(Cronbach’s α > .69). Specifically, studies have shown that youth engage in four distinct
subtypes of aggression: reactive relational, proactive relational, reactive overt, and proactive
overt, and that each of these subtypes has unique cognitive, emotional, and personality pathology
correlates. Studies have provided evidence that there is good internal consistency (coefficient
alphas: reactive overt = .85-.87; proactive overt = .82 - .84; reactive relational = .80 - .83;
proactive relational = .74 - .76) among the subtypes for both detained girls (Marsee & Frick,
2007) and a community sample of youth between the ages of 6 to 17 (Marsee et al., 2008).
Development and Correlates of Reactive and Proactive Aggression
Different theories have emerged to explain the development of the proactive and reactive
aggressive functions. Reactive aggression is rooted in the frustration-aggression model
(Berkowitz, 1989; Berkowitz, 1999), and has been described as an angry response to perceived
provocation. Proactive aggression is seen to have its roots in the social learning theory (Bandura,
order to obtain a desired goal. The maintenance of reactive and proactive aggression can be
described by Dodge’s social information processing (SIP) theory (Crick & Dodge, 1994, Crick &
Dodge, 1996; Dodge & Coie, 1987). According to the SIP models, children’s social behavior is
controlled by specific sequential steps of functioning, which include 1) encoding of social cues,
2) interpretation of social cues, 3) clarification of goals, 4) response access or construction, 5)
response decision, 6) and behavioral enactment (Crick & Dodge, 1994; Crick & Dodge, 1996). It
is believed that how well one progresses through each step will affect whether one will behave
appropriately in a situation or engage in deviant behavior. Two SIP patterns have been
associated with aggressive children. The first pattern is the misinterpretation of social cues (the
second step of the previously mentioned model) leading to the manifestation of hostile
attributional biases (which is attributing malicious intentions to ambiguous provocation more
often than normal children) (Crick & Dodge, 1996). Research has supported that this pattern
exists in children, adolescents, and emerging adults who are more reactively aggressive (Bailey
& Ostrov, 2008; Crick & Dodge, 1994; Crick & Dodge, 1996).
For example, a study conducted by Bailey and Ostrov (2008) using 165 young college
men and women (mean age was 19.05 years) explored the association between self-reported
aggression and hostile attribution biases as assessed using vignettes. Results indicated that
reactive physical aggression had a unique association with hostile attribution biases for
instrumental provocation situations (e.g., “the student spills the drink all over your back”) and
reactive relational aggression had a unique association with hostile attribution biases for
relational provocation scenarios (e.g., “you have not been invited to this party”) when controlling
for gender and all other subtypes.
model. This pattern shows that proactively aggressive children and adolescents are more likely to
expect positive outcomes to happen as the result of their aggressing and they believe themselves
to be more competent when aggressing than other less aggressive children (Crick & Dodge,
1996; Dodge, Lochman, Harnish, Bates, & Petit, 1997; Marsee & Frick, 2007). Using self-report
measures, Marsee and Frick (2007) found in a sample of 58 detained girls (aged 12 to 18), that
proactive relational aggression was more strongly associated with possessing positive outcome
expectations for acts of aggression they committed on a same sex peer. Proactive overt
aggression was also uniquely associated with lower expectations for punishment when
controlling for reactive overt aggression.
In addition to unique cognitive correlates, reactive and proactive aggression also show
unique emotional and psychosocial adjustment correlates. For example, research has shown that
reactive aggression is uniquely associated with emotion dysregulation, which is the inability to
control one’s emotions (Card & Little, 2006; Little et al. 2003; Marsee, 2008; Marsee & Frick,
2007). Marsee and Frick (2007) found that reactive relational but not proactive relational
aggression significantly accounted for variance in anger to provocation. Also, results
demonstrated that reactive overt aggression but not proactive overt aggression was significantly
associated with poor emotional regulation (emotional dysregulation).
The previously mentioned research suggests that reactive aggression is characterized by
emotional reactivity and dysregulation. Conversely, research suggests that it is the lack of
emotional reactivity that sets proactive aggression apart from reactive aggression. Specifically,
research has shown that proactive aggression is positively associated with callous and
unemotional (CU) personality traits, which are described as a particular affective (absence of
others for one’s own gain) (Frick, Cornell, Barry, Bodin, & Dane, 2003; Kimonis, Frick, Boris,
et al., 2006; Marsee & Frick, 2007) and also low emotional reactivity, which was measured by
skin conductance and heart rate acceleration (Hubbard et al., 2002). Marsee and Frick (2007)
found that proactive overt aggression was also uniquely associated with CU traits when
controlling for reactive overt aggression. However, when controlling for proactive overt
aggression, proactive relational aggression had significant amount of unique variance in CU
traits. When controlling for proactive relational aggression, proactive overt aggression had only
minimal variance in CU traits, which shows that proactive relational aggression had the stronger
association with CU traits among the detained girls who participated in that study.
In support of the unique association between proactive aggression and the lack of
emotional reactivity, Kimonis, Frick, Fazekas, and Loney (2006) found that in a sample of boys
and girls (Mean age = 9) regardless of sex, proactive aggression was negatively and uniquely
associated with responsiveness to distressing stimuli when controlling for reactive aggression. In
this particular study, a dot probe task was used to determine whether a variety of different picture
types that are emotionally charged (i.e., threatening, distressing, positive emotion) would help
facilitate reaction time to the task. Youth that were considered to be proactively aggressive,
according to parent and self-report measurements, did not show an increased response time when
presented with distressing pictures. This indicated that those who were high on proactive
aggression showed the expected lack of emotional responsiveness to stimuli that was designed to
elicit distress.
In a meta-analytic review of the differential correlates of reactive and proactive
aggression, Card and Little (2006) showed that reactive aggression is more significantly related
showed that with a sample of youth aged 6 to 17, reactive relational aggression was uniquely
associated with anxiety when controlling for both reactive overt and proactive overt aggression
(Marsee et al., 2008). Furthermore, this association was moderated by gender, where males with
high anxiety showed higher levels of reactive relational aggression than girls or males with low
anxiety. This indicated that possessing higher levels of anxiety may increase the likelihood that
someone chooses a safer and covert means of retaliation. Another finding from Card and Little
(2006) was that reactive aggression was more strongly associated with symptoms of ADHD than
was proactive aggression. In terms of psychosocial adjustment, reactive aggression was found to
have a significant positive relationship to victimization, whereas proactive aggression had a
significant negative association with victimization (Card & Little, 2006).
Other research has found support for unique associations between the aggressive
subtypes and personality characteristics. Research using self-report measures has shown that
both reactive and proactive relational aggression subtypes were associated with features of
borderline personality disorder, even when controlling for the two subtypes of physical
aggression and gender (Ostrov & Houston, 2008). Ostrov and Houston have also found that
proactive physical aggression was uniquely and positively associated with fearless dominance
and reactive relational aggression was a unique negative predictor of fearless dominance. This
indicates that those who exhibit more proactive physical aggression are more inclined to possess
superficial charm, have higher sensation seeking tendencies, and have low stress proneness,
while those who exhibit more reactive relational aggression are less inclined to possess these
tendencies. Finally, for women but not men in this study, proactive relational aggression was
shown to be significantly associated with impulsive antisociality, which represents behaviors and
There is ample research that supports the distinctiveness between the reactive and
proactive aggression functions. As previously demonstrated, reactive aggression has a positive
association with emotional reactivity and dysregulation whereas proactive aggression has a
negative association with emotional reactivity and positive association with CU traits. Currently,
there is also research that supports and stresses the importance of the distinctiveness of the overt
and relational forms of aggression.
Development and Correlates of Relational and Overt Aggression
Decades of research has been conducted on the development of overt aggression and
research has shown that overt/ physical aggression is associated with externalizing problems and
poor peer relations (Card et al., 2008) as well as future maladjustment (Crick, 1995). Research
suggests that relational aggression has similar correlates as overt aggression and is at least as
harmful to both aggressors and victims (Crick, 1996; Crick & Grotpeter, 1995; Crick &
Grotpeter, 1996). However, there is evidence to support that relational aggression also has
unique correlates that set it apart from overt aggression. Research has supported that relational
aggression is uniquely related to psychosocial adjustment (Card et al., 2008; Crick, 1996; Crick
& Grotpeter, 1995; Rys & Bear, 1997). Crick and Grotpeter (1995) studied a sample of third to
sixth grade children using peer nomination and self-report techniques and found that those who
were rated as relationally aggressive reported higher levels of depression than non-relationally
aggressive children. However, it was only the relationally aggressive girls that reported having a
lower peer acceptance rate. In support of these findings, Crick (1996) used peer nomination and
teacher reports to assess overt and relational aggression in a sample of 245 third through sixth
data, the authors demonstrated that relational aggression significantly predicted future peer
rejection and negative changes in peer rejection for girls, even when controlling for overt
aggression.
Research has also demonstrated that regardless of gender or socio-economic status,
preschoolers aged 3-5 years old who are more relationally aggressive are more likely to be
victimized by relational aggression (Bonica, Arnold, Fisher, & Zeljo, 2003). Similarly, a self
report study by Crick and Grotpeter (1996) has demonstrated that while controlling for
victimization by overt aggression, victimization by relational aggression uniquely predicted
social anxiety, social avoidance, and loneliness in a sample of third through sixth graders.
The negative effects of relational aggression on psychosocial adjustment seem to warrant
further research due to their great impact on social and emotional development. Further, unlike
overt aggression, which tends to be more common among males (Bailey & Ostrov, 2008; Crick,
Casas, & Mosher, 1997), both sexes are equal victims of relational aggression (Bonica et al.,
2003; Crick & Grotpeter, 1996). Though victimization is equal across sex, research has found
gender differences in the use of relational aggression. Some research has demonstrated that girls
tend to use relational aggression more often than boys, while boys are typically found to be more
overtly or physically aggressive than girls (Bonica et al., 2003; Crick & Grotpeter, 1995).
Research has also demonstrated that preschoolers as young as three years old attribute physically
aggressive behaviors to boys and relationally aggressive behaviors to girls (Giles & Heyman,
2005). However, not all research is consistent. In a peer nomination study with fourth grade
children, no gender differences were detected in the use of relational aggression (Putallaz et al.,
2007). Further, in self report studies of adults, findings indicate that men and women have either
& Collins, 2002) and peer interactions (Burton, Hafetz, & Henninger, 2007) or that men may
use more relational aggression that women (Loudin, Loukas, & Robinson, 2003).
These inconsistencies in research on gender and relational aggression might be explained
by a variety of factors including age, measurement techniques, and statistical methods. One
explanation is that gender differences in relational aggression might increase with age. In one
study, researchers used peer nominations to assess physical and relational/indirect aggression
with three age cohorts: 8, 11, and 15 year olds (Björkqvist, Lagerspetz, & Kaukiainen, 1992).
The results indicated that at age 8 there were no significant gender differences between males
and females in relational aggression, but the results of the 11 and 15 year old cohort samples did
reveal significant gender differences, where females rated higher in relational aggression than
males. The authors believe that this form of aggression is more prominent in girls at an older age
because their verbal skills develop more quickly than boys, which allows them to manipulate
their close and intimate friendship groups.
Research has also shown that some measurements may be more useful in capturing
gender differences in relational aggression. Meta-analytic results indicate that studies using
observations, peer ratings, and teacher reports show females displaying greater amounts of
relational/indirect aggression than males than when other methods are used such as peer
nominations and self-reports (Card et al., 2008). Researchers have argued that when children
reach a certain age they may be less likely to report the use of relational aggression since they
may have aged to a point where that are susceptible to self report biases (Card et al., 2008, Crick
et al., 1997). In terms of peer nomination procedures, researchers have argued that
inconsistencies found using this particular method can be tied to ignoring of contextual
classes, which “eliminates any variation between classes” (Kuppens, Grietens, Onghena,
Michiels & Subramanian, 2008, p. 641). Peer nominations require the children in a classroom to
identify three classmates who they believe to be “relationally aggressive” or “overtly
aggressive.” Nominations for the categories are then summed and standardized within each
classroom, where the mean of each classroom is zero. This is somewhat problematic in that it
does not allow for gender comparisons to be made across classes. Inconsistencies in finding
gender differences can occur when grouping youth based on their aggression scores in that two
youth may both be one standard deviation above the mean, but may still have dramatically
different mean levels of aggression depending on the way their classmates scored. In contrast to
peer nominations, peer ratings require classmates to rate all other students in their class on levels
of relational and overt aggression using an interval scale. This method ensures that all children in
the class are rated and can be compared to one another.
Another potential reason for inconsistencies in gender findings is the fact that many early
studies examined relational aggression in youth without controlling for the overlap with overt
aggression (Crick & Grotpeter, 1995; Prinstein, Boergers, & Verberg, 2001). As previously
mentioned, relational and overt aggression are often very highly correlated in many samples and
children often show both types (Crick & Grotpeter, 1996; Crick & Grotpeter, 1995). Gender
differences may disappear when controlling for overt aggression, because males and females
may not differ on relational aggression when only looking at nonshared variance. In support of
this idea, research using peer nomination measures in preschoolers has shown that when overt
aggression is controlled for, no gender differences are found in relational aggression (Crick et al.,
1997).
aggressive than boys. Various perceptions of harm associated with relational aggression may
account for these gender differences. Research has shown that girls aged 11 to 15 were more
likely than boys to view indirect aggression, direct relational aggression, and social aggression as
harmful when asked to rate the level of harm they would feel using a Likert scale ranging from a
score of 1 “they would not feel sad or hurt at all” to 4 “they would feel REALLY sad or hurt”
(Coyne, Archer, & Eslea, 2006; p. 297). Different moral interpretations of relational aggression
may also account for gender differences. In a sample of fourth and fifth grade boys and girls,
Murray-Close, Crick, and Galotti (2006) demonstrated that girls hold different moral beliefs than
boys concerning relational aggression. In this study, the participants were read three physically
aggressive and three relationally aggressive scenarios and were asked to fill in a Likert scale that
assessed “how wrong the behavior was, how often the conduct resulted in harm, and the domain
used to judge each behavior” (Murray-Close & Crick, 2006; 351). Results showed that girls
tended to judge relational aggression as being more wrong from a moral standpoint than boys.
Taken together, these findings suggest that girls may have a better understanding of the
damaging effects of relational aggression than boys, and thus see it as an effective means of
aggression to attack their enemies.
Crick and Grotpeter (1995) suggested that gender differences in relational aggression
may be due to the tendency for youth to use the most effective type of aggression to damage
valued goals within their own gender peer groups. According to the authors, girls tend to focus
on developing close intimate relationships in their social interactions. Within such close-knit
groups, the social manipulation strategies that characterize relational aggression may be more
effective in maintaining one’s social status. It has also been suggested that girls tend to have
not so close friends (Björkqvist, K., Lagerspetz, et al., 1992). Relational aggression may be more
effective in smaller groups, where the focus in more intimate. In contrast to girls, boys tend to
focus on physical dominance in their relationships, which may explain the use of overt
aggression, since relational aggression may not be as effective. Conversely, in a larger group,
boys may need to use physical aggression to maintain dominance since more subtle relationally
aggressive behaviors may not be noticed. In support of this, researchers comparing three age
groups (Ages 8, 11, and 15) of boys and girls found that at age 15 there were gender differences
in relational aggression and that it was at this age that girls generally stayed in close intimate
pairings, whereas boys typically had a greater number of friends (Björkqvist, K., Lagerspetz, et
al., 1992).
Relational Aggression and Social Intelligence
Youth who use relational aggression to harm others may at the same time be bolstering
their own social status. In a study conducted by Eleni Andreou (2006), 403 Greek schoolchildren
who were in fourth through sixth grade participated in a study that required them to rate
popularity levels of the other students, while also assessing their overt and relational aggression
levels. Andreou found that overt aggression was positively correlated with perceived popularity
of boys and relational aggression was positively correlated with perceived popularity in both
boys and girls. Andreou suggested that relational aggression may allow for effective
management of “social power in ways that contribute to the popularity reputation” (p. 340).
These findings support other research that has shown that a positive bidirectional relationship
exists between relational aggression and perceived popularity for girls but not for boys (Rose,
Swensen, & Waller, 2004). Also, significant positive relationships between perceived popularity
lost its significant positive association with perceived popularity when controlling for relational
aggression.
How do those children that rate high on relational aggression maintain social popularity
and attain close friendships? Some theories suggest that the effective use of aggressive behavior
requires certain skills and strategies. One study based on resource control theory states that some
aggressive youth are able to maintain social prominence because they “possess the social skills
that can mitigate the effect of lesser behavior” (Hawley, Little, & Card, 2007). According to
resource control theory there are many strategies that can be used to acquire social prominence,
such as coercive strategies, prosocial strategies, and bistrategic (using a bit of both) strategies
(Pellegrino & Bartini, 2001). Coercive strategies include behaviors that are somewhat antisocial,
such as taking, threatening, and deceiving, whereas prosocial behaviors are those that are
described as behaviors that “win resources by forging alliances and other cooperative
relationships that yield long term benefits (p.171).” Hawley et al. (2007) found that 7th
through
10th graders who used both prosocial and coercive strategies in their friendships were rated as
having relationships with the most intimacy, fun, and conflict. Also, youth who used prosocial
and coercive strategies showed evidence of using high levels of overt and relational aggression.
These findings suggest that aggressive youth may use strategic behaviors in their friendships to
maintain social status. Such youth may need to be especially in tune with their peer group in
order to know which strategies will best serve their purposes.
In line with this idea, some researchers have suggested that aggressive youth need
specific social skills in order to effectively use aggression among their peers. Björkvist,
Österman, and Kaukiainen’s (1992) developmental theory suggests that aggression is a three
skills. According to this theory, the aggressive behavior of young children is primarily physical
and coincides with advances in motor skills. The next stage is entered when verbal skills begin to
develop, allowing for more peaceful interactions or new forms of aggression to emerge. One
study conducted by Bonica et al. (2003) showed that in 3 to 5 year old children, relational
aggression was positively and significantly associated with language development even when
controlling for age. Finally, it is during the third stage that the use of indirect aggression becomes
more common. Björkvist, Osterman, et al. (1992) suggest that this type of aggression develops
along with social skills, and suggest that in order to efficiently use indirect aggression one would
need to possess social intelligence. Those who possess social intelligence are said to have an
ability to understand what other people want, are able to read social cues that may be subtle in
nature, and can flourish in social situations (Silvera, Martinussen, & Dahl, 2001). Possessing a
high amount of social intelligence may allow an individual to aggress differently compared to
individuals who do not possess high levels of social intelligence or it may act as protection
against becoming a victim of aggression. In a sample of fifth grade (mean age was 11-12 years)
Finnish children, peer nomination measurements have indicated that a significant negative
correlation exists between social intelligence and victimization (Kaukiainen, et al. 2002).
Therefore, those who had high social intelligence were less likely to be bullied. This seems to
suggest that social intelligence may have some protective component.
Previous research has explored the relationship between social intelligence and
aggression (Kaukiainen et al., 1999). Using peer estimations from participants who were
between 10 and 14 years old for social intelligence and a self-report measure for physical, verbal,
and indirect aggression, researchers found that social intelligence was positively correlated with
when the other two forms of aggression were partialled out (Kaukiainen et al., 1999). This
finding gives support to the theory that indirect aggression may require someone to have social
intelligence, while overt forms of aggression may not (Björkvist, Lagerspetz, et al. 1992). This
seems to suggest that those who are higher in social intelligence are more inclined to use a means
of aggression that is less likely to result in retaliation.
Aggression, CU Traits, and Empathy
As previously mentioned, certain subtypes of aggressive behavior are associated with a
callous and unemotional personality style. CU traits are defined as a particular pattern of
affective (absence of guilt, constricted display of emotion) and interpersonal (failure to show
empathy, use of others for one’s own gain) deficits that have been consistently shown to be tied
to higher rates of conduct problems (Essau, Sasagawa, & Frick, 2006; Frick, Kimonis,
Dandreaux, & Farrell, 2003; Frick, Stickle, Dandreaux, Farrell, & Kimonis, 2005) and
psychosocial impairment (Essau et al., 2006), and seem to designate a more dangerous subset of
antisocial youth (Frick et al. 2005). The possession of CU traits not only predicts the severity of
the crimes, but also has been reported to be stable in nature from late childhood and early
adolescence using parent reports (Frick et al., 2005; Frick, Kimonis, et al., 2003). In a one year
follow-up study with a sample of ninety-eight children from grades third, fourth, sixth, and
seventh grades (M= 12.43 years), parent and teacher reports were given to assess CU traits and
self-reports were used to assess levels of delinquency and functions of aggression (Frick,
Cornell, Barry, Bodin, & Dane, 2003). One year later, the children filled out self reports of
delinquency and an assessment designed to distinguish between proactive and reactive forms of
conduct behavior problems in terms of number and variety. Also, children with CU traits and
conduct problems were more likely to rate higher on self-reports of delinquency. Those
possessing CU traits and conduct problems rated higher on proactive aggression than those who
were rated high on conduct problems alone.
The findings indicating that proactive aggression is uniquely associated with CU traits
have been supported by previous research (Kimonis, Frick, Boris, et al. 2006; Kimonis, Frick,
Fazekas, & Lonely, 2006, Marsee & Frick, 2007). Using a high risk preschool sample, Kimonis,
Frick, Boris, and colleagues (2006) found that CU traits were significantly related to proactive
aggression, but not reactive aggression. Research has also supported a unique association of CU
traits with general relational aggression in a community sample of youth (Marsee, Silverthorn, &
Frick, 2005) and with proactive relational aggression in a detained sample of girls (Marsee &
Frick, 2007).
Studies examining lack of empathy (a component of CU traits) suggest that lacking
empathy may increase aggressive behavior in others (Gini, Albiero, Benelli, & Gianmarco, 2007;
Loudin et al., 2003). Using peer nomination scales for aggression and a self report measure for
empathy in a sample of college students, Loudin et al. (2003) showed that two components of
empathy (perspective taking and empathetic concern) are associated with relational aggression.
Perspective taking, defined as the cognitive component of empathy and assesses the ability to
spontaneously adopt the viewpoint of others, was negatively associated with relational
aggression across gender. However, it was only found for males that lower levels of empathetic
concern, which is the tendency to feel concern or warmth for another person, were associated
with higher levels of relational aggression. Gini et al. (2007) have shown that in males low levels
with defending victims of bullying behavior.
It is clear from research on CU traits, empathy, and aggression that a lack of empathy for
others may play an important role in a youth’s engagement in aggressive acts, especially those of
a proactive nature (Kimonis, Frick, Fazekas et al., 2006; Marsee & Frick, 2007). This seems to
be true for both proactive overt and proactive relational aggression (Marsee & Frick, 2007).
Recently, researchers have begun to examine the role of social intelligence in the relationship
between relational aggression and empathy. A recent literature review found that when
researchers controlled for empathy, all relationships between social intelligence and aggression
increased (Björkvist et al., 2000). Among the findings, increased use of indirect aggression
tended to be found in socially intelligent individuals who lacked empathy, while those
individuals who ranked high on social intelligence and empathy tended to be good at conflict
resolution (Björkvist et al., 2000). These findings support the idea that empathy may explain the
link between social intelligence and relational/indirect aggression, suggesting that a lack of
empathy is needed for one possessing high social intelligence to engage in such aggressive acts
(Björkvist et al., 1999). Possessing empathy may prevent those who have a superior ability to
read, perceive, and manipulate others from engaging in aggressive behavior that could have
long-lasting negative social effects. Conversely, a lack of empathy or the presence of CU traits,
along with high levels of social intelligence, may predispose a youth to engage in higher levels
of relational aggression of a proactive nature.
Statement of the Problem
Researchers agree that aggressive behavior is multidimensional and consists of different
distinctiveness and associations with unique developmental correlates (Card et al., 2008; Crick &
Grotpeter, 1995; Crick, 1996; Rys & Bear, 1997). Examination of these correlates is crucial in
order to understand the development of aggression and also has important implications for
intervention with aggressive youth.
Of particular recent interest in the aggression literature is the distinction between
relational and overt aggression. While these subtypes are similar in many ways, much less is
understood about the development of relational aggression as compared to overt aggression.
However, one developmental theory has been proposed to explain the emergence of
relational/indirect aggression in youth (Björkqvist, Lagerspetz, et al., 1992; Björkqvist,
Österman, et al., 1992), and this theory stresses the importance of social intelligence as key to the
effective use of this type of aggression, particularly when combined with a lack of empathy.
However, this research did not examine whether social intelligence was differentially associated
with reactive versus proactive relational aggression. The proposed study seeks to address this
question, with the expectation that social intelligence will show a stronger association with
proactive relational aggression.
Secondly, the study sought to examine the relationship between social intelligence, lack
of empathy, CU traits, and the subtypes of relational aggression. Numerous studies have
examined the association between CU traits and aggression. Results consistently indicate that
CU traits show a stronger association with proactive aggression than reactive aggression, and this
appears to be true for both relational and overt forms of aggression (Marsee & Frick, 2007).
Further, studies examining lack of empathy (a main component of CU traits) and aggression
suggest that low levels of empathy are associated with bullying behavior (Gini, 2007). These
important role in the relationally and physically aggressive behavior of children and adolescents.
Since social intelligence seems to explain variance in relational/indirect aggression after
controlling for empathy levels, it is expected that a similar relationship will emerge when
controlling for level of CU traits. That is, based on past research we expect both CU traits and
empathy levels to moderate the relationship between social intelligence and proactive subtypes
of aggression.
Hypotheses
1. Aggression will be correlated with social intelligence.
a. Proactive relational aggression is expected to be positively correlated with social
intelligence.
b. Reactive relational aggression is expected to be negatively correlated with social
intelligence.
c. Reactive overt aggression is expected to be negatively correlated or have no
association with social intelligence.
d. Proactive overt aggression is expected to be negatively correlated or have no
association with social intelligence.
2. The association between the proactive forms of aggression and CU traits will be significantly
stronger than the association between reactive forms of aggression and CU traits.
a. Proactive relational aggression is expected to have higher association with CU traits
than reactive relational aggression.
b. Proactive overt aggression is expected to have higher association with CU traits
aggression.
a. It is expected that there will be a positive correlation between proactive relational
aggression and social intelligence and that the relationship will be stronger for children
who are high on CU traits than those who are low on CU traits and that the difference
between the two will be significant.
4. CU traits is not expected to moderate the relationship between social intelligence and the other
three subtypes of aggression (i.e., reactive overt aggression, reactive relational aggression, and
proactive overt aggression).
5. Empathy will moderate the relationship between social intelligence and proactive relational
aggression.
a. It is expected that there will be a positive correlation between proactive relational
aggression and social intelligence and that the relationship will be stronger for children
who are low on empathy than those who are high on empathy and that the difference
between the two will be significant.
Methods and Design
Participants
Two local public high schools in southern Mississippi were targeted for data collection.
The targeted participants were the students enrolled in 9th through 12th grade (n estimated at
1,800 within the two schools combined). Parental consent forms were distributed during the first
period class in order to ensure that all of the students in the targeted grades received one. Only
1,300 of the 1,800 consent forms given to the first period teachers were distributed. Reminders to
turn in completed consent forms were sent out to the students a few weeks after the consent
participate in the study. Of the 317 students who had signed consent forms, 120 students did not
report to the testing area during any of the three days of collection. Additional students were
prevented from participating due to standardized test preparation, leaving only 177 possible
participants. 12 cases were not included in the final analyses because they were missing more
than half of the data points on the main measures of interest and 1 was not included because it
was an outlier on the social intelligence scale as identified by a z-score in excess of 3.29
(Tabachnick & Fidell, 2001). The final participating sample consisted of 164 students (61%
females) between the ages of 14 to 18 (M=14.97; SD = 1.10). The ethnicity of the sample
appeared to be representative of the entire student body. Of the students who participated, 63%
of the sample was Caucasian, 30% was African American, and 7% reported “other” for ethnicity.
Ethnicity was coded as 0 = minority (37%) and 1 = Caucasian (63%).
Measures
Demographic Survey A demographic survey was conducted in order to obtain
information about the participants’ age, gender, and ethnicity.
Peer Conflict Scale (PCS; Marsee & Frick, 2007) The PCS is a self report measure,
which contains 40 items that have been designed to measure aggression. Half the items are
designed to assess reactive and proactive forms of relational aggression (reactive: “I make new
friends to get back at someone who has made me angry; proactive: “I gossip about others to
become popular”). The other 20 items are used to assess the reactive and proactive forms of
overt aggression (reactive: “If others make me mad, I hurt them”; proactive: “I threaten others to
get what I want”). The items are rated on a four point scale (0= “not at all true,” 1= “somewhat
relational aggression scores can also be calculated by summing up each one’s 20 corresponding
items (range = 0-60). The PCS has shown good internal consistency for the four subtypes of
aggression in previous studies (coefficient alphas: reactive overt = .85-.87; proactive overt = .82
- .84; reactive relational = .80 - .83; proactive relational = .74 - .76) among detained girls
(Marsee & Frick, 2007); and a community sample of youth between the ages of 6 to 17 (Marsee
et al. 2008). Evidence has been accumulated that has shown that this measure is appropriate for
an adolescent population (Marsee & Frick, 2007) to find significantly unique correlates for
reactive and proactive aggression. Good internal consistency was demonstrated for the scores for
total reactive and total proactive aggression(Cronbach’s α: total reactive = .87; total proactive =
.86). For the purposes of this study the scores for each of the aggressive subtypes were calculated
and demonstrated adequate to good internal consistency (Cronbach’s α: proactive overt = .92;
proactive relational = .77; reactive overt = .78; reactive relational = .86).
Interpersonal Reactivity Index (IRI; Davis, 1983) The IRI is a 28-item self-report
instrument designed to measure cognitive and emotional aspects of empathy. The Index consists
of four 7-item subscales, each of which assesses a specific aspect of empathy. The
Perspective-Taking subscale measures an individual’s tendency to adopt the point of view of others (e.g., “I
try to look at everybody’s side of disagreement before I make a decision”). The Fantasy subscale
measures the tendency to take on the feelings of fictional characters (e.g., “I daydream and
fantasize, with some regularity, about things that might happen to me”). The Empathic Concern
subscale measures the tendency to experience feelings of warmth, compassion, and concern for
others (e.g., “When I see someone being taken advantage of, I feel kind of protective towards
them”). Finally, the Personal Distress subscale assesses an individual’s feelings of personal
when I am in the middle of a very emotional situation”). Items are rated on a five-point scale (1 =
“not true about me” to 5 = “extremely true about me”). For the purposes of the current study,
only the Perspective-Taking and Empathic Concern subscales (combined for a total empathy
score) were used. In the Italian population, there has been some evidence to support that this
measure is appropriate for adolescents (Gini, Albiero, Benelli, & Altoe, 2007). Gini et al. found
acceptable levels of internal consistency for the Perspective Taking scale (Cronbach’s α = .69)
and the Empathic Concern scale (Cronbach’s α = .73). The total empathy scale used in the
current study (i.e., the combined Perspective-Taking and Empathic Concern subscales)
demonstrated adequate internal consistency (Cronbach’s α = .73).
Inventory of Callous-Unemotional Traits (ICU; Frick 2004) The ICU is a 24-item
self-report questionnaire that is designed to assess callous and unemotional traits in youth that had
been previously adapted from a six-item scale of the Antisocial Process Screening Device
(Essau, Sasagawa, & Frick, 2006). The items are rated on a four point scale (0= “not at all true,”
1= “somewhat true,” 2= “very true,” and 3 = “definitely true”). This measure is composed of
items that are designed to measure three subscales of CU traits: Callousness, Uncaring, and
Unemotional. The first subscale is for the callous attitude towards others (“I do not care if I get
in trouble”). The second subscale measures the lack of caring about performance (“I always try
my best”). The third subscale is designed to measure the lack of emotional expression (“It is easy
for others to tell how I am feeling”). All positively worded items have to be reverse scored and
then the total score is calculated by summing up the items.
The total ICU scale has demonstrated adequate internal consistency (Cronbach’s α = .77)
in past research with German adolescents (Essau et al., 2006) and juvenile offenders (Kimonis,
the current study, the total ICU score demonstrated good internal consistency (Cronbach’s α =
.83). In the study with the sample of German adolescents, the total ICU score has shown good
concurrent validity to be significantly and negatively associated with the Big Five personality
traits such as extraversion (r = -.26, p < .001) and agreeableness (r =-.57, p <.001).
The study that used juvenile offenders demonstrated good construct validity with the total
ICU score has been correlated with measures on the four aggressive subtypes (reactive relational,
reactive overt, proactive relational, proactive overt) ranging from r = .27 to r = .44 ( p <.05, p
<.001, respectively) and all three types of self-reported delinquency (total, violent, and
nonviolent) ranging from r = .16 to r = .44 (p < .05).
Tromsø Social Intelligence Scale (TSIS; Silvera, et al., 2001) The TSIS is a 21-item self
report measure that is designed to measure social intelligence. There are 7 items dedicated to
measure the three factors of social intelligence: social information processing (“I can predict
other peoples’ behavior”), social skills (“I often feel uncertain around new people who I don’t
know”), and social awareness (“It seems I have often hurt others without realizing it”). The items
are measured on a 7 point Likert scale (1= “Describes me extremely poorly,” and 7= “Describes
me extremely well”). The negatively worded items are reverse scored, and all the items are
summed to get a total social intelligence score. Past research has shown that the TSIS for
adolescents showed acceptable levels of reliability across all three subscales (Social Information
Processing (Cronbach’s alpha = .80), Social Skills (Cronbach’s alpha = .79), and social
awareness (Cronbach’s alpha = .70) (Gini, 2006). Past research has usually only looked at the
alphas for the separate subscales. The total scale demonstrated relatively low internal consistency
Procedures
Before data were collected, the University of Mississippi’s Institutional Review Board
was contacted in order to obtain approval of the procedures of the study. The Mississippi School
District granted permission for conducting the study. All of the first period teachers were given
parental consent forms and invitations for the study, so that they could distribute them in class to
all of the targeted students in grades 9 through 12. A list of contacts for local mental health
facilities and services was attached to each consent form. Within three weeks of distributing the
consent forms, parents who did not respond to the study’s invitation were sent a reminder note.
Signed parental consent forms were necessary for any student wishing to participate in the study.
During their free period at school, the students who were willing to participate and had signed
parental consent forms were assessed in large groups on three separate days.
Packets containing the questionnaires were distributed to the students. Upon receiving the
packets, all of the students had the procedures for the study explained to them. The students were
then asked if they wanted to participate and they were informed that they could drop out of the
study at any time without any consequences. Those who agreed to participate were asked to write
their names on the assent forms, which was the front page of each packet. They were then asked
to tear off the assent form and use it to cover their answers while they worked, in order to help
maintain their privacy.
Instructions on how to complete the measures were read aloud to the students. The data
collection session lasted between 60 to 90 minutes. Once the packets were returned, each student
was given a coupon that allowed them to receive a snack food item at a fast food restaurant. Data
Results
Correlational Analyses
To test Hypothesis 1, bivariate correlations were conducted to assess the relationships
between the variables, especially to determine the association between social intelligence and the
overt and relational forms of aggression. Table 1 has all the means and standard deviations for
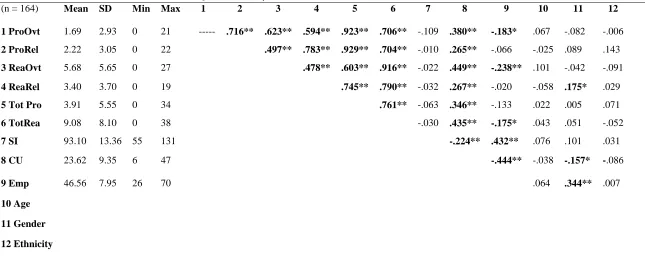
the variables. As can be seen in Table 1, the four subtypes of aggression were significantly
positively correlated with each other. The correlations between social intelligence (SI) and the
Table 1
Means, standard deviations, and correlations for main study variables
(n = 164) Mean SD Min Max 1 2 3 4 5 6 7 8 9 10 11 12
1 ProOvt 1.69 2.93 0 21 --- .716** .623** .594** .923** .706** -.109 .380** -.183* .067 -.082 -.006
2 ProRel 2.22 3.05 0 22 .497** .783** .929** .704** -.010 .265** -.066 -.025 .089 .143
3 ReaOvt 5.68 5.65 0 27 .478** .603** .916** -.022 .449** -.238** .101 -.042 -.091
4 ReaRel 3.40 3.70 0 19 .745** .790** -.032 .267** -.020 -.058 .175* .029
5 Tot Pro 3.91 5.55 0 34 .761** -.063 .346** -.133 .022 .005 .071
6 TotRea 9.08 8.10 0 38 -.030 .435** -.175* .043 .051 -.052
7 SI 93.10 13.36 55 131 -.224** .432** .076 .101 .031
8 CU 23.62 9.35 6 47 -.444** -.038 -.157* -.086
9 Emp 46.56 7.95 26 70 .064 .344** .007
10 Age
11 Gender
12 Ethnicity
To test Hypothesis 2, bivariate and partial correlations (controlling for other subtypes of
aggression) were used to examine whether the association between CU traits and aggression was
stronger for the proactive subtypes of aggression than the reactive subtypes and to determine the
level of association between CU and each of the four subtypes of aggression (reactive relational,
proactive relational, reactive overt, and proactive overt). As can be seen from the bivariate
correlations reported in Table 1, the association between CU traits and the proactive subtypes of
aggression (rs ranging from .265 to .380) was not stronger than the association between CU traits
and the reactive subtypes of aggression (rs ranging from .267 to .449). Using partial correlations,
when total reactive aggression was partialled out, the association between CU traits and
proactive aggression was not significant, however, when total proactive aggression was
partialled out the association between total reactive aggression and CU traits was still significant
(r = .281, p < .001). Using partial correlations, when reactive overt aggression was controlled
for, the relationship between proactive overt aggression and total CU was not significant (r =
.143, p > .05). However, when proactive overt aggression was controlled for, the relationship
between reactive overt and CU traits was significant (r=.293, p < .05). When controlling for
proactive relational aggression, the relationship between CU traits and reactive relational
aggression was not significant (r=.100, p > .05).When controlling for reactive relational
aggression, the relationship between CU traits and proactive relational aggression was not
significant (r = .093, p >.05).
Moderation Tests
In order to test Hypotheses 3 through 5, moderational regression analyses were
conducted. To test Hypotheses 3 and 4, four linear regression analyses were used to determine
subtypes of aggression. Both the CU traits and social intelligence variables were centered to
decrease the possibility of multicollinearity influencing results. For each of the linear regression
analyses one of the four subtypes was entered as the dependent variable, and total CU traits, total
social intelligence and an interaction term of social intelligence (centered) and CU traits
(centered) were entered simultaneously as predictors. Results indicated that for each of the
regression analyses, social intelligence was not a significant predictor of any of the aggressive
subtypes (proactive relational: β = .052, p > .05; proactive overt: β = -.027, p > .05; reactive
relational: β = .029, p > .05; reactive overt: β = .083, p > .05). However, CU traits was a
significant predictor for all subtypes of aggression (proactive relational: β = .277, p < .05;
proactive overt: β = .376, p < .05; reactive relational: β = .274, p < .05; reactive overt: β = .467, p
< .05). Social intelligence did not interact with CU traits as indicated by the non-significant
interaction terms in all four models (proactive relational: R2 = .055, R2 change = .000, β = -.009,
p > .05; reactive relational: R2 = 1.31, R2 change = .002, β = -.009, p > .05; proactive overt: R2 =
.055, R2 change = .000, β = -.045, p > .05; reactive overt: R2 = 1.93, R2 change = .000,β = .009 ,p
> .05). Since none of the interactions were significant, no post hoc probing was necessary.
To test Hypothesis 5, four linear regression analyses were used to determine whether
empathy moderated the relationship between SI and any of the four subtypes of aggression. Both
the empathy and social intelligence variables were centered. For each of the linear regression
analyses one of the four subtypes was entered as the dependent variable, and empathy, total
social intelligence and an interaction term of social intelligence (centered) and empathy
(centered) were entered simultaneously as predictors. Results indicated that for each of the
regression analyses, social intelligence was not a significant predictor of any of the aggressive
relational: β = -.024, p > .05; reactive overt: β = .098, p > .05). However, empathy was a
significant predictor for both reactive and proactive overt aggression (reactive overt: β = -.281, p
<.05; proactive overt: β = -.175, p <.05), but not for reactive or proactive relational aggression
(reactive relational: β = -.004, p >.05; proactive relational: β = -.073, p >.05). Social intelligence
did not interact with empathy as indicated by the non-significant interaction terms in all four
models (proactive relational: R2 = -.014, R2 change = .000, β = -.014, p > .05; reactive relational:
R2 = .018, R2 change = .001, β = -.019, p > .05; proactive overt: R2 = -.017, R2 change = .000, β =
.039, p > .05; reactive overt: R2 = .047, R2 change = .000, β = .004, p > .05). Since none of the
interactions were significant, no post hoc probing was necessary.
Supplementary Analyses
Additional analyses were conducted in order to investigate the relationship between the
aggressive subtypes, CU traits, and social intelligence. Due to the high correlation between the
aggressive subtypes (rs = .478 to .783), it was necessary to conduct analyses allowing for the
control of overlap among the subtypes. Thus, profile analysis was conducted in order to examine
potential differences in levels of CU traits and social intelligence across aggressive subtypes.
Profile analysis
To test whether or not level of aggression depended on level of CU traits and SI, a profile
analysis was performed. This method allows one to look for an interaction between aggression,
CU traits, and social intelligence. For this repeated measures multivariate analysis of variance
(MANOVA), the grouping variables (IVs) were CU traits and social intelligence, with groups for
each variable created by centering (creating a new variable where the mean is zero) the total CU
and social intelligence variables and using a mean split to divide them into high and low groups,
dependent variables were the four subtypes of aggression. This 2 (high and low CU traits) by 2
(high and low SI) by 4 (four aggression subtypes) repeated measures MANOVA was used to
determine whether individuals’ level of social intelligence and CU traits was associated with
differences in their levels of aggression.
Within subjects
First, the interaction between aggression, CU traits, and social intelligence within
subjects was explored. Taking into consideration that Mauchly’s test of sphericity was violated
(p < .001) (i.e., the variances of the differences between the levels of the repeated measures
factor were not equal), sphericity could not be assumed. To correct for the violation of sphericity,
results are reported using Greenhouse-Geisser, which alters the degrees of freedom, affecting the
significance value of the F-ratio. The results indicated that there was no significant interaction
F(1.83, 292.96) = .112, p >.05, η2 = .001, meaning that individuals’ levels of aggression did not
depend on the interaction of the levels of social intelligence and CU traits. There was a main
effect of aggression F(1.831, 292.96) = 77.60, p <.05, η2 = .327. Post-hoc analyses using paired
sample t-tests were conducted to find the aggression differences. Since multiple t-tests were run
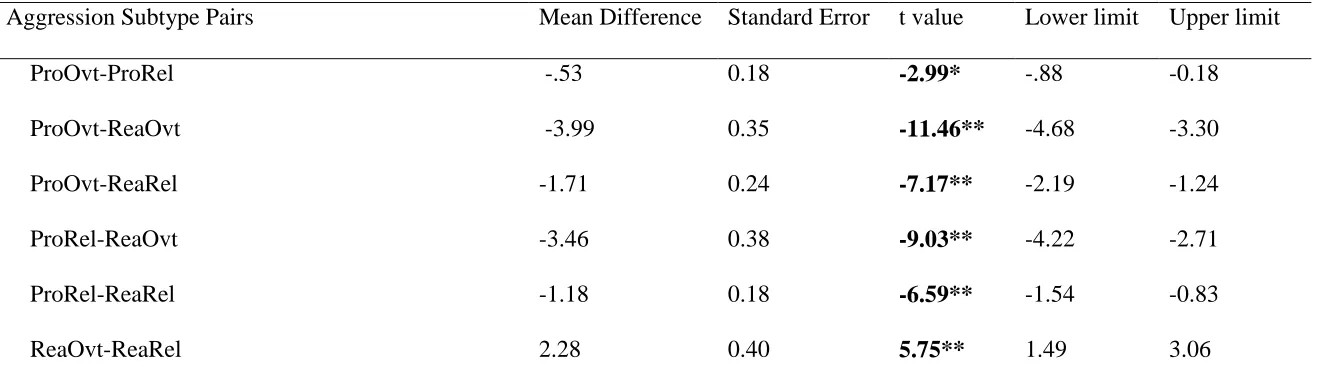
a Bonferroni correction was performed (.05/12 = .008). As can be seen in Table 2, the mean of
proactive overt aggression was significantly lower than that of proactive relational, reactive
overt, and reactive relational aggression. In addition, reactive relational aggression was
significantly higher than proactive relational aggression and significantly lower than reactive
Table 2
Post hoc paired t-tests exploring mean differences sample levels of aggression
Aggression Subtype Pairs Mean Difference Standard Error t value Lower limit Upper limit
ProOvt-ProRel -.53 0.18 -2.99* -.88 -0.18
ProOvt-ReaOvt -3.99 0.35 -11.46** -4.68 -3.30
ProOvt-ReaRel -1.71 0.24 -7.17** -2.19 -1.24
ProRel-ReaOvt -3.46 0.38 -9.03** -4.22 -2.71
ProRel-ReaRel -1.18 0.18 -6.59** -1.54 -0.83
ReaOvt-ReaRel 2.28 0.40 5.75** 1.49 3.06
Another finding was that there was an interaction between level of CU traits and
aggression F(1.83, 292.96) = 10.13, p <.05, η2 = .007. For post-hoc analyses, the high and low
CU traits groups were compared and using paired sample t-tests aggression differences were
explored within each group. Since multiple t-tests were run a Bonferroni correction was
performed (alpha = .05/12 or .004). As can be seen in Table 3, there were significant differences
between all subtypes of aggression in the low CU trait group and high CU traits group, except
between proactive overt aggression and the proactive relational aggression in the high CU trait
group. The interaction between aggression and the high and low social intelligence variable was
found to be nonsignificant F(1.83, 292.96) = 1.16, p >.05, η2 = .06.
Table 3
Within subjects comparisons of aggressive subtypes in low and high CU trait groups
Aggression ProOvt ProRel ReaOvt ReaRel
Low CU 1.09(2.72)a 1.75(2.42)b 4.04(4.23)c 2.94(3.22)d
High CU 2.48(3.03)a 2.82(3.66)a 7.82(6.54)b 4.02(4.19)c
Note: CU = callous and unemotional; ProOvt = Proactive Overt; ProRel = Proactive Relational; ReaOvt = Reactive Overt; ReaRel = Reactive Relational.
abcd
row means with the same letter are not significantly different at alpha <.05 using Bonferroni correction.
Between subjects
In the model there was a between subjects main effect for the high and low CU trait
variable (F(1,160) = 14.07, p = .000, partial η2 = .001), but not for the high and low social
intelligence variables (F(1,160)= .082, p = .775, partial η2 = .081). In order to explore the main
effect of the high and low CU traits variable, post hoc analyses were conducted. Since multiple
t-tests were run a Bonferroni correction was performed (alpha = .05/4 or .01). Using independent
levels of proactive overt (t (141.76) = -3.05, p= .003), and reactive overt (t(113.06) = -4.24 , p<
.001) aggression than those with low levels of CU traits.
Gender differences
As mentioned previously, gender research concerning relational aggression has been
inconsistent. To explore whether or not the association between aggression, CU traits, and social
intelligence differed for girls and boys, a 2 (male and female) by 2 (high and low CU traits) by 2
(high and low SI) by 4 (four aggression subtypes) repeated measures multivariate analysis of
variance (MANOVA) was conducted to determine whether males’ and females’ level of social
intelligence and CU traits were associated with differences in their levels of aggression.
Within subjects
There was no interaction between aggression, gender, SI, and CU traits, F (1.80, 273.16)
= .643, p >.05. However, there was a significant interaction between gender and aggression,
F(1.80, 273.16) = 3.24, p < .05. In order to explore these differences, males and females were
compared and post hoc analyses using paired samples t-tests were conducted to explore which
aggressive subtypes were significantly different from one another within males and females. A
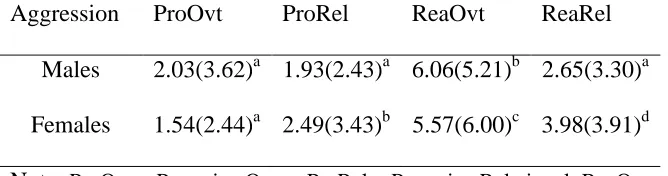
Bonferroni correction of .004 (.05/12) was used. The results of Table 4 show that for males,
reactive overt aggression was significantly higher than all the other subtypes of aggression, and
that there were no further differences among the other aggressive subtypes. When looking at
females, the results indicate that they endorsed significantly higher levels of proactive relational
aggression than proactive overt aggression. Furthermore, their levels of reactive overt
aggression are significantly higher than proactive overt, reactive relational, and proactive
relational aggression. Also, females had significantly higher levels of reactive relational
Table 4
Within subjects comparisons of aggressive subtypes in gender groups
Aggression ProOvt ProRel ReaOvt ReaRel
Males 2.03(3.62)a 1.93(2.43)a 6.06(5.21)b 2.65(3.30)a
Females 1.54(2.44)a 2.49(3.43)b 5.57(6.00)c 3.98(3.91)d
Note: ProOvt = Proactive Overt; ProRel = Proactive Relational; ReaOvt = Reactive Overt; ReaRel = Reactive Relational.
abcd
row means with the same letter are not significantly different at alpha <.05 using Bonferroni correction.
Between subjects
When gender was the only independent variable looked at the results indicated that there
were no significant differences in the amount of aggression between the aggression subtypes
F(1,152) = 2.38, p >.05. Between subjects there was a significant interaction between gender and
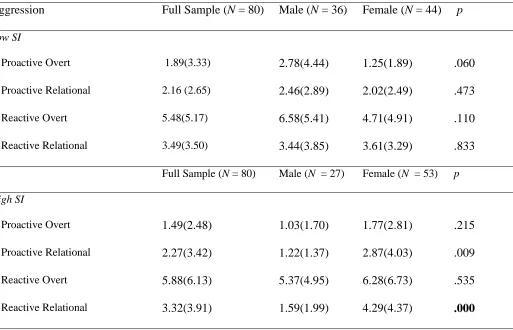
SI, F(1,152) = 8.68, p <.05. The groups were split by high and low SI and independent samples
t-tests were conducted to see where males and females differed in aggression. A Bonferroni
correction of .006 (.05/8) was used to determine significance. The only significant difference
between males and females was in the high social intelligence group for reactive relational
aggression. Table 5 shows that in the high social intelligence group, females scored significantly
higher than males on the reactive relational aggression subscale. There was also a significant
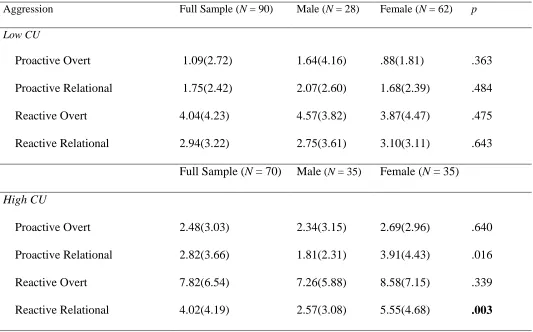
interaction between gender and CU traits, F(1,152) = 5.18, p < .05. The groups were split by
high and low CU traits and independent samples t-tests were conducted to see where males and
females differed in aggression. According to Table 6, the only significant difference found was
that in the high CU traits group, females were significantly higher than males in reactive