University of New Orleans University of New Orleans
ScholarWorks@UNO
ScholarWorks@UNO
University of New Orleans Theses and
Dissertations Dissertations and Theses
8-8-2007
Essays on Real Estate Investment Trusts
Essays on Real Estate Investment Trusts
Yunqing Wang
University of New Orleans
Follow this and additional works at: https://scholarworks.uno.edu/td
Recommended Citation Recommended Citation
Wang, Yunqing, "Essays on Real Estate Investment Trusts" (2007). University of New Orleans Theses and Dissertations. 589.
https://scholarworks.uno.edu/td/589
This Dissertation is protected by copyright and/or related rights. It has been brought to you by ScholarWorks@UNO with permission from the rights-holder(s). You are free to use this Dissertation in any way that is permitted by the copyright and related rights legislation that applies to your use. For other uses you need to obtain permission from the rights-holder(s) directly, unless additional rights are indicated by a Creative Commons license in the record and/ or on the work itself.
Essays on Real Estate Investment Trusts
A Dissertation
Submitted to the Graduate Faculty of the University of New Orleans In partial fulfillment of the Requirements for the degree of
Doctor of Philosophy in
Financial Economics
By
Yunqing Wang
B.A. Capital University of Economics and Business, 1996 M.S. South Dakota State University, 2001
M.S. University of New Orleans, 2004
Dedication
This dissertation is dedicated to my most wonderful husband, Steve
and to
Acknowledgements
First of all, I would like to thank my parents and sister for their unconditional love and
support.
Next, I must express my deep appreciation to my dissertation co-chairs, Dr. Atsuyuki
Naka and Dr. Peihwang Philip Wei, for their knowledge and invaluable guidance. I would also
like to thank my committee members, Dr. Oscar Varela, Dr. Ivan Miestchovich, Jr., and Dr.
Michael D. S. Morris for their comments and suggestions. My appreciation also goes to the
faculty in Department of Economics and Finance at the University of New Orleans for making
me more knowledgeable in the field of financial economics. I am also truly thankful to Mr.
Russell Holliday for his help with all the paper work.
Last but absolutely not least, I wish to thank to my husband, Steve. Without him, I could
not imagine completing the program. Whenever I doubted myself, he turned the frustration into
encouragement and pushed me forward.
Table of Contents
List of Tables ... vi
List of Figures ... vii
Abstract... viii
Introduction... 1
Chapter One ... 2
Downside Risk of Real Estate Investment Trusts and Real Estate Mutual Funds... 2
I. Introduction ... 2
II. Literature Review... 6
2.1 Asymmetric Risk in General... 6
2.2 REITs and Asymmetric Risk ... 13
2.3 Performance of Real Estate Mutual Fund... 17
III. Methodology... 19
3.1 Asymmetric Response Model ... 19
3.2 Coskewness... 21
3.3 Leland’s Beta ... 23
3.4 Evaluation of REMFs’ Performance... 24
IV. Data... 24
V. Empirical Results ... 32
5.1 Empirical Results of REITs ... 32
5.1.1 Downside Risk... 32
5.1.2 Robustness Checks... 37
5.2 Empirical Results of REMFs ... 50
VI. Conclusions... 53
References... 54
Appendix A... 59
Chapter Two... 63
A First Look at the Liquidity of Asian REITs ... 63
I. Introduction ... 63
II. Background Information of Asian REITs ... 66
III. Literature Review... 68
IV. Methodology and Data ... 71
4.1 Liquidity Measures ... 71
4.1.1 Spread-Related Measures... 71
4.1.2 Trading Frequency... 73
4.1.3 Price Impact ... 74
4.2 Factors Affecting Liquidity... 76
4.3 Data ... 79
V. Empirical Results ... 82
5.1 Liquidity of JREITs ... 83
5.1.2 Correlation Analysis ... 86
5.1.3 Liquidity Comparison between JREITs and Japanese non-REIT Stocks... 87
5.2 Liquidity of SREITs... 88
5.3 Liquidity Comparison between JREITs/SREITs and US REITs... 91
5.4 Analysis of Factors Affecting Spread... 93
5.4.1 Factors Affecting the Spread of JREITs ... 93
5.4.2 Factors Affecting the Spread of SREITs ... 99
VI. Conclusions... 101
References... 103
Appendix B ... 106
List of Tables
Table 1.1 ...26
Table 1.2 ...27
Table 1.3 ...31
Table 1.4 ...33
Table 1.5 ...35
Table 1.6 ...38
Table 1.7 ...40
Table 1.8 ...41
Table 1.9 ...42
Table 1.10 ...43
Table 1.11 ...45
Table 1.12 ...46
Table 1.13 ...48
Table 1.14 ...50
Table 1.15 ...51
Table 1.16 ...52
Table A.1...59
Table A.2...60
Table A.3...61
Table A.4...62
Table 2.1 ...81
Table 2.2 ...85
Table 2.3 ...86
Table 2.4 ...89
Table 2.5 ...89
Table 2.6 ...91
Table 2.7 ...92
Table 2.8 ...94
Table 2.9 ...96
Table 2.10 ...100
Table 2.11 ...101
Table B.1 ...106
Table B.2 ...107
List of Figures
Abstract
The first essay of this dissertation investigates the relationship between downside risk and
returns of real estate investment trusts (REITs) and assesses the performance of real estate
mutual funds (REMFs). We measure the asymmetric risk through downside and upside betas and
through the measures incorporated higher moments such as coskewness and Leland’s beta. We
do not find significant contemporary relationship between the asymmetric risk and returns of
REITs. There are only a small portion of REITs reacting to up and down market conditions
differently. We find weak evidence that this asymmetric movement of REITs to market may be
due to small and value components embedded in REITs. We evaluate the performance of real
estate mutual funds (REMFs) from the asymmetric risk perception. According to our results,
most of REMFs do not outperform the market. The downside risk helps to explain some of the
abnormal returns associated with REMFs. However, the evaluation may be sensitive to the
choices of the model and the market index being used.
The second essay examines the liquidity of Asian REITs. We use various measures to
assess the liquidity of JREITs and SREITs. The overall evidence indicates that the liquidity of
JREITs is greater than that of SREITs. Comparing to non-REIT stocks, JREITs are less liquid
than Japanese common stocks while there is no significant difference in liquidity between
SREITs and Singaporean common stocks. There is also strong evidence that US REITs have
smaller spreads and are traded more often than both JREITs and SREITs. We also find that the
primary determinants of JREIT spreads are turnover and return volatility. The secondary factors
SREITs’ spreads are price, return volatility, and life. The significance of life suggests that there
is a learning effect existed in both JREIT and SREIT markets in 2005.
Introduction
This dissertation intends to provide a better understanding of real estate investment trusts
(REITs). REITs provide investors a unique opportunity to invest in real estate while enjoying
liquidity through trading in public exchanges. The first chapter focuses on the US REIT market.
US REITs have developed substantially over the past few decades. This paper is motivated by
the findings of the asymmetric return distribution of small-capitalization stocks and real estate.
Since REITs are often considered as small-capitalization stocks with underlying assets of real
estate, REIT returns are more likely to be non-normally distributed. Therefore, in order to better
understanding the performance of REITs, it is necessary to explore the relationship between
asymmetric risk and REITs returns. This paper examines 335 REITs traded on NYSE, AMEX,
and NASDAQ over the time period of 1965 to 2005. The sample includes both survived and
non-survived REITs. Various asymmetric risk measures are estimated such as downside and
upside betas, coskewness, and Leland’s beta.
Chapter two extends the study of REITs to the Asian market. The Asian REIT markets
have grown steadily since 2001. Despite relatively high dividend yields, the ultimate success of
Asian REITs might depend on the improvement of market liquidity. The paper examines the
liquidity of Japanese REITs (JREITs) and Singaporean REITs (SREITs) – these two countries
represent the most established REIT markets in Asia. We obtain the complete data set of JREITs
for the years 2005 and 2006 and SREITs for the year 2005. We estimate the liquidity in terms of
bid-ask spreads, trading frequency, and price impact. Factors affecting the spread of JREITs and
Chapter One
Downside Risk of Real Estate Investment Trusts and Real Estate Mutual Funds
I. Introduction
Downside risk of asset returns has been noted in finance for a few decades. It all started
with the “safety first” rule promoted by Andrew D. Roy (1952). The risk of an investment that is
relevant to investors is the possibility that actual returns are below a certain required rate of
return. Particularly, a risk-averse investor would be reluctant to invest in an asset that would
have a larger decline in returns in downward market conditions than an increase in uprising
market conditions. So, if investors are more concerned with downside risk rather than upside
potential of their investments, then assets that are highly sensitive to downward market
movements will be associated with high average returns.
Under the mean-variance framework, the distribution of asset returns is assumed to be
normal. However, this assumption does not often hold realistically. Many asset returns are
proved to be not normally distributed with the presence of skewness and/or kurtosis (Fama
[1965], Badrinath and Chatterjee [1988], and Peiró [1999]). Therefore, risk measures under the
mean-variance framework are not sufficient in an asymmetric world, and consequently, the
evaluation of performance is systematically biased (Ang and Chua [1979] and Pedersen and
Rudholm-Alfvin [2003]).The asymmetry in returns is particularly significant for
small-capitalization stocks (Harvey and Siddique [2000] and Pederson and Hwang [2003]). It also has
been observed in real estate returns (Liu, Hartzell and Grissom [1992] and Cheng [2005]). Both
findings are interesting because they are closely related to the study of returns of Real Estate
As an investment vehicle aiming at providing access to real estate investment to small
investors, REITs have been through tough time in the 70s and 80s and have shown outstanding
performance for the last few years. According to the existing literature (Han and Liang [1995]
and Gyourko and Nelling [1996]), REITs’ returns have small stock component. This implies that
REITs’ returns are most likely to be asymmetric in nature. Furthermore, since the underlying
assets of REIT investments are tied to real estate, fluctuations in the real estate market would be
expected to have an impact on REIT returns. REITs have been considered as less volatile
compared to traditional stocks. Investors selecting REITs as a form of investment may expect to
do better when the market goes downward. Therefore, exploring the asymmetry in REIT returns
will help us better understand the performance of REITs.
The main purposes of this paper are twofold. First, we explore the relationship between
downside risk and the returns of REITs. REITs have stepped into a new era after the 1993 boom.
Market capitalization of REITs has increased substantially since then, and it is about 335.8
billion U.S. dollars by the end of 2005 (National Association of Real Estate Investment Trusts
[NAREIT] Chart Book January 2006). Institutional investors are also able to participate in this
expanded market, and have raised the portion of REIT holding in their investment portfolios.
Existing studies do show that there is an asymmetric relationship between REITs and the general
stock market on an aggregate level (Chatrath, Liang and McIntosh [2000] and Chiang, Lee and
Wisen [2004]). They document that REIT returns are more closely related to the declining
markets than with the uprising market. Our study is different from theirs since we focus on the
asymmetry of individual REIT returns.
Even though there are a few studies examining the behavior of individual REIT returns in
(2003) and Sagalyn (1990) examine only 16 and 20 survived REITs, respectively. Survivorship
bias may cause their results of downside risk to be underestimated. Our sample is obtained from
the Center for Research in Security Prices (CRSP), which is a database that is free of
survivorship bias. And we conduct our research on all REITs rather than just equity REITs
(EREITs) like Conover, Friday and Howton (2000) and Vines, Hsieh and Hatern (1994).
Additionally, previous studies may no longer be adequate for truly understanding the behavior of
REIT returns since REITs have been through a well-documented structure change (Ziering,
Liang, and McIntosh [1999] and Clayton and MacKinnon [2001]). Our sample period fully
encompasses the sample periods of earlier studies and extends by roughly a decade.
Second, we assess the performance of real estate mutual funds (REMFs) from the
asymmetric risk perception. To our knowledge, there are no similar studies conducted before in
this particular type of investments. As a restricted class of mutual funds, REMFs are open-end
funds that invest in real estate-related securities, especially in equity REITs. In spite of the
advantages of REITs such as no double taxation on income to investors, the existence of REMFs
is much needed. As we all know that diversification is a very important issue of investments in
any risky assets, and there is no exception for investments in REITs. REMFs have been
considered to provide diversification benefits to investors since many REITs specialize in a
particular type of properties. According to NAREIT, only 17 out of 198 REITs hold diversified
assets in 2005, which is roughly 8.6 percent of total number of REITs. And the market
capitalization of these diversified REITs accounts for even less percentage (7.7 percent) of total
REIT market capitalization at the end of 2005. Thus, REMFs play a crucial role of providing
Recent research regarding the performance of this sector has produced conflicting results
– some believe that REMFs have positive abnormal returns (Gallo, Lockwood, and Rutherford
[2000]) and Kallberg, Liu, and Trzcinka [2000]), while others show that abnormal returns do not
exist (O’Neal and Page [2000] and Lin and Yung [2004]). All previous studies assess the issue
from the symmetric risk perspective. However, negative skewness in mutual fund returns has
been observed since Simonson (1972). Further, Leland (1999) points out that since skewness is
priced by the market, the abnormal returns obtained through the mean-variance framework do
not necessarily imply that mutual funds outperform the market. Therefore, it is important to take
into account of asymmetric risk when evaluating REMF performance.
Specifically, we examine the monthly returns of all REITs listed on NYSE, AMSE, and
NASDAQ over the sample period of June 1965 to December 2005, and monthly returns of
REMFs during the time period of March 1984 to February 2004 from Morningstar Principia
2004 CD. In order to fully understand the relationship between downside risk and returns of real
estate related assets, we explore the issue using different methods. Upside betas and downside
betas are calculated under the lower partial moment framework. It is expected that downside
betas are associated with higher contemporary returns and upside betas are accompanies with
lower contemporary returns. We also examine the downside risk using higher-order moments.
There are two measures of higher-order moments employed in our study: co-skewness and
Leland’s (1999) beta. Finally, we apply the asymmetric response model to evaluate the
performance of REMFs. Jensen’s alpha is used to analyze whether REMFs have superior
performance.
The rest of paper is organized as follows. Section II reviews the existing studies
particular. Research on the performance of REMFs is also discussed here. Section III elaborates
the methodology applied in this paper. Section IV discusses our sample of data in detail. Section
V presents the empirical results of REITs and REMFs. The conclusions are drawn in the last
section.
II. Literature Review
There have been substantial studies on asymmetric risk over the last few decades.
Scholars explore the issue from different angles and develop various methods to measure the
asymmetric risk, namely semi-variance, lower partial moment, skewness, and asymmetric
correlation. We review the literature related to each of these measures and the corresponding
asset pricing models if available in the first subsection, followed by the review of studies on the
relation between the asymmetric risk and REITs. Literature on performance of REMFs is
reviewed at last.
2.1 Asymmetric Risk in General
Since Roy (1952) originates the safety-first rule, academia of finance and economics
have realized that investors are concerned differently on downside losses than on upside gains.
For investment decisions, there is a minimum rate of return that is required in order to
accomplish certain established goals. Thus, the risk to investors is the possibility that returns fall
below this minimum rate. All the returns above this rate are attractive to investors. Accordingly,
the uncertainty of returns above the minimum rate is not risk. Theoretically, standard deviation
encapsulates the risk associated with achieving the mean of returns, which punishes the
Accepting the idea of the safety-first rules, Markowitz(1959) specifies that investors are
interested in reducing the risk of downside losses for two reasons: (1) only downside risk is
related to an investor and (2) the returns of securities may not be normally distributed. He
suggests using semivariance as a measure of risk, rather than variance, since semivariance
measures downside risk rather than upside potential. A semivariance may be calculated from
returns that are below the mean return, or it may be calculated from returns that are below a
target return. Based on the mean-semivariance portfolio theory, Hogan and Warren (1974)
developed a semivariance capital market model. In this model, the market beta is the ratio of the
co-semivariance of market returns and an asset return that are both below the risk-free rate and
the semivariance of market returns below the risk-free rate. However, under the assumption of
bivariate normal distribution of both the market returns and an asset return, Nantell and Price
(1979) prove theoretically that the mean-variance equilibrium pricing model is indifferent from
the mean-semivariance one.
Bawa and Lindenberg (1977) introduce a lower partial moment risk measure. It is
different from semivariance measurement in the sense that it relaxes the square (calculating the
semi-variance) to any possible non-negative values of nth moment. In other words, semivariance
measurement becomes a special case of the lower partial moment measure. Under the traditional
Capital Asset Pricing Model (CAPM), the market risk denoted as beta is assume to be constant
across periods of high and low market returns. Bawa and Lingdenberg suggest modifying the
CAPM to include downside beta in order to capture the asymmetry of risk. Applying the
two-beta model associated with constant two-betas and time-varying two-betas respectively, Kim and
Zumwalt (1979) and Chen (1982) find that investors do require the compensation for assuming
that the downside beta measuring downside risk is a more appropriate measure of portfolio risk
than the traditional single beta.
Harlow and Rao (1989) cast doubt on earlier studies that specify the target rate to equal
the risk-free interest rate. They indicate that this assumption has been imposed by technical
convenience rather than economic explanations since there is limited knowledge of how
investors set up their minimum (target) rates. They develop a generalized Mean-Lower Partial
Moment (MLPM) equilibrium valuation consistent with any pre-specified target rate of return.
They claim that various risk measures (such as variance, semivariance, probability of loss etc.)
discussed in the financial economics literature and their corresponding asset pricing models are
all special cases within this generalized MLPM framework. Based on the likelihood ratio tests,
they state that the MLPM model is superior to the CAPM. They also find that investors appear to
characterize risk as downside deviations below a target rate that is related to the mean equity
market returns and is greater than the risk-free rate.
Using the Asymmetric Response model1 introduced by Bawa, Brown, and Klein (1981)
(BBK), Pedersen and Hwang (2007) examine the explanatory power of the traditional CAPM,
lower partial moment (LPM) model, and unrestricted version of BBK model. Using U.K. stock
market data with three different firm sizes (small, medium, and large) and three different
frequencies (daily, weekly, and monthly), they find that CAPM is preferred when returns are
normally distributed, especially for monthly returns of large firms. It is not expected, however,
that for non-normally distributed returns, the CAPM is still preferred in 55-80% cases, and the
LPM model is preferred in additional 15-30% cases. Pedersen and Hwang claim that the size and
frequency play important roles in evaluating the applicability of CAPM. According to their
results, LPM model may be more suitable than CAPM for daily or weekly returns of small firms.
Ang, Chen, and Xing (2006) examine how downside risk is priced in the cross-section of
stock returns. They consider the market as a rising market if market excess returns are greater
than the average market excess return and a declining market otherwise. Using the daily data of
all NYSE ordinary common stocks over the period of July 1963 to December 2001, they
document a significant positive contemporaneous relationship between downside betas and
average stock returns, i.e. higher average returns are associated with high downside betas. A
significant inverse contemporaneous relationship is also documented between average returns
and upside betas. These two contemporaneous relationships remain significant after controlling
for size, book-to-market, and momentum effects. After additional controls beyond firm
characteristics (i.e. other risk factors such as stock volatility, coskewness, cokurtosis, and
liquidity betas), the premium associated with downside risk remains statistically significant at
around 6% annually. However, the discount associated with upside potential diminishes. These
results confirm that investors are more risk-averse on the downside risk than on upside potential.
Additionally, Ang et al. reveal that downside beta and coskewness measures different aspects of
downside risk because the positive relation between downside beta (coskewness) and returns is
robust to controlling for coskewness (downside beta).
Through examining monthly returns of the value-weighted CRSP all-share index from
1933 to 2002, Post and van Vliet (2006) find that this market portfolio proxy is mean-variance
inefficient but third-order stochastic dominance efficient relative to the well-known size, value,
and/or momentum portfolios. This mean-variance inefficiency could be caused by neglecting
high-order central moments or lower partial moments. They examine the marginal utility
function, derived from the quartic utility function that Dimmar (2002) uses to design the
non-satiation, risk aversion and/or skewness seeking. Post and van Vliet believe that lower partial
moments are more important in explaining the mean-variance inefficiency than skewness or
kurtosis. According to their results, the size, value, and/or momentum portfolios have larger
lower partial moment betas in declining markets. The mean-variance inefficiency of the market
portfolio is the result of omitting the effect of downside risk. They further find that downside risk
is time-varying.
There is also a substantial amount of financial literature that examines the downside risk
of assets through higher-order moments. Kraus and Litzenberger (1976) modify the traditional
CAPM by adding the effect of systematic skewness (i.e., coskewness) in asset pricing. They
demonstrate that under equilibrium, investors are averse to variance (the second order condition
of the utility function) but prefer positive skewness (the third order condition of the utility
function). This implies that besides the traditional market beta risk, the systematic skewness
(named, market gamma) should also be taken into account when valuing an asset. They examine
the monthly deflated returns of all stocks listed on the NYSE during the time period of January
1926 to June 1970. Using the estimate procedure similar to Fama-MacBeth (1973), the empirical
results confirm their theory, i.e. both market beta and systematic skewness are priced in asset
returns. Accordingly, they suggest that the pricing error associated with the single-factor CAPM
may be caused by neglecting the high-order moment in the asset pricing model.
Badrinath and Chatterjee (1988) examine high-order characteristics of the market index
distribution adopting Tukey’s (1977) distributions. Rather than providing point estimates of
skewness and kurtosis, they study the behavior of these high-order moments. Both
equal-weighted and value-equal-weighted CRSP indices are investigated under both daily and monthly
skewness is not constant over the entire distribution; rather the upper tail is more skewed than the
lower tail. They suggest that the skewness and the kurtosis should be considered simultaneously.
For the two value-weighted indices, two separate estimates of kurtosis in two tails are
recommended, which are indicative of the investors’ different attitudes toward upside and
downside risks. As expected, the two equal-weighted indices are more skewed than the
value-weighted ones. However, a single estimate of the kurtosis is sufficient to capture the fat-tail
effect in equal-weighted indices.
Using a two-period binomial example, Leland (1999) demonstrates that when returns of
the market portfolio are independently identically distributed, the market portfolio is
mean-variance inefficient. Thus, the CAPM beta is not a correct measure of risk since it ignores the
high-order moments of the return distribution, and in turn the assessment of portfolio
performance based on the CAPM is misleading. He develops a new beta based on Rubinstein
(1976) that takes high-order moments into accounts while its calculation requires no more
information than the calculation of the CAPM beta. Using the same sample, Leland shows that
this new beta is able to measure portfolio performance correctly, especially when options or
dynamic trading strategies are involved. Even though the difference between the CAMP beta and
the new beta is insignificant when the returns of assets (or portfolios) and the market portfolio
are jointly lognormal, the new beta is superior to the CAMP beta when the returns of assets (or
portfolios) are markedly skewed.
Harvey and Siddique (2000) introduce an asset pricing model with the incorporation of
systematic conditional coskewness, and try to find the connections between well-known factors
(such as size, book-to-market, and momentum) and coskewness. They assume that the marginal
non-increasing absolute risk aversion, which implies that investors prefer positive skewness. Thus,
assets with negative coskewness should have higher expected returns. Their data sample includes
monthly domestic stock returns from the CRSP universe over the time period of July 1963 to
December 1993. The results indicate that conditional coskewness is able to explain a significant
portion of the cross-sectional variation in asset returns beyond the Fama-French three-factor
model. Unfortunately, coskewness cannot explain the entire abnormal returns. Harvey and
Siddique provide two possible explanations. First, conditional coskewness based on past returns
may not be a perfect proxy for ex ante conditional coskewness. Second, two Fama-French factor,
SMB and HML, may capture the similar information as conditional coskewness. Furthermore,
they find that momentum trading strategies is associated with significant negative skewness.
From the asymmetric correlation aspect, Ang and Chen (2002) assess the asymmetric risk
for the returns of equity portfolios and the market return below or up a pre-determined level.
They examine daily, weekly, and monthly returns of common stocks listed on NYSE, AMEX,
and NASDAQ from July 1, 1963 to December 31, 1998, using CRSP’s value-weighted returns of
all stocks as a proxy for market returns. They observe the asymmetric correlations in declining
and rising markets in the data. They also show that changes in downside betas are mainly caused
by the changes in downside correlations relative to upside correlations. Furthermore, Ang and
Chen design an H statistic, which equals “a weighted average of the squared differences of the
exceedance correlations implied by a model and those given by data (p. 464).” They claim that
the H statistic captures a different aspect of asymmetric risk from other measures such as
skewness and coskewness, and it is inversely related to the traditional market beta from the
correlation asymmetries. The results also show that small stocks, value stocks, and recent past
losers have greater correlation asymmetries.
Ang, Chen, and Xing (2002) admit that downside correlation, a component of downside
beta, only reveals the direction of co-movement of an asset return and the market return.
However, unlike downside betas, by construction downside correlation does not suffer from the
changes in volatility of an individual stock and the overall market, which could hinder the
liability of their estimates of downside and upside betas. Therefore, Ang et al. suggest that
downside correlations may be superior to downside betas to measure the asymmetric risk, which
is confirmed by their empirical results in predicative nature.
2.2 REITs and Asymmetric Risk
There are a few studies focusing on the asymmetry of the returns of real estate assets
(including REITs). Sagalyn (1990) analyzes the quarterly returns of 20 survived REITs (i.e., 14
percent of the REIT market in terms of the number of REITs and their market capitalization)
over the sample period of the third quarter of 1973 to the fourth quarter of 1987. The sample
period includes two major recessions: the 1974-1975 recession and the 1981-1982 recession. He
defines up and down periods of the market based upon NBER’s upswing/downswing
classification and upon the higher/lower growth GNP periods. The results suggest that REITs
have higher returns in the upswing or high-growth periods and lower returns in the downswing
or low-growth periods. Furthermore, he shows the asymmetry of market betas: REITs have
higher market betas during low-growth periods than during high-growth periods. Unfortunately,
Chiang et al. (2004) do not find the similar patter of REIT betas in the more recent sample
periods (i.e., 1986 to 2001 and 1993 to 2001). They believe that the asymmetry in betas observed
Chatrath et al. (2000) examine the monthly returns of the Equity REIT (EREIT) Index
constructed by the National Association of Real Estate Investment Trusts (NAREIT) over the
sample period of 1972 to 1998. The REIT betas are found to be significantly larger when the
market is down. They determine that the asymmetry in REIT betas is not caused by dividend
yield spreads between REITs and the market or by decay in the REIT-stock market relationship.
Instead, the pattern in REIT betas is similar to that for small-capitalization stocks in general.
However, return-variance dependence, the traditional explanation of the asymmetry in
small-stock betas, fails to explain the beta pattern in REITs. However, Chiang et al. (2004) suspect that
this asymmetry in REITs’ market betas is due to misspecification of the asset pricing model.
They re-examine the monthly returns of the EREIT index from 1972 to 2001, and find that the
asymmetry of REIT-betas is no long significant when using the Fama-French three-factor model.
Glascock (1991) examines real estate performance using the monthly returns of a
portfolio of 109 real estate firms (including builders, contractors, developers, and REITs)
publicly traded in American and New York Stock Exchanges from January 1965 and December
1986.2 He introduces a dummy variable to separate bull and bear markets. The dummy variable
is set to one if the returns of the market portfolio are greater than the risk-free rate or if the
National Bureau of Economic Research (NBER) categorizes the time period as nonrecessionary.
The empirical results show that all the alphas are statistically insignificant, which implies that
real estate companies do not have superior performance to the market portfolio both in the entire
sample period and in the sub-sample period from 1977 to 1989. There is no asymmetric behavior
between bull and bear market betas when using the risk-free rate as the benchmark. However, the
bull market beta is statistically significant higher than the bear market beta when considering the
NBER’s nonrecessionary period as the bull market.
Liu, Hartzell, and Grissom (1992) explore the relationship between the systematic
skewness and asset pricing of real estate assets. They apply the Kraus-Litzenberger’s (1976)
three-moment CAPM. The data include quarterly holding period returns of five appraisal-based
commingled real estate funds (CREFs) and four common-stock portfolios for the period of the
first quarter of 1979 to the fourth quarter of 1989. Compared to the stock portfolios, CREFs have
lower returns and lower standard deviations but larger total positive excess skewness. The
empirical results reveal that skewness is price – there is a market discount associated with
systematic skewness. In general, CREFs have higher (or less negative) systematic skewness than
do stocks. The findings are consistent with their rationale that investors are willing to accept a
lower expected return on real estate assets relative to other risky assets due to the lower negative
coskewness with the market. Vines, Hsieh, and Hatem (1994) conduct the similar research on
monthly returns of transactions-based real estate, i.e., equity REITs and hybrid REITs from 1971
to 1991. Their results suggest that the traditional CAPM beta is sufficient to explain risk,
whereas coskewness does not have significant impact on REIT pricing. They point out that the
differences between their results and those of Liu et al. may be caused by differences in data
sample or by different estimation methodology applied.
Conover, Friday, and Howton (2000) investigate the relationship between risk and returns
of equity REITs over the time period of 1978 to 1995. They use the market median return as the
target rate to separate bull and bear markets. Through adding a dummy variable, they modify the
traditional CAPM into a dual-beta model. The results show that bull-market betas are
(1991). They apply the Fama-MacBeth (1973) method and find that bull-market betas are
associated with a significant premium and suffice to explain the risk of equity REITs while size,
value, and expense factors have no explanatory power. However, there is no significant
relationship between either the static CAPM betas or bear-market betas and returns. They
suggest that the explanatory power of betas on EREITs’ returns is sensitive to market conditions.
Adopting the autoregressive conditional density function model of Hansen (1994), Bond
and Patel (2003) try to investigate the distribution symmetry of listed property companies and
whether the skewness is time-varying if it does exist. They examine monthly returns of 16 UK
property companies from January 1970 to March 2000 and 16 US REITs from January 1977 to
December 2000. The rather small sample size is caused by the restricted criteria imposed by the
authors. First of all, the selected firms must be continually listed throughout the entire sample
period. Further, they delete any firms that have at lease 10 percent of monthly returns equal to
zero. Ten UK companies and 16 US REITs have significant unconditional skewness coefficients.
However, under the student’s t-distribution, less than half of the companies analyzed reject the
symmetry hypothesis. They find weak evidence (one quarter of their sample) of time-varying
skewness. Furthermore, the authors find no evidence that the skewness is related to either
economic cycles or companies’ market capitalization.
Cheng (2005) examines the relationship between various asymmetric risk measures and
real estate returns over the sample period of 1992 to the second quarter of 2002. The risk
measures include downside beta, upside beta, unconditional and conditional skewness, and
unconditional and conditional coskewness. The real estate returns investigated are the quarterly
returns of the National Council of Real Estate Investment Fiduciaries (NCREIF) property
the proxy for the market. Using the univariate cross-sectional OLS regression, Cheng finds that
the traditional CAPM beta has no explanatory power to the real estate returns. The downside beta
has a statistically significant and positive relationship with the returns, which implies that there is
a risk premium associated with the downside beta. On the other hand, the upside beta is
negatively related to the real estate returns but is not priced. Both skewnesses are significant risk
factors when estimating real estate returns, while coskewnesses fail to explain the variation in
real estate returns. The author further suggests that the skewness and downside beta encapsulate
the distinct aspects of downside risk regardless the property types.
2.3 Performance of Real Estate Mutual Fund
Early studies regarding mutual funds (Treynor [1965], Sharpe [1966], and Jensen [1968])
provide little evidence of superior performance persistence over time. Studies in the early 1990's,
in contrast, provide evidence of the existence of persistent superior performance [Grinblatt &
Titman (1992), Hendricks, Patel & Zeckhauser (1993), Goetzmann & Ibbotson (1994), Elton,
Gruber & Blake (1996a), and Gruber (1996)]. However, more recent studies put some doubts
over the persistence results. First, survivorship bias in the mutual fund samples may induce
upward bias on fund performance and give rise to the appearance of persistent superior returns.
This arises because the non-surviving funds tend to be those with poor performance [Elton,
Gruber and Blake (1996a), Carhart, Carpenter, Lynch, and Musto (2002)]. As a result, the
high-performing funds tend to be over-represented in the sample. Second, Carhart (1997) found that
the “hot hand” result is mostly driven by the one-year momentum in stock returns, which should
not be considered as a superior portion of performance. After he controls the momentum factor,
evidence of persistently superior performance vanished. However, he finds positive persistence
Despite the extensive academic literature on mutual fund performance, limited studies
have been done on the performance of REMFs. Gallo, Lockwood, and Rutherford (2000) appear
to be the first group to examine the performance of REMFs. They select 24 domestic real estate
funds with at least 15 months continuous returns available over the sample period of 1991 to
1997. Using the Wilshire Real Estate Securities Index as a proxy for the market, they find that
real estate funds outperform the market both at the individual level and the aggregate level (i.e.
the portfolio of funds selected and the portfolio of Morningstar real estate funds combined).
They adopt Sharpe’s (1992) effective-mix test to identify the sources of this superior
performance. They rule out asset allocation to bond, non-real-estate stocks, and
small-capitalization REITs as possible explanations for the superior performance. Instead, their results
show that “real estate funds displayed superior asset allocation by overweighting outperforming
property types and underweighting underperforming property types.” (p. 169)
Kallberg, Liu, and Trzcinka (2000) examine 44 REMFs that are exclusively invested in
128 REITs over the period of 1987 to 1998. Their empirical results show that the average and
median alphas are positive and significant using the standard benchmarks from previous mutual
fund studies. However, this superior performance is lacking in persistence. The authors argue
that most of positive alphas occur during the early 1990s – a period when real estate returns were
generally low. This strongly suggests that positive performance in these funds occurs primarily
in down markets. This can at least partially explain the lack of persistence in their results. The
authors also believe that lack of persistence is due to conditions in the credit market. In
particular, during the early 1990s, banks reduced their lending to corporations in general, and to
real estate firms especially. Furthermore, the authors indicate that larger funds and more active
O’Neal and Page (2000) examine 28 REMFs during the period from 1996 to 1998. Using
a multiple-index model, their empirical results show that the overall alphas for the entire market
are positive but insignificant. For each individual fund, 14 funds have positive alphas and 14
funds have negative alphas. However, only two out of each group are significant at 5% level.
These results suggest that most funds are not achieving abnormal performance.
Lin and Yung (2004) examine 83 REMFs over the period of 1993 to 2001. They find that
nearly all alphas are negative regardless of the choice of evaluation models. They suggest that
REMFs do not outperform the market no matter whether the benchmark is the entire stock
market portfolio or the real estate sector market portfolio. They also indicate that the
performance of the entire real estate sector, to a large extent, determines the performance of
REMFs. The empirical results also present evidence that past performance of REMFs affects
future performance. They indicate that the performance persistence does exist for REMFs in the
short term. Finally, they state that risk-adjusted real estate fund returns are related to fund size.
III. Methodology
In this section, we discuss various measures of asymmetry used in this paper. The first two
measures, downside/upside betas and coskewness, have been used extensively in the existing
literature including studies conducted on REITs. The third measure, Leland’s (1999), is the first
time used in examining returns of REITs and REMFs.
3.1 Asymmetric Response Model
We apply the asymmetric response model (ARM)3 to estimate the downside and upside
betas. The unrestricted version of this model is as follows:
(t) ε δ(t) π (t) R β (t) R β α (t)
Ri = i+ − m− + + m+ + i + i
i
i (1)
where Ri(t) is the excess return over the risk-free rate on each REIT i in the sample;
τ(t) (t) R (t)
Rm− = m − , when R (t) τ(t)
m < and zero otherwise; Rm(t)=Rm(t)−τ(t)
+ , when
τ(t) (t)
Rm > and zero otherwise; Rm(t) represents the market excess return over the risk-free
rate and τ(t) is the target rate that separate the up and down markets; δ(t) is dummy variable set
1 when Rm(t)>Rf(t) and zero otherwise; εi(t) represents an error term.
This model divides the market returns into to two separate groups – above and below the
target rate in order to capture the downside response of asset returns. It seizes the asymmetry in
excess market return via the separation of β−i and
+
i
β , which represent the downside risk and
upside potential, respectively. These measures are different from other asymmetric measures
such as higher-order moments. Ang, Chen and Xing (2002) state that “downside and upside betas
capture the notion of asymmetric exposures to risk across periods when the market falls and
periods when the market rises. These moments are different from centered moments because
they emphasize the asymmetry across upside market moves and downside market moves
explicitly by the conditioning level (p. 5).” Neither skewness nor kurtosis has the ability to
distinguish the risk in downward and upward markets.
Another advantage of this model is that it can be transformed to other asset pricing
models by simply imposing certain restrictions. For example, without distinguishing
(t)
Rm− andR (t)
m
+ , −
i
β and +
i
β would be equal to the market beta β, and equation (1) reduces to
the traditional CAPM. By letting π= 0, equation (1) transform into a model that has been used to
examine the bull- and bear- market betas (Kim and Zumwalt [1979], Chatrath et al. [2000], etc.).
Additionally, Pedersen and Satchell (2000) point out that this model allows us to study the return
asymmetry free of any distributional assumptions such as skewness and kurtosis.
Using the asymmetric response model, we test the null hypothesis of −
i
β = +
i
β . If the
results fail to reject the null hypothesis, then there is no asymmetric relationship between REITs
and the overall market. This implies that the CAPM under the mean-variance framework is
sufficient to capture the market risk. The asymmetric response model is not appropriate. If the
results reject the null hypothesis, this means that β ≠−i
+
i
β , it is evidence of the existence of the
asymmetry in the REIT-market relationship. Accordingly, the asymmetric response model is
more appropriate than the CAPM.
The question comes to which target rate we should use to divide the market into the
uprising and declining markets. There have been numerous ways appeared in the previous
literature, such as the risk-free rate, the mean of market returns, the median of market returns,
etc. Nantell and Price (1979) indicate that choosing the mean return of the market portfolio as the
target rate is meaningless, especially under the normal distribution assumption. One of the most
common choices is the risk-free rate. In our empirical work, we choose to use one-month
Treasury-Bill rate as the target rate to separate the up and down markets. In a series of robustness
checks in section 5, we also investigate the asymmetric relationship using the mean of the market
excess returns as the target rate and using the National Bureau of Economic Research’s (NBER)
business cycle expansion and contraction periods to split the market.
3.2 Coskewness
Based on the review conducted in section 2, it is important to incorporate the
higher-order moments into the investigation of the asymmetry of REIT returns. Majority of studies on
moment that measures the degree of asymmetry in the variable distribution. If a distribution is
positively skewed, it is skewed to the right that has a long tail on the right side of the
distribution. This generally implies that its mean is greater than its median. On the contrary, if a
distribution is negatively skewed, it is skewed to the left that has a long tail on the left side of the
distribution. This generally implies that its means is less than its median.
Investors prefer positive skewness. In finance, positive skewness refers to an investment
having a higher potential of a large gain and a lower potential of a large loss than one with the
normal distribution. The uncertainty associated with an asset with a positively skewed
distribution is largely related to the dispersion above the mean, which is not necessary risky to
investors. Through analyzing an investor’s utility function, Scott and Horvath (1980) assert that
investors with “positive marginal utility of wealth for all wealth levels, consistent risk aversion at
all wealth level” prefer positive skewness and dislike negative skewness.
However, skewness, like variance, could be diversified away. Simkowitz and Beedles
(1978) demonstrate that skewness of a portfolio can be diversified away fast with a small number
(five) of assets adding into the portfolio. Therefore, only systematic skewness (i.e., coskewness)
is relevant to an investor. A positive coskewness implies that an asset adds positive skewness to
a portfolio. Thus, it should be associated with a lower expected return since investors prefer
positive skewness. In contrast, a negative coskewness should be related to a higher expected
return since the asset reduces the portfolio’s skewness. The coskewness is defined as
) var(R ) var(R ] ) µ )(R µ E[(R coskew m i 2 m m i
i− −
= (2)
where µiis the mean of the excess return of REIT i, µmis the mean of the market excess return,
)
excess returns. Kraus and Litzenberger (1976), Harvey and Siddique (2000), and Ang, Chen, and
Xing (2006) find that lower coskewness is associated with higher expected returns.
Furthermore, Ang, Chen, and Xing uncover the fact that downside beta risk differs from
coskewness risk. Downside betas are explicitly conditioned on market downward movement,
which provides us a measure of risk when the market is in distress. On the other hand,
coskewness is estimated based on the return distribution of an individual asset and the overall
market. It does not distinguish up and down market conditions. So, downside betas and
coskewness may capture the different aspects of the asymmetric risk associated with an asset.
Thus, examining coskewness of REIT returns is necessary.
3.3 Leland’s Beta
Leland (1999) develops a risk measure based on Rubinstein (1976), which takes into
account of the effect of order moments such as skewness, kurtosis, and other
higher-moments of the return distribution. Leland’s beta is defined as
] ) r (1 , cov[r ] ) r (1 , cov[r β b m m b m i − − + − + − =
L (3)
where ri is the return of REIT i and r is the market return. b represents the preference m
parameter, and is defined as
)] r var[ln(1 ) r ln(1 )] r E[ln(1 b m f m + + − +
= (4)
Leland indicates that the traditional CAPM is not able to accurately assess performance of a
portfolio because it ignores the effect of higher-moments. He claims that the modified beta is
To investigate the asymmetry in REIT returns, our empirical work comprises the following
procedures. First, we present the descriptive statistics for our data. The return distribution of each
REIT in our sample is tested for normality. These statistics and tests show that non-normally
distribution in REIT returns is significant enough that provides an adequate rationale for
investigating the asymmetry in REIT returns. Second, we estimate the above three asymmetric
measures for each REIT using time series data. We test whether the relationship between REITs
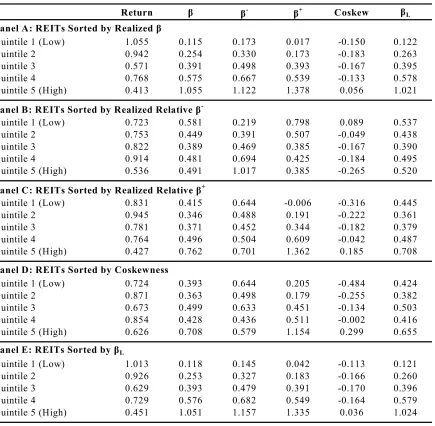
and the market is different during up and down market conditions. Third, we sort our sample into
quintiles based on each estimated risk measure respectively. After controlling the risk factor, we
identify any possible relationship between REIT returns and these measures.
3.4 Evaluation of REMFs’ Performance
In order to evaluate the performance of REMFs, we employ the asymmetric response
model. The null hypothesis to be tested is that Jensen’s alphas is equal to zero, which mean that
REMFs do not produce abnormal returns. If the null hypothesis is rejected, it suggests that
managers do add value to REMFs. Since the real estate markets in general are considered to be
inefficient since their own characteristics prevent instantaneous price adjustment to new
information. Obtaining timely information in real estate markets is costly because of the
decentralized nature of transactions. Thus, investment professionals with valuable private
information are likely to have a chance to beat the market.
IV. Data
This paper examines monthly returns of REITs that are publicly traded on NYSE,
AMEX, and NASDAQ. The data are collected from CRSP over the sample period of June 1965
mortgage, and hybrid. In particular, they are identified as securities with the following share
codes under the CRSP’s definitions: 18 and 48, and with the primary four-digit SIC code of
6798.4 The sample is free of survivorship bias since CRSP makes the data of not-survived
companies available. In order to obtain the reliable estimates of the asymmetric measures,
especially for the downside and upside betas, we require that REITs in the sample must have at
least 60-month consecutive returns. We also delete any REITs that have more than 12 month
missing returns. After the selection process, our sample has total 335 REITs, including 168
survived REITs that were traded as of December 2005 and 167 not-survived REITs that were
delisted from the CRSP database sometime before the end of 2005. In our empirical work, we
concentrate on presenting the results of the full sample. We examine survived REITs separately
in robustness checks.
Table 1.1 presents descriptive statistics of our REIT sample, including mean and standard
deviation of monthly excess returns and market capitalization. From June 1965 to December
2005, the shortest time series of a particular REIT is 62 months, and the longest is 487 months.
The average monthly excess return over the risk-free rate for the entire sample is 0.75%, with the
minimum monthly excess return equals -3.57% and the maximum is 3.35%. This tells us that the
average annual excess return of REITs is about 9%, which is higher than the average annual
excess return of common stocks (8.12%) in Ang et al. (2006). The standard deviation of monthly
excess return is 9.41%. The average market capitalization of our sample is $469 million. The
smallest REIT is about $3 million while the largest REIT is about $9,550 million. We further
divide our sample into five quintiles based upon the mean market capitalization of each REIT.
Each quintile has 67 REITs, and the first quintile has the smallest REITs in our sample. We
observe that the larger REITs in our sample provide higher average returns than the smaller ones.
On the other hand, the standard deviations have a generally monotonically decreasing pattern:
the smallest quintile has the highest standard deviation, and the largest quintile has the lowest.
The similar pattern is spotted by Chen, Ho, Lu, and Wu (2005). They observe that in the lowest
book-to-market ratio category the mean monthly returns increase as the sizes of REITs increase
while the standard deviations of returns decrease.
Table 1.1 Descriptive Statistics for REITs
This table presents descriptive statistics of our REIT sample. The overall statistics are the averages of 335 REITs, and the statistics for each quintile are the averages of 67 REITs. Mean is the time-series and cross-sectional average monthly excess return, recoded in %. Capitalization is the time-series and cross-sectional average market
capitalization, expressed in million dollars.
Periods Mean Std Dev. Capitalization
Overall Mean 165 0.75 9.41 469.24
Min 62 -3.57 2.89 3.03
Max 487 3.35 35.30 9549.60
Quintile 1 (smallest) Mean 168 0.30 13.88 16.42
Min 63 -3.26 4.11 3.03
Max 487 3.35 35.30 32.21
Quintile 2 Mean 144 0.73 9.71 51.10
Min 62 -1.35 4.34 32.40
Max 391 2.51 27.16 80.86
Quintile 3 Mean 184 0.56 8.27 162.67
Min 65 -3.57 2.89 81.58
Max 470 1.72 18.40 270.80
Quintile 4 Mean 156 1.06 7.58 476.84
Min 65 -0.07 4.23 272.02
Max 423 3.29 19.14 755.57
Quintile 5 (largest) Mean 171 1.10 7.63 1639.14
Min 85 -0.28 4.41 767.07
Max 487 2.26 29.55 9549.60
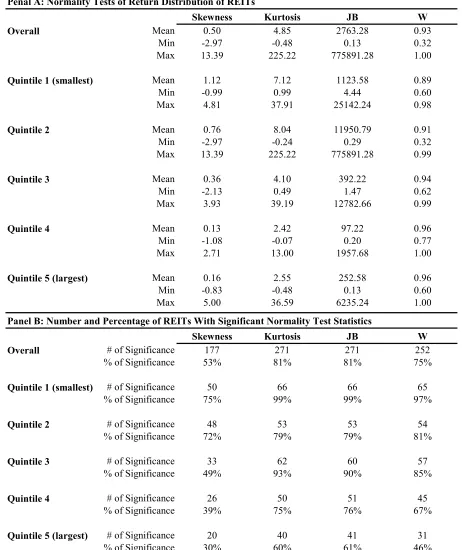
Table 1.2 reports skewness, kurtosis, Jarque-Bara statistics and the results of the
Table 1.2 Skewness, Kurtosis, and Normality Tests
Skewness is the third standardized moment and kurtosis is the fourth standardized moment. JB is the Jarque-Bera test statistic and the W is the Shapiro-Wilk test statistic.
Penal A: Normality Tests of Return Distribution of REITs
Skewness Kurtosis JB W
Overall Mean 0.50 4.85 2763.28 0.93
Min -2.97 -0.48 0.13 0.32
Max 13.39 225.22 775891.28 1.00
Quintile 1 (smallest) Mean 1.12 7.12 1123.58 0.89
Min -0.99 0.99 4.44 0.60
Max 4.81 37.91 25142.24 0.98
Quintile 2 Mean 0.76 8.04 11950.79 0.91
Min -2.97 -0.24 0.29 0.32
Max 13.39 225.22 775891.28 0.99
Quintile 3 Mean 0.36 4.10 392.22 0.94
Min -2.13 0.49 1.47 0.62
Max 3.93 39.19 12782.66 0.99
Quintile 4 Mean 0.13 2.42 97.22 0.96
Min -1.08 -0.07 0.20 0.77
Max 2.71 13.00 1957.68 1.00
Quintile 5 (largest) Mean 0.16 2.55 252.58 0.96
Min -0.83 -0.48 0.13 0.60
Max 5.00 36.59 6235.24 1.00
Panel B: Number and Percentage of REITs With Significant Normality Test Statistics
Skewness Kurtosis JB W
Overall # of Significance 177 271 271 252
% of Significance 53% 81% 81% 75%
Quintile 1 (smallest) # of Significance 50 66 66 65
% of Significance 75% 99% 99% 97%
Quintile 2 # of Significance 48 53 53 54
% of Significance 72% 79% 79% 81%
Quintile 3 # of Significance 33 62 60 57
% of Significance 49% 93% 90% 85%
Quintile 4 # of Significance 26 50 51 45
% of Significance 39% 75% 76% 67%
Quintile 5 (largest) # of Significance 20 40 41 31
Skewness is the third standardized moment and defined by
3 3
i ) ]
E[(R Skewness i i σ µ −
= (5)
where σiis the standard deviation of REIT i. If skewness is greater than zero, the distribution is
positively skewed (i.e., skewed to the right). If skewness is less than zero, the distribution is
negatively skewed (i.e., skewed to the left). Panel A shows that our overall sample has the
smallest skewness of -2.97 and the largest skewness of 13.39. We observe that in general the
average skewness in the first quintile is the largest, and it decreases as the size of REITs
increases. Panel B shows that there are 177 out of 335 (or 53%) REITs with significant
skewness. Breaking down to different size groups, the smallest quintile has the highest percent
(75%) of REITs with significant skewness and the largest quintile has the lowest percent (30%).
The results further show that the smallest quintile has the least number of negatively skewed
returns.5 And this number keeps increasing as the size of REITs goes up and ends with the fifth
(largest-size) quintile having the highest number of negatively skewed returns. Since investors
dislike negative skewness, this may partially explain why the largest quintile has the highest
mean excess returns.
Kurtosis is the fourth standardized moment that measures the degree of peakedness of a
distribution. It is defined by
3 ] ) E[(R Kurtosis 4 4
i− −
= i i σ µ (6)
Precisely, equation (6) produces so called excess kurtosis. Here we use kurtosis and excess
kurtosis interchangeably. If kurtosis of an asset is less than zero, the distribution is less peaked
and has shorter tails compared to a normal distribution. If kurtosis is greater than zero, the
distribution has a higher peak and longer tails (i.e., leptokurtic). For any given level of means
and variances, investors prefer low kurtosis due to the less frequent occurrence of extreme
results. Over 96% of the REITs in our sample have positive kurtosis. Additionally, 271 out of
335 REITs have significant kurtosis, which is about 81%. Both quintile 1 and quintile 3 have
over 90% of REITs with significant kurtosis (mainly positive) shown in Panel B.
Skewness and kurtosis are based upon the empirical data and are more descriptive. We
further test normality of REIT return distribution with Jarque-Bera test and Shapiro-Wilk test.
The test statistic JB of Jarque-Bera is computed from skewness and kurtosis, specifically
) 4
3) (K (S 6 n JB
2
2+ −
⋅
= (7)
where n is the number of time series observations, S denotes the sample skewness as defined by
equation (5) and (K-3) denotes the sample excess kurtosis defined by equation (6). JB
asymptotically follows the χ2 distributed with two degree of freedom. The null hypothesis of
normal distribution can be rejected at α level if JB is larger than or equal to 2 2 , 1α
χ − . The
Shapiro-Wilk W statistic is constructed by considering the regression of ordered sample observations on
the corresponding expected order statistics from the normal distribution. The Shapiro-Wilk test
requires the sample size between 7 and 2000.6 Our sample has the observations between 62 and
487, which falls into the range perfectly. The value of the W statistic ranges between 0 and 1.
Being close to one indicates normality.
The results of both tests are presented in Panel A and B of Table 1.2. Both JB and W
statistics suggest that large portion of our sample has non-normal distribution: 81% according to
JB and 75% according to the W statistic. Most of the quintiles also have more than half of REITs
exhibiting non-normal distribution. Combining these statistics, the results assure us that it is
necessary to explore the asymmetry of REIT returns.
The monthly returns of REMFs are obtained on Morningstar Principia CD (February
2004 version) from March 1984 to February 2004. Even though the sample for the real estate
mutual funds suffer from survivorship bias, the magnitude of the bias is rather small since there
have been very few real estate mutual funds discontinued over the sample period. There are 200
mutual funds that are categorized as “Specialty – Real Estate” by Morningstar Inc. Among them,
minimum fifteen continuous monthly returns are required. The remaining data deal with the issue
of multiple share class funds. The share classes represent a common pool of assets but differ in
term of how distribution-related fees are paid. The distribution expenses can be paid with a
front-end load, a rear-front-end load, or a 12b-1 fee. Morningstar Inc. treats each share class as a separate
fund. Most of existing studies of mutual fund loads tend to agree that expenses of all types,
whether annual or one-time charges, are not related to mutual fund performance [Grinblatt and
Titman (1994), Elton, Gruber, Das, and Hlavka (1993), and Elton, Gruber, and Blake(1996b)].
Since the method of payment does not enhance mutual fund performance, different criteria
should not induce inconsistent results. Previous studies regarding real estate mutual funds have
chosen the sample of funds with front-end load only or funds with the largest share class
[Kallberg, Liu and Trzcinka (2000) and O’Neal and Page (2000)]. However, this paper selects
only the original share class7 for each fund [Carhart et al. (2002)]. As a result, 71 real estate
mutual funds are included in our sample.
Panel A of Table 1.3 provides descriptive statistics for REMFs’ excess returns. Our
sample has an average of 86 month observations per REMFs, with the shortest time series of 17
months and the longest time series of 240 months. The mean excess return is 0.92% per month,
which is about 0.17% higher than that of REITs. The mean standard deviation is 3.59%, which is
considerably lower than that of REITs. This higher return and lower risk combination is expected
for REMFs. As we mentioned earlier, REMFs are much more diversified than regular REITs.
Investors put money into mutual funds and expect to achieve the goal of higher return and lower
risk through professional management. As of the return distribution of REMFs, majority of them
have normal distribution. Panel B shows that only 15 Jarque-Bara statistics and 12 W statistics
out of 71 total REMFs reject the normality hypothesis.
Table 1.3 Descriptive Statistics and Normality Tests for REMFs
This table presents descriptive statistics of our REMF sample. All statistics are calculated based on 71 REMFs. Mean is the time-series and cross-sectional average monthly excess return, recoded in %. Skewness is the third standardized moment and kurtosis is the fourth standardized moment. JB is the Jarque-Bera test statistic and the W is the Shapiro-Wilk test statistic.
Panel A: Descriptive Statistics of REMFs' Excess Returns
Periods Mean Std Dev.
Mean 86 0.92 3.59
Min 17 0.26 1.32
Max 240 2.55 5.93
Penal B: Normality Tests of REMFs' Excess Returens
Skewness Kurtosis JB W
Mean -0.18 0.4 3.93 0.98
Min -1.45 -0.71 0.01 0.85
Max 0.57 2.82 41.37 1
# of Significance 7 11 15 12
We use CRSP value-weighted index that includes all the stocks traded on NYSE, AMEX,
and NASDAQ as the proxy for the market. The mean monthly return of the index over our
sample period is 0.441% with a standard deviation equal to 4.51%. The index is significantly
negatively skewed and has a significant positive kurtosis at 5% level. Both JB test and
Shapiro-Wilk test reject the null hypothesis of normal distribution for the index monthly returns. We
focus on presenting our results with CRSP value-weighted index. However, we also employ
V. Empirical Results
In this section, we present the estimations of the asymmetric risk measures discussed in
section 3. We investigate whether there are any patterns in REIT returns for quintiles sorted by
the risk measures. We also conduct robustness checks for our results. In the second part of this
section, we discuss the downside risk and REMFs. We investigate whether downside risk play a
role in examining the performance of REMFs.
5.1 Empirical Results of REITs
5.1.1 Downside Risk
For each REIT return series in our sample, we estimate the market beta (β) using the
traditional CAPM and the downside beta (β−) and the upside beta (β+) using the asymmetric
response model.
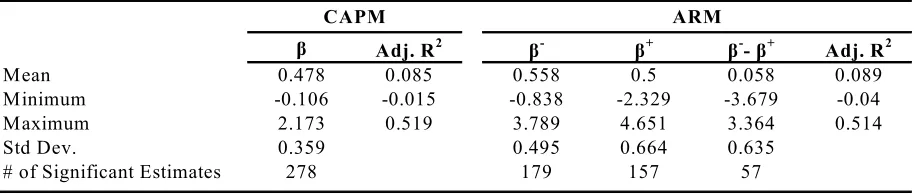
The regression results are summarized in Table 1.4. The average β of our sample is
0.438, which indicates that REITs on average are less risky than the market. There are 69% of
these estimates are statistically significant at 10% or lower level. The average β− is 0.626 and
the average β+ is 0.235. The minimum values of three β’s are all negative. This is not unique to
our sample. Ang, Chen, and Xing (2006) report the average β+ of the lowest quintile is negative
when the stocks are sorted by realized β+. Cheng (2005) reports the minimum values of both
downside beta and upside beta are negative. O’Neal and Page (2000) show some of beta
coefficients for Russell 2000 and S&P 500 are negative. In fact, Cloninger, Waller, Bendeck, and
Revere (2004) report about average 10% of NYSE and AMEX stocks have negative beta during