Strojniški vestnik - Journal of Mechanical Engineering 54(2008)10, 649-654 UDC 534.83
Paper received: 06.09.2007 Paper accepted: 07.07.2008
Simple Feedback Structure of Active Noise Control in a Duct
Jan Černetič* - Jurij Prezelj - M irko Čudina
U niversity o f Ljubljana, Faculty o f M echanical Engineering, Slovenia
A n a ctive noise co n tro l is usually co n stru cted w ith the use o f electronic filte rs. F o r su fficien t noise attenuation, electronic filte r s are not alw ays needed. In this case, the electronic controller a n d appropriate so ftw a re is n o t req u ired so the system can be m uch easier. This p a p e r deals w ith the use o f a fe e d b a c k stru ctu re o f active noise c o n tro l in an experim ental ventilation duct. Sim ulation w as p e rfo rm e d to investigate the efficiency o f a sim ple analoguous system f o r active noise control w ith o u t incorporating electronic filte rs. The transfer fu n c tio n o f the entire analogous system can be u se d to p re d ic t the m axim um attenuation level. Tests w ere m ade to verify the sim ulation a n d to show w hat noise attenuation level can be a ch ieve d in an experim ental duct. I t has been show n that in a specific fre q u e n c y range this k in d o f a system is efficient enough f o r use in som e ventilation ducts.
© 2008 Journal o f M echanical Engineering. A ll rights reserved.
Keywords: active noise control, feedback control, ANC simulation, phase shift
0 IN T R O D U C T IO N
The beginning o f active noise control (AN C) is in year 1936, w hen Lueg patented his idea about realization o f the active noise control [1]. It uses the principle o f interference and absorption. B ecause electronics in those years was not enough advanced to m eet the needs o f a controller, no real system w as produced.
T oday, tw o basic m ethods are used for active noise control; feed-back and feed-forward. They are using all capabilities o f contem porary com puters and other electronics. These systems are used m ainly in conjunction w ith adaptive filters, w hich m ake them capable to cope w ith bad system response. B ut there is a question, if it is possible (in som e cases) to use a sim pler system , w hich is efficient enough and at the sam e tim e cheaper and m ore reliable because o f less electronic com ponents. This is the purpose o f the experim ental ventilation duct that w as m ade in this research.
The characteristic o f ventilation ducts’ fans is a constant rotating speed. This m eans that the em itting noise is constant and tonal in low er frequency band. The intention o f this test is to achieve good noise attenuation w ith feedback structure o f an AN C system w ithout incorporating adaptive or other electronic filters. These filters are capable to com pensate bad system response, and at the sam e tim e, they contribute to considerable phase shift o f the original signal. This part o f phase shift can be elim inated i f the
filter is not included in the feedback loop. It should be aware o f the fact that, for exam ple, an am plifier itself also contains filters. In this research, no additional filter w as used.
1 FE E D B A C K STRU CTU RE OF ACTIVE N O ISE C O N TRO L
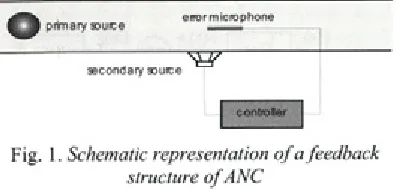
Feedback structure w as found in 1953, w hen feedback loop w as constructed o f a m icrophone, an am plifier and a loudspeaker [2], Authors have nam ed this schem e as the »sound absorber«. In this schem e, m icrophone is used as an error m icrophone, w here error m eans deviation from the theoretical attenuation. Signal is travelling through the am plifier and the controller, w here the am plitude is adjusted and phase is shifted for 180°. M odified signal goes to the loudspeaker, w here the attenuation o f noise occurs. Schem atic representation o f a feedback structure is shown in Figure 1.
©
error m icrophoneprimary source ...
- ---secondary source
controller
Fig. 1. Schem atic representation o f a fe e d b a c k structure o f A N C
Today, a feedback structure is som etim es used as a w ay to avoid acoustic feedback in feed
forw ard structure. A feedback A N C configuration is also very suitable w hen there is no available reference signal [3].
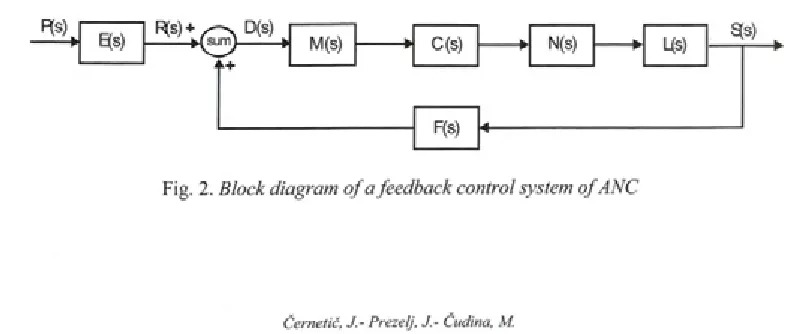
To achieve m axim um level o f attenuation, signal from the m icrophone should be am plified as m uch as possible, but should not exceed the stability range. B lock diagram , corresponding to a feedback control system in the com plex frequency s-plane, is show n in Figure 2, w here E (s) is a transfer function o f acoustic path betw een the prim ary source and the m icrophone, F (s) is a transfer function o f acoustic path betw een the secondary source and the m icrophone, M(s) a transfer function o f the m icrophone, C(s) a transfer function o f the controller, N (s) a transfer function o f the electronics (except the controller) and L (s) a transfer function o f the secondary source.
T ypical characteristics o f this m ethod is a feedback loop, w hich leads signal S(s) from the secondary source back to the m icrophone through the acoustic path. There it is added to the reference signal R (s) and the error signal D (s) is therefore increased. Signal from the error m icrophone D (s) can be w ritten as:
D ( s ) = R ( s ) + F ( s ) S ( s) (1)
or
D ( s ) = E ( s ) P ( s ) +
+ F ( s ) M ( s ) C ( s ) N ( s ) L ( s ) D ( s ) (2)
It leads to a sim plified form o f a transfer function betw een a m icrophone signal D (s) and a signal o f prim ary source P(s):
D ( s ) =_________ E ( s )_________ (3)
P ( s ) 1 - M ( s ) C ( s ) N ( s ) L ( s ) F ( s )
B ecause the error signal should be as low as possible (theoretically vanish), it is D ( s) = 0 .
Further derivation show s that for the best attenuation, the transfer function o f the controller should have an infinite am plitude. B ecause o f the stability problem , this is not possible. W hen a feedback loop is am plified too m uch, other elem ents m ay cause the system to becom e unstable. T herefore an optim um operational point should be found, w hich is norm ally near the stability limit.
2 SY ST EM STA BILITY
W hen constructing the A N C system w ith a feedback loop, the stability problem should alw ays be observed. Position o f the m icrophone and the secondary source has strong influence on stability. In theory, it is considered that both elem ents are infinitely close to each other. But this is not possible to reach because o f the follow ing reasons. First, it should be taken into account that both elem ents can not be placed close to each other because a near-field influence w ould be too high to get good accuracy. Second, dim ensions o f a loudspeaker and a m icrophone are preventing to define their optim um placem ent. For this reason, there is alw ays som e gap betw een the m icrophone and the loudspeaker, w hich affects the efficiency o f the w hole system .
I f the m icrophone and the loudspeaker w ould be so close to each other that the sound w aves around a m icrophone w ould be defined solely by the m ovem ent o f the loudspeaker, the m icrophone w ould get the sam e signal as the loudspeaker produces (no phase shift). This is not possible and the gap causes som e tim e delay in the signal, w hich results in phase shift. I f the w avelength o f the signal is significantly greater than a gap betw een the m icrophone and the loudspeaker (interm ediary length, l), phase shift is relatively small.
B ut i f the w avelength is sim ilar to the interm ediary length (this occurs at the higher frequencies), phase shift becom es relatively large and efficiency o f the system drastically decreases. If the frequency is increasing (at som e fixed interm ediary length), the phase shift is therefore also increasing, w hile the efficiency o f the system is decreasing. Besides, it should be also taken into account the property o f the real acoustical and other com ponents, that each o f them causes som e phase shift in the signal. This is m ore significant for loudspeakers and filters.
W hen (for a specific sound frequency) the interm ediary length corresponds to the equation (4) , the phase shift betw een the sound, produced by the loudspeaker, and the sound, captured by the m icrophone, is equal to 180°:
, A,
l = l (4>
This m eans that the w ork o f the controller, w hich reverses the phase for 180°, is totally ineffective and instead o f attenuation it causes am plification o f the prim ary noise.
Real noise, w hich is w anted to be attenuated, consists o f m any narrow frequency bands. T herefore, at every single interm ediary length, one narrow frequency band exists, w hich causes the noise at this frequency to be am plified, and not attenuated. W hen the am plification is increasing, the am plitude is also increasing and at the specific point it exceeds the stability limit. U nstable w orking conditions occur and the system is not w orking appropiately anym ore. The longer the interm ediary length, the low er the lim it frequency for stable operation.
M any system s o f the A N C are constructed w ith the use o f electronic adaptive filters [4] and [5] . They are able to partly com pensate non-ideal response o f each com ponent and other causes o f reduced efficiency. One o f the filter problem s is, that it causes phase shift in the signal, w hich results in low er efficiency. T herefore it is interesting to find out how these filters can be avoided.
3 M EA SU REM EN TS
The purpose o f this experim ent w as to construct an A N C system w ith a feedback loop in an experim ental ventilation duct w ithout any additional com pensation filter, and to get the
noise attenuation, w hich is good enough. The set up was constructed o f plyw ood w ith thickness o f 2 cm (Figure 3). For sim ulating a fan, the loudspeaker with generated broadband pink noise was used. N arrow band or tonal noise seem s to be a better choice for sim ulating a fan, but the experim ent was intended to exam ine the efficiency o f the system through the w ider frequency spectrum.
/R kL1 ____
* m M1
Fig. 3. E xperim ental ventilation d u ct schem e
A feedback loop, used for generating anti noise, w as constructed o f a m icrophone B ruel& K jaer (BK) 4165 (M 2 in Fig.3), a m easuring am plifier B K 2636 and a loudspeaker V isaton W 170S8 w ith reversed polarity (L2 in Fig. 3). For prim ary noise generation (pink noise) the follow ing equipm ent w as used: a sine random generator BK 1027, a pow er am plifier B K 2706 and a loudspeaker JV C CS-HX621 (L I in Figure 3).
3.1. Frequency Response of a Loudspeaker
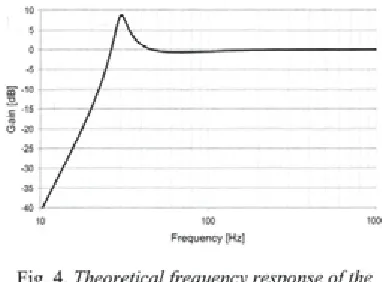
The loudspeaker for anti-noise generation was built in an open box. A ccording to its casing, theoretical response o f the loudspeaker w as calculated by the program W inISD 0.44. From the theoretical frequency response in Figure 4 it can be evident that because o f resonant frequency at around 30 Hz, the loudspeaker is suitable for the use in a frequency range above 40 Hz.
Frequency [Hz]
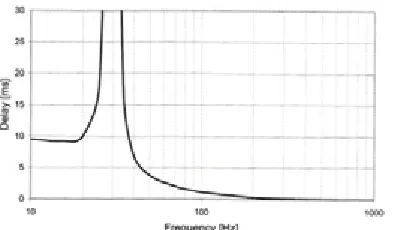
Fig. 5. Theoretical g ro u p d ela y o f a lo u d sp ea ker
Frequency range, appropriate for noise attenuation, is seen in Figure 5, w hich show s theoretical group delay o f the loudspeaker. A t 60 H z and lower, a group delay is too long for the system to w ork properly.
3.2. Frequency Response of a System
M any com ponents o f the A N C system have influence on the effectiveness o f noise attenuation and each o f them has its ow n transfer function. The m ain reason for delayed and m odified signal in a sim ple A N C system (w ithout electronic filters) is the loudspeaker, other com ponents (m icrophone, am plifier, cables, ect) contribute less.
M easurem ent o f the input and output w as perform ed in the open loop (Figures 6 and 7), from w hich the transfer function can be calculated. It is obvious that the signal is very m odified at the end o f the loop, after it passes all the com ponents o f the A N C system . Such a sim ple system is very hard to com pensate, because som e frequencies are filtered out by the transfer function o f the system . F or appropriate com pensation, the am plification o f these particular frequencies w ith zero am plitude should theoretically be infinite, w hich is not possible.
Frequency [Hz]
Fig. 6. In p u t sig n a l into the system
Fig. 7. O utput sig n a l fr o m the open loop
3.3. Noise Attenuation Measurement
Then the noise attenuation w ith the ANC system w as m easured. The m icrophone, w hich is used for m easurem ent o f the attenuation level (M l in Figure 3), w as placed near the exit o f the experim ental duct, 45 cm from the end. Noise spectrum w ith and w ithout use o f an ANC, m easured w ith the m icrophone M l, is seen in Figure 8 and the attenuation level in Figure 9. It is obvious that the useful frequency range o f the system is approxim ately betw een 40 and 140 Hz.
Fig. 8. A tte n u a te d (black line) a n d n o n -a tten u a ted (grey line) noise in the d uct
10 100 1000
Frequency [Hz]
W ith regard to the fact that som e ventilation fans produce noise m ainly in low er frequency ranges, this A N C system could be very useful in that cases, despite o f its narrow w orking range. B etter attenuation could be m easured if the prim ary noise w ould be narrow band or tonal noise, w hich is in fact m ore significant for ventilation fans.
4 SIM U LA TIO N
W hen constructing an A N C system , it is im portant to know its w orking lim its. Sim ulation o f the A N C w as perform ed, using M atlab 7.1, to predict the effectiveness o f the system . It show s the possibilities o f a particular A N C system in a sense o f how m uch the noise can be attenuated.
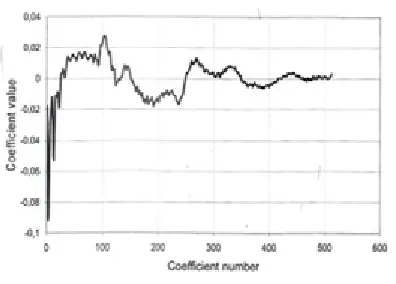
For a sim ulation to perform , the input and output o f the system w ith the open loop were m easured (as m entioned before). These two signals w ere used to calculate the coefficients o f the im pulse response, w ith the help o f an LM S filter (Figure 10). From the im pulse response coefficients, the response o f a closed loop can be calculated.
For a closed loop, the follow ing equation can be written:
x ( m ) = p ( m ) + f ( m ) , (5)
where
f ( m ) = K \ x ( m ) a l + x ( m - \ ) a 2 + ...
(6) ... + x { m - ( L - \ ) ) aL]
K is gain o f a feedback loop, m goes from L to the end o f the signal and L is the num ber o f filter coefficients. Extended equation is:
x ( m ) = p { m) + ^ [ x ( m ) a , +
(7) + x ( m - l ) a 2 +... + x ( m - ( L - l ) ) a L\
The final equation o f the (attenuated) signal can be w ritten as:
output
x ( m) = [ p(m) + K x (m 1 )a 2 +
1 - Aa, (8)
+ K x ( m - 2 ) a } + ... + K x (m - (L - \ ))aL]
In this w ay the transfer function o f the w hole system was sim ulated by the com puter program . To represent the efficiency o f the system , the input signal is com pared w ith the output signal o f the closed loop, w hich comes from the com puter algorithm .
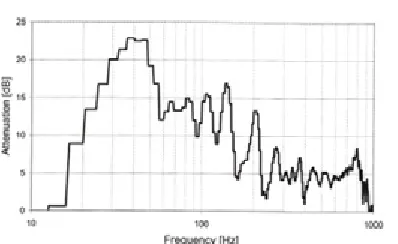
The results o f the sim ulation are represented in Figure 12 (attenuated and original signal) and in Figure 13 (attenuation level). As expected, the sim ulated noise attenuation level is higher than the real m easurem ent, because this is the best possible (ideal) attenuation for this specific ANC system and the equipm ent used.
Fig. 10. Im pulse response coefficients
A ccording to Figure 11, p (m ) is m easured input and x(m ) is output o f a closed loop. Filter coefficients are m arked as a h w here index i m eans its instantaneous num ber.
p(m) +
-►(sum x(m)
Fig. 11. B lo c k diagram o f a fe e d b a c k loop
But the useful frequency range is m ore sim ilar to that in m easurem ent, w hich confirm s that the sim ulation is correct.
Frequency [Hz]
Fig. 13. A ttenuation level o f the sim ulation
W hen evaluating the results, som e other influences should also be taken into consideration. The result is in strong correlation w ith the interm ediary length in a feedback loop and also w ith the position o f the m icrophone w ith regard to the loudspeaker o f the secondary source. This is because sound reflections are present in the duct and the sound is travelling in different directions. The m ore the m icrophone is far from the near-field, the m ore the reflections and other phenom ena influence on the signal, consequently low er the efficiency o f the system is.
Besides, the result also depends on the place, w here the attenuation is m easured (m icrophone M l in Figure 3). Because o f the im pedance m ism atch betw een the duct and the surroundings, a part o f the sound w aves is reflected back to the prim ary source, w hich leads to the standing w aves phenom ena [6] and [7]. On the specific points o f the duct at the specific frequency, nodes are form ed, w hich m ean that at that points the m easured noise level w ould be very low.
5 C O N C LU SIO N S
The experim ental ventilation duct w ith a feedback m ethod o f an A N C w as constructed. The possibilities o f the A N C w ithout additional electronic or other filters w ere investigated, because an im portant part o f tim e delay o f the signal m ay be caused by the filter. The LM S filter and the m easured input and output signal w ere used to do the sim ulation o f an A N C system . It show s the m axim um possible attenuation for a
specific A N C system . T hen the m easurem ent o f the attenuation level w as perform ed. The experim ent show ed that the additional filters can be avoided, if only a specific frequency range o f noise (about 40 to 140 H z) m ust be attenuated. Som e ventilation fans can m eet this requirem ent. In this case, the A N C system becom es very sim ple and robust, because the feedback loop is constructed o f few er com ponents. It contains ju st a m icrophone, an am plifier and a loudspeaker. D uring a design process, an engineer should be aw are o f the fact that the efficiency o f the system depends on the position o f the error m icrophone w ith regard to the loudspeaker for the anti-noise generation. T hey should be located close to each other, but not too close to becom e influenced too m uch by the near-field.
The noise, used for m easurem ents and sim ulations, w as broadband pink noise. B etter attenuation is expected in case o f using narrow band or tonal noise, w hich are m ore sim ilar to the real ventilation fan noise.
6 REFER EN C ES
[1] Tokhi, M. O .L eitch, R. R. (1992) Active N oise Control, C larendon P ress, Oxford, USA.
[2] O lson, H. F., M ay, E. G. (1953) Electronic Sound A bsorber, J. Acoust. Soc. A m . 25(6), p. 1130-1136.
[3] Prezelj, J. Čudina, M . (2007) D ipole in orthogonal direction as a secondary source for active noise control in ducts, A cta A c u stic a u n ite d w ith A cu stica 93, p. 63-72. [4] Sakai, H., M iyagi, S. (2003) A nalysis o f the
adaptive filter algorithm for feedback-type active noise control, S ig n a l p ro c e ssin g 83, p. 1291-1298.
[5] Sun, X ., K uo S.M ., M eng, G. (2006) A daptive algorithm for active control o f im pulsive noise, Jo u rn a l o f S o u n d a n d
Vibration 291, p. 516-522.
[6] M unjal, M . L. (1987) A coustics o f ducts and m ufflers, Jo h n W iley a n d sons, N ew York. [7] Rom eu, J. Saluena, X. Jim énez, S.