Iranian Economic Review, Vol.16, No.31, Winter 2012
The Fundamental Impediments of Economic Growth
in Iran: An H-R-V Model
Abolghasem Mahdavi Hoora Majderezaee
Received: 2011/04/09 Accepted: 2012/02/08
Abstract
ranian economy has had a long history of development efforts. It’s now more than sixty years passed from the official attempts in development of the country through the so called economic, social, and cultural development plans. Iran has of course gained the fruits of modern economic era to some extent. However as a fact of observation, Iranian economy has not experienced a sustained economic growth during these many years of the attempts for economic development. The important question is why? This article introduces the framework of a model that intends to clarify the fundamental impediments of Iranian sustainable economic growth and tries to provide an answer, as reasonable as the constraints of the model permits. The model, maintaining the message of H-R-V model, extends it to the Iranian economic growth in a broader perspective. While we recognize the pathology of price distortions and activist policies, we observe the Iranian main development problems on some important binding constraints. In fact in this expanded perspective, instead of governments, the lives of whom are short, “governance”- be it in a market or a non market economy- is at the center of the attention. Keywords: Economic Growth, Private Investment and Entrepreneurship, HRV Model, Binding Constraint
1- Introduction
Iran is not a developed country and is not experiencing a sustainable growth and development path. This has been repeatedly quoted in different ways and by different authors researching and writing about Iranian
Associate Professor of Economics, University of Tehran, (Corresponding Author). Master of Economics, University of Tehran.
1 9 6 3 1 9 6 6
1969 19
7 2 1 9 7 5 1 9 7 8 1 9 8 1 1 9 8 4 1 9 8 7 1 9 9 0 1 9 9 3 1 9 9 6 1 9 9 9 2 0 0 2 2 0 0 5 2 0 0 8 -70 -60 -50 -40 -30 -20 -10 0 1 0 2 0 Ra te o f G ro wth (%) Year
Real per Capita GDP Growth
economy. Two of the seminal and recent examples are Esfahani and Pesaran (2008) and Naini (2007), not to mention tens of articles in Iranian and non Iranian academic journals that have come to the same result though using different models, offering various reasonable arguments, and showing the trends of numerous macroeconomic variables during the course of time. Figure 1 shows the historical trend of one of the most, if not the most, macroeconomic variables of the Iranian economy, namely the Per Capita GDP growth rate, with its fluctuations in five decades from 1960s on, just to add the authors of this work to the common agreement.
Figure 1: Real per Capita GDP Growth Source: World Bank, World Development Indicators
Mahdavi, A. & H. Majderezaee. /35
development regardless of different political tastes, therefore, cannot be easily dismissed.
Looking at the size of the country, size of the economy, population, vast area, geopolitical situation, abundant resources, the magnitude of nation’s human capital in terms of educated and skilled workers, well known historical background, and comparing the economy to economies with much less than these potentials, the question on the underdevelopment of Iranian economy seems to be more important. Why the country has not been able to put itself in the path of a sustainable economic development?
To generalize, the sense of agreement among academicians and many laymen interested on Iranian economy is that Iran is underdeveloped due to one, some or all of the following reasons: large size of the government; fierce intervention of government in the economy and its implications such as rent seeking, politically motivated activities, price distortions in product and factor markets; lack of physical, human and social capital; underdeveloped financial markets; limited domestic and international competition; weakness in privatization; lack of integration to the world economy; failing to attract foreign direct investment; and insufficient domestic investment.
Deeply looking at these reasons one can see the two sides of a coin: lack of market economy or government intervention.
free market policies of development are necessarily successful and all development strategies tending towards activist interventionist policies are unsuccessful. Therefore economic underdevelopment of Iran cannot be for the whole part related to non market policies. This doesn’t mean that this article welcomes the intervention of government to economic activities or even that the article necessarily agrees with the theories of contemporary economic development in their emphasis on the presence of governments in economic activities in developing countries, presenting variety of reasons, empirical studies and models. Examples are theories and models such as big push, coordination failure and O-ring. Instead, this research intends to find the fundamental impediments of Iranian economic growth or the most binding constraints to development, following the terminology and methodology set by HRV model.
To clarify the point and to find those binding constraints in Iranian economy, after a brief discussion on history of economic growth and development in Iran in section 2, we present the theoretical framework of growth diagnostics in section 3 as a mathematical background for the HRV model of development in Iran which is the subject matter of section 4. Section 5 raises some possible constraints and discusses on each of them to either reject or accept it as the most binding constraint. Section 6 concludes the materials.
2- A Brief History of Development Plans in Iran
The basis of what came to be known as development planning in Iran goes back to 1920s and 30s. Attempts at industrialization and modernization started in early 1920s when the government, though not announcing the objectives of its actions as economic development, allocated most of the resources to military and roads. To increase security, road construction and transport were at the center of attention, the interrelationship of the projects were not considered and resource allocation was not based on any investment criterion (Looney, 1977). However, the intention to industrialize, to modernize or to westernize the society in this period set a solid background for the later development planning.
Mahdavi, A. & H. Majderezaee. /37
-40 -30 -20 -10 0 1
0 2
0 3
0 4
0 5
0 60
1965 1969 1973 1977 1981 1985 1989 1993 1997 2001 2005
away with five year development plans, one year before the demise of his regime in 1979. The first development plan in post revolutionary Islamic Republic of Iran starts after an eight year war and covers the years 1989 – 1993. This means a ten year of halt between the last plan of the past regime and the first in the present system. From 1989 up until the present time the five year development plans have been approved in the parliament and have worked as the main document of the government to implement its economic, social and cultural objectives. In fact the Islamic Republic of Iran has to implement its development policies under planning system as a rule of constitutional law. (Article 43 of the Constitutional Law).
- A Lengthy Attempt, A Mediocre Result
The history of development plans in Iran shows a time, money, and wealth consuming process for development. Fluctuations in rate of growth of GDP and other macroeconomic variables however, are not indicative of a sustained growth despite the lengthy official process. See figures 1 and 2 for per capita GDP and gross fixed investment growth rates. The following sections are to provide a reasonable answer for this mediocre result in Iranian economy.
3- Theoretical Framework of Growth Diagnostics
The initial point of the growth diagnostic model is that a sustained growth is the result of private investment and entrepreneurship. Therefore the agents and the policy makers of an economy must look for the most important reasons of the low level of private investment and entrepreneurship. It is possible to understand, analyze and apply the HRV model without referring to its mathematical background. This is while the model is grounded on Ramsey (1928) optimal growth model and has a solid mathematical foundation1. Following Ramsey the model defines a utility function for households. They decide how much labor and capital to rent to firms and how much to save or consume. The problem is then to maximize the utility function: dt s t z c u U t s
s
( )exp ( ( ))
(1)
subject to a budget constraint:
) , , ,
( t t t t
t t
t nk f a x k
dt dk
c
(2)where c is the consumption per capita, n is the population growth, k is capital per worker,
a
is technological progress,
is the index of externality,x
is availability of complementary factors of production, such as infrastructure or human capital, and z is the rate of time preference. Firms maximize profits while technology, complementary factors of production and the index of externality are assumed to be exogenous. First order conditions imply:) 1 ( ) , . ,
(at t xt kt rt t
f
(3)t t t t t t t t t
t x k k f a x k w
a
f( ,
, , ) ( ,
, , ) (4)
Mahdavi, A. & H. Majderezaee. /39
At the same time the government spending are assumed fixed. If the government imposes a tax on rental price of capital, the after tax return to capital would be r(1). Maximization of (1) subject to (2), (3) and (4) and
setting up a Hamiltonian, we will obtain:
) ) 1 )( , , ( )( (
t t t t t t t t t t x a r c c c k k, (5)
which will hold in a balanced growth equilibrium.
is the inverse of the negative of the elasticity of marginal utility and
zn is the real interest rate.Now we can base our analysis of binding constraints to a sustained growth on equation (5), known as Euler equation. What does a high
, the cost of finance, mean? That the investment is low and the economy has a problem of liquidity constraint. What does a low r, return to capital, mean? That the investment is low and the economy has a problem of inefficiency. What might cause a high cost of finance? Well, we should check our access to international capital markets, and we should check our local finance market. In the former, we should check our country risk, FDI conditions, debt maturity situation and rules and regulations in the capital market with respect to the rest of the world. In the latter, we need to check for our domestic saving or our poor financial intermediation.Let’s now ask about a low return to capital. What might have caused it? Either low social return or low private return (low appropriability). The former, might be due to infrastructure bottlenecks, low human capital, bad management of land and other natural resources, hence low productivity. This means that the investment in these complementary factors is not sufficient. The latter, might be due to market failures such as coordination problems, information and learning externalities inducing difficulties in adopting new technologies, or it might be due to government failures such as macro instability (monetary and fiscal) and micro instability (poor property rights, corruption and high taxes).
The schematic diagram in the next section demonstrates the working of the model more clearly.
4- An HRV model of Economic Growth for Iran
To analyze the factors that affect the rate of return or the cost of capital, we need to empirically estimate equation 5. However the data needed to estimate that equation especially when we want to analyze the long run trends of macroeconomic variables affecting growth to select the most binding constraints are not available. In particular for Iran, the limited existing data are usually available from 1959 and many necessary items especially in financial sector are missed. Provided that the HRV model is basically designed for developing countries and by and large most of the LDCs face the problem of unavailability of data, a schematic diagram let the researcher to analyze groups of factors affecting each of the two impediments to growth, namely rate of return and the cost of capital.
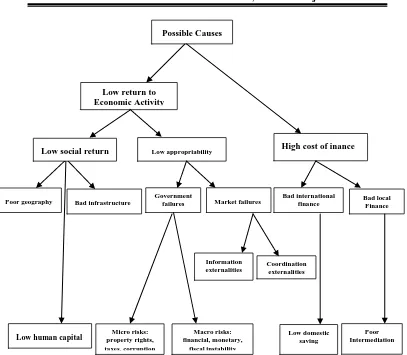
-Growth Diagnostic Decision Tree
The growth diagnostic decision tree adapted from Hausman- Rodrik- Velasco (2005) is exactly using the same logic, set and explained in the last section but in a diagrammatic way in which one should discuss each and every factor that leads to low levels of investment in the country. See Figure 3. Starting from the very top of the diagram the arrows lead to the bottom boxes, the boxes from which no arrows could extend further. With the first two branches of the tree the LDCs are divided between those for which the main problem is a low rate of return to investment and those for which the primary problem for private investment is high cost of finance. Each of these two branches then has underlying branches that explain why each of the two main upper branches exist. The procedure of reasoning while coming down from the so called decision tree is straight forward and like what was said in the theoretical section.
Mahdavi, A. & H. Majderezaee. /41
Figure 3: Growth Diagnostic Tree Adapted from Huasmann et al (2005) Problem: Low Levels of Private Investment and Entrepreneurship
-The Accept- Reject Procedure
Each of the branches of the decision tree represents an impediment to private investment and for that matter to economic growth. To find the binding constraint one must start from an upper level impediment and go to the underlying impediments to either accept or reject them as a binding constraint. The mechanism requires an in-depth knowledge of the economy under investigation both in micro and macro levels, in our case Iranian
Possible Causes
Poor geography
Poor Intermediation
Bad local Finance
Low domestic saving Coordination
externalities Information
externalities
Macro risks: financial, monetary,
fiscal instability Micro risks:
property rights, taxes, corruption
Low human capital
Bad international finance Market failures
Government failures Bad infrastructure
Low social return Low appropriability High cost of inance
economy. In fact it is a “disciplined art”, as Leipziger and Zagha (2005) have recognized.
To accept a constraint as the most binding or to reject it as so must be based on solid economic analysis. However, this does not mean that a binding constraint is to endure forever, hence a dynamic revision and re investigation of the economy’s situation is necessary.
Experience shows that when a constraint is binding, it will bring about activities that complicate the situation even more. High degree of informality, underground economy, poor legal institutions, and demand for informal mechanisms to substitute for legal enforcement process are some among many others.
Another point of importance before starting our practice with Iranian economy under HRV framework is that rejecting certain bottlenecks doesn’t mean at all that those are not considered as problems, only that they are not acting as binding constraints to the economic growth of the economy, reminding that the nature of the model is to prioritize the constraints to pick up the one(s) which are most binding. This last point deserves more attention in case of Iran since there are many problems simultaneously in real as well as in the financial sectors of the economy interacting with each other while suffering from and interacting with governance factors.
5- Low Growth Due to Low Levels of Investment
Mahdavi, A. & H. Majderezaee. /43
returns or the low private returns (low appropriability) that limit the investment? The following two sections try to answer these questions.
Figure 4: Gross capital Formation (constant 2000 US $)
Source : World Bank, World Development Indicators
5-1- High cost of finance
There are different ways to realize whether or not the cost of capital in Iran is high enough to be considered as a binding constraint.
Before going to the underlying causes of high cost of finance, let’s have a shortcut look at the level of inventories in Iranian economy. In an open economy usually the change in inventories should average zero. It is understandable that in less developed countries with inefficiencies and price distortions it ranges between 1 to 2 percent of GDP. In Iran, in the time interval between 1988 - 2003 the change in inventories exceeded this range and averaged 7.3 percent of GDP. Specifically, Dobronogov and Naini (2007), in a study about the high level of inventories in Iran, show through world development indicators that the percentage of inventories with respect to GDP is more than GDP growth rate average, 4.3 percent in the period. The cost of capital approach to investment recognizes two determinants for the level of inventories in a country. Expected appreciation of inventories
0
200,000 400,000 600,000 800,000 1,000,000 1,200,000 1,400,000 1,600,000 1,800,000
1995 1997 1999 2001 2003 2005
Lower Middle Income
Middle East & North of Africa
IRAN
2007
Mi
ll
ion (
and high capital cost will reduce the level of inventories1. The observation of high rate of inventory in Iran is indicative of low cost of capital as well as expected appreciation of inventory, non contradicting but confirming each other.
5-1-1 Bad International Finance
There are two ways to investigate the international finance of a country: 1. The amount of sources received from abroad
2. The amount of the foreign debt of the country
The amount of sources received from abroad could be any of the following:
-Foreign aids: These aids come from international sources in case of a natural disaster or an economic crisis. These financial helps are transfer of funds that are not to be paid back and have to be spent in specific predetermined purposes. Statistics show that the volume of financial helps of the international organizations to Iran has been trivial. In 2006 the ratio of foreign aids to GNI has been 0.55 percent and the ratio of foreign aids to gross capital formation of the country has been 0.15 percent.
-Foreign Direct Investment (FDI): These types of investments include foreign investment in manufacturing, capital goods, land and/or inventories in a way that the investment and the management belongs to the foreigner. The amount of this type of investment, is indicative of a good relationship of the country with the rest of the world and is an index of gaining from foreign sources.
In Table 1, the ratio of FDI to GDP in Lower Middle Income, Mena and Iran for the years 2000 – 2009 is shown. The ratio shows the insufficient amounts of FDI in these groups of countries while showing this index is much worse in Iran.
Mahdavi, A. & H. Majderezaee. /45
Table1: Foreign Direct Investment, Net Inflows (% of GDP)
Source: World Bank, World Development Indicators
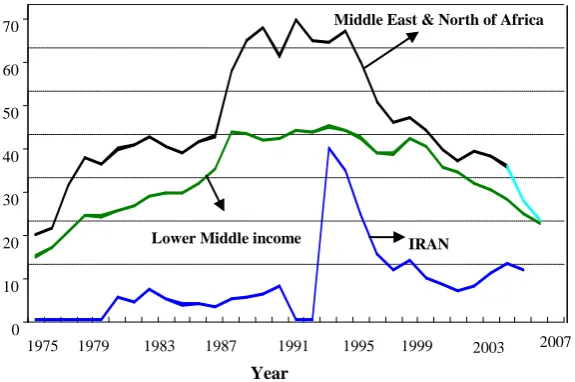
The amount of the foreign debt of a country is depended upon the status of the country in the world and the demand for foreign debt by the country. Figurer 5 shows the status of international debts for Lower Middle Income, Mena and Iran. The Figure shows how Iranian foreign debt is less than the two other groups of the countries. This is even true for the early 1990s which is the peak of foreign debts in Iran.
Figure 5:External Debt, Total (% of GNI)
Source: World Bank, World Development Indicators
We can simply conclude that as long as the FDI and foreign debts are concerned, the international finance in Iran is not in a good situation.
2000 2001 2002 2003 2004 2005 2006 2007 2008 2009
Iran 0 1 3 2 2 2 1 1 0 1 Middle East &
north of Africa
1 1 1 2 1 3 5 4 4 3
Lower Middle Income
2 2 2 2 2 3 3 4 3 2
1975 1979 1983 1987 1991 1995 1999 2003 0
10 20 30 40 50 60 70
IRAN
Middle East & North of Africa
Lower Middle income
2007
5-1-2- Bad Local Finance
1- Low Domestic Savings: One of the underlying reasons for bad local finance is the low domestic saving. Voluminous literature on economic growth and development, from the traditional ones to the contemporary, though not in complete agreement, accept that savings work as a necessary condition toeconomic growth. One can see this agreement among Solow (1956), Romer (1986), and Rodrik (2005 & 2006), respectively representative figures of the neoclassical, endogenous, and contemporary economic growth theories. Having said this, we must see the behavior of saving function in Iran. Figure 6 shows the gross savings as percentage of GNI for Iran. While we can see the acute fluctuations for Iranian case especially in 1990s but the movement is comparable with that of lower middle income countries and more than those countries. The figure shows that the saving with respect to Mena countries has been even more for the whole period under investigation.
Figure 6:Adjusted Saving: Gross Saving (%GNI)
Source: World Bank, World Development Indicators
-External Debt: But this may not satisfy our rigorousness. Economists look for both the reasons under the surface and the implications of any economic phenomenon. If the saving function behaves in a way indicative that the society does not like to save, the country must face a high external debt. This means that a relatively populated country in the region such as Iran, in the absence of national saving, must be using the foreigners savings to invest in the form of being a debtor. But looking at the external debt of
0 5 10 15 20 25 30 35 40 45 50
1993 1995 1997 1999 2001 2003 2005 2007
IRAN
Middle East & North
of Africa
Mahdavi, A. & H. Majderezaee. /47 Iran (Figure 6) doesn’t show this. In fact as the figure shows Iranian external debts are less than expected from a country of the size of Iran. Comparing the country with the Mena and lower middle income countries, the figure shows that even in the peak of its foreign debts in early 1990s, Iran is borrowing much less than the countries of the two groups.
-Current Account: The equilibrium level of income in an open economy is where total leakages equal total injections. Even though Iran is not an extreme case of an open economy it cannot be considered as an extreme closed economy either. So equilibrium S+M= X+I dictates that when the savings are lower than investment the current account must experience a deficit: S-I=X-M. However, this is not what in long run the current account of Iran shows. Looking at Figure 7 we recognize that in spite of fluctuations, and some deficits in late 80s and early 90s for the rest of more than three decades this variable has shown to be in surplus.
Figure7: Current Account of Iran (Million Dollar) Source: Central Bank of Iran Website
-Interest rates: For savings to be a binding constraint the return to depositors, interest rates or the so called profit rates in Iranian Islamic banking terminology (officially determined and announced), must get higher and higher. One has to get two important points into account in discussing the interest rate in Iran. First, and in general the rental rate of capital in most LDCs including Iran is artificially set and does not follow the law of supply and demand. Second that in Iran based on the Islamic banking operation there is no official rate of interest. This situation exacerbates the difference between two rates: official rate at which lenders and borrowers have to conduct their contracts, and the unofficial rate. The former, profit rate, is low
to the extent that is the subject of a long debate. Even among officials many believe that the rate should be set at a level that can at least compensate for the current inflation rate at any moment of time. The latter, unofficial interest rate, while applied to some extent but there is first no statistics about it and second obviously cannot be applied to serious projects in which banking system should involve. Therefore the official announced rates, now 12 percent for borrowing and 10 percent for lending are far below real. Now the argument is that if the savings are low, borrowers must chase for lenders. In fact if savings are low there should be a greater willingness to remunerate savings through higher interest rates (profits) to depositors. We don’t see any of these symptoms in Iran.
-Entrepreneurship: In a country that is constrained by low savings one logically expects that there exists a number of entrepreneurs full of investment ideas who look just for financial sources to invest. Doing
business, an international information institute that provides data and ranks
countries in degree of difficulty or ease to do a business, ranks Iran as 137th among 183 countries under study for 2010 in overall doing business. The elements used to find the overall state of doing business are factors such as starting a business, employing workers, registering property, getting credit, protecting investors and enforcing contracts. Based on the methodology of this institute, ranking the underlying elements determines the overall ranking. Iran is ranked 165th in protecting investors.
Local data and researches show that entrepreneurs are faced with uncertainty for investment. The sources of uncertainty are weak policies that make business difficult to conduct, changing of policies in a sudden manner, and the inconsistency of policies with the approved laws. A study shows that in average the time between the issuance of a policy inconsistent with law and withdrawing or substituting it with a new policy is 72 months. (Research Center of the Iranian Parliament, 2004). So entrepreneurship suffers from governance problems rather than from financial insufficiencies. We return to this discussion in sections about market and government failures.
Mahdavi, A. & H. Majderezaee. /49
compared to similar countries of this size. But it is important to note two points, first that usually the funds from international organizations such as World Bank or International Monetary Fund are given for the specific predetermined projects, and second that real estate is, due to risks presumed for productive activities, still a big sector of Iranian economy.
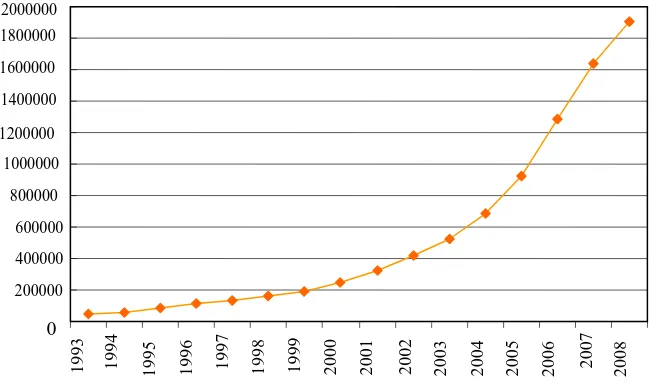
To conclude this section we refer to Figure 8 which shows gross fixed capital formation and national savings as percentages of GDP. The movement of the two variables over the last ten years supports the argument that Iran is not a saving constrained country. Even if the graph is interpreted as the insensitivity of investment to savings it still implies that saving rates do not constitute a binding constraint.
Figure 8: Gross Fixed Capital Formation & Gross National Saving of Iran (% GDP)
Source: Central Bank of Iran 0
5 10 15 20 25 30 35 40 45 50
1993 1995 1997 1999 2001 2003 2005 2007
Gross National Saving (%GDP)
2- Poor Intermediation: Table 2 shows the indexes for intermediation in Iran. The ratios of assets of Central Bank, commercial banks and other financial institutes to the whole financial assets of the banking system show the relative size of each financial body in the Iranian economy. The comparison of these ratios with that of the Lower Middle Income countries shows that the Central Bank’s size and importance among the other financial mediators. The Table also shows the volume of credits from commercial
banks and other financial institutes to private sector with respect to the whole size of the economy is low.
The ratios of overhead expenditures and marginal net returns to the whole assets are also shown in the table. A very low overhead expenditure in a developing country such as Iran means the lack of competitive markets, insufficient investment and banking services.
Table2: Indexes for intermediation
Source: Central Bank of Iran and Bank Scope
5-2- Low return to economic activity
Another possible constraint for low levels of private investment and entrepreneurship that may be a binding constraint to growth is the low return to economic activity. Before going to the underlying reasons for this, along the lines of Rodrik (2006) we ask what are the general signs and signals in any economy that experiences the low return to economic activity? There are some characteristics that economic rationality would verify for such an economy. If the returns to economic activity are low the economy must face low rates of interest, high bank liquidity, a situation that lenders chase for
Lower Middle Income Iran
Ratio of Central bank assets to total assets
16 41
Ratio of Commercial Banks assets to total assets
63 46
Ratio of Commercial Bank assets to Central & Commercial
Bank assets
77 54
Commercial Banks credit to private sector to GDP
27 20
Other bank & institution credit to private sector to GDP
7 8/4
Overhead expenditures to total assets
6 3/5
Marginal net returns to total assets
Mahdavi, A. & H. Majderezaee. /51 0 200000 400000 600000 800000 1000000 1200000 1400000 1600000 1800000 2000000 1 9 9 3 1 9 9 4 1 9 9 5 1 9 9 6 1 9 9 7 1 9 9 8 1 9 9 9 2 0 0 0 2 0 0 1 2 0 0 2 2 0 0 3 2 0 0 4 2 0 0 5 2 0 0 6 2 0 0 7 2 0 0 8
borrowers, current account is either in balance or in surplus, entrepreneurs are willing to invest abroad rather than in home country, and investible funds find their way to consumption or real estate rather than productive investment. In the previous section we have shown low interest rates, apathy of borrowers to lenders, current account surplus, and low entrepreneurship which is indicative of the tendency of entrepreneurs to capital flight. To complete this chain we have to see the trends of bank liquidity in Iran. Figure 9 shows that the bank liquidity has been high during the past decade. Now it’s time to see the origin of the low return to economic activity in Iran: low social returns or low private returns (low appropriability).
Figure 9: Bank Liquidity of Iran (Billion Rial)
Source: Central Bank of Iran
5-2-1- Low social return
0 1,000 2,000 3,000 4,000 5,000 6,000 7,000 8,000
2003 2004 2005 2006 2007 2008
Iran Jordan Saudi Arabia Syria
environmental determinism on the other, dictate that Iran’s economic growth is by no means constrained by poor geography. The country as vast as one fifth of the continental America with plenty of resources, arable lands, diverse climate, is relatively competent and even lies above many countries of its region and other regions. We don’t take time and space to report the country’s geographic features.
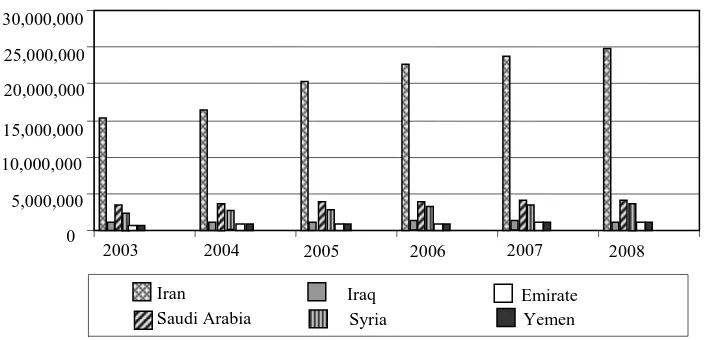
2nd. Infrastructure: The relationship between infrastructure and growth cannot be underestimated. There are studies that show this relationship in a formal way. One example is Canning and Pedroni (2004) who have incorporated infrastructure into growth theory and have concluded that infrastructure influences the long run growth. Iran’s comparative infrastructure base is fairly good. As long as the roads, internet users and telecommunications are concerned the country shows a better profile than the countries of the region. Figures 10-12 show the status of Iran in railroads, internet users and telephone lines as compared to a selected member of the countries in the region with a better condition in each of these indexes. Iran’s post revolutionary efforts in water supply and electricity through the construction of dams have been outstanding. Though Iran has been able to reconstruct some of the damages of war during recent years but there still is much work to be done. Air transportation needs a reconstruction and renewal of the aircrafts but sanctions have worked as an impediment to the fulfillment of this need.
Mahdavi, A. & H. Majderezaee. /53
Figure 11: Internet users Source: World Bank
Figure 12: Telephone lines
Source: World Bank 0
5,000,000 10,000,000
15,000,000 20,000,000 25,000,000
2003 2004 2005 2006 2007 2008
Iran Kuwait Jordan
Saudi Arabia Syria Emirate
0 5,000,000 10,000,000 15,000,000 20,000,000 25,000,000 30,000,000
2003 2004 2005 2006 2007 2008
Iran Iraq
Saudi Arabia Syria
3rd. Human capital: There are many studies that have shown the relationship between human capital and growth. What is established in the literature is that there certainly is a relationship between health and education, that is human capital, and growth. However what is not rigorously established is that human capital invariably and necessarily causes growth. Pritchett’s (1996) “Where has all the education gone?” reminds this. There are countries with high literacy rates that have not demonstrated a reasonable growth rate of output in long run. Sri Lanka, Costa Rica and the Phillippines can be mentioned as examples. Of course there are good reasons to believe that the causality runs in both directions: with higher income there is a potential to spend more on education and health, and with a greater human capital, higher productivity and incomes would be possible. To see if human capital is a binding constraint in a less developed country one way is to look at the existing indexes with respect to the population of the country and with respect to similar countries. The other way is to use the literature on the rate of return of years spent on education (Mincer, 1958). If the rate of return comes to be high the judgment is that human capital is binding.
Mahdavi, A. & H. Majderezaee. /55
5-2-2- Low Appropriability (Market & Government Failures)
only after the government has defined, determined and stayed for the rule of the law.
2nd. Coordination problems: A second market failure is caused by coordination problems. In addition to industrial structure and technology, developing countries lag behind developed countries in human capital, infrastructure and institutions. An industrial and technological upgrading requires simultaneous improvements in education, infrastructure, legal and financial institutions. For individual firms to internalize all of these cost effectively is impossible. To think of a so called super entrepreneur to do the coordination job is also impossible for high costs of doing the job, knowledge, capital needs, and the problems of forward and backward linkages and monitoring the managers. (Todaro, 2010). Therefore it comes to the government to do the public coordination of actions of private investors, not the direct production by itself. This has actually been the successful role of the industrial policy in East Asia. (Lall, 2001). What is the situation in Iran in this concern? We should again refer to Doing business. As was mentioned before, the rank of Iran in starting a business is 137th in 2010 among 183 countries which is not a good position. Yet the rank in protecting investment, one of the underlying factors to determine the overall raking in starting a business, is reported 165th among 183. Unfortunately then the “strength of investor protection index”, one of the three dimensions of investor protection, is reported three out of ten when ten is considered the best. This rank is indicative of a weak coordinating policy and a poor governance. A facilitating state that helps the private sector exploit or create comparative advantage, and a state who according to the senior Vice President of World Bank, Justin Lin (2009), works as a midwife not as a nursery maid can put the country in the path of a sustained growth. Nobel laureate Lewis (1955), who warned against ‘mischief done to economic life by governments’ pointed out at the same time that ‘no country has made economic progress without positive stimulus from intelligent government’. So again we are suggesting that governance, regardless of market or non market orientation is the binding constraint.
Mahdavi, A. & H. Majderezaee. /57
comprehensive institutional structures to support property rights in Iran or not? Yet even if this question has a positive cut answer, the more important question is whether or not Iranian institutional reforms in this concern have been proportional to social, economic and technological knowhow of the country? The recent decades have been the era of exogenous technological developments for LDCs including Iran, and this requires an appropriate development of institutions in a parallel line. The main role of a modern government is to define, determine and construct the legal position of the property rights. The real picture of the markets and their success or failure is to a great extent depended upon the legal position of the property rights. The enforcement of the property rights by governments brings about both the individual and social efficiency.
progress, and inflation rate, the national output has increased (54.5 times in 1973 – 1993), and as a result the number of contracts, exchanges, interactions and conflict of benefits among the agents has increased to a much more proportion. For these reasons we conclude that the legal position of property rights in Iran must experience a radical fundamental change to get along with the other developments, to decrease the transaction costs, to increase the social efficiency and to contribute to the sustained growth of the country. Some external sources have reported a rank equal to ten out of 100 for the property rights in Iran. (Heritage foundation, 2010).
Table 3: Index of Property Rights
Source: Different Annual Budgets of the Islamic Republic of Iran
4th. Corruption: Institutional shortcomings, simultaneous existence of stagnation and inflation (stagflation), unemployment, a low per capita income and a big government, though no one means corruption, but are all signals for corruption. The term corruption covers a broad range of human actions, but as long as the definition of corruption is concerned, the World Bank has defined economic corruption as “the abuse of public office for private gain”. (World Bank, 1996). A more recent definition of the term by World Bank (2009) asserts that “a corrupt practice is the offering, giving, receiving or soliciting, directly or indirectly, of anything of value to influence improperly the actions of another party.” One form of the many forms of corruption, bribery, has been at the center of attention by researchers. There are some who have discussed that economic effect of bribes may be positive and may not distort the short run efficiency of an economy if it merely entails a transfer of economic rents from a private party to a government official since it works as a market payment for ensuring that resources go to the party most likely to use them efficiently. (Ackerman,
2002 2003 2004 2005 2006 2007
share of general affairs expenditure from overall
budget (%)
5.6 4.3 3.9 2.8 2.21 2.7
tner ol vrdrfo erah rl raveh er ol trarenf
nllnee leoe odrenf vrdrfo erah rl raveh er
(%)
Mahdavi, A. & H. Majderezaee. /59
1997). Others have seen corruption including bribe in the context of growth and in a long run perspective, criticizing the idea of positive effects of bribe for its short run view. This strand of thought examines the links between investment, economic growth and the quality of government institutions. It finds that weak public institutions, as evidenced by unreliable contract enforcement, unclear property rights, unpredictable policies, inefficient public administration, corruption, and other indicators, significantly reduce private investment and lead to slower growth. (Bomer & Brunetti, 1994). This is the point of our attention since we are looking for, first the long run sustained growth of the country and second for the negative influences of corruption on growth and for that matter on private investment.
Now to trust on foreign data, Table 2 shows the control of corruption in Iran as compared to the countries of the region announced through World Development Indicators. The unobserved component model (UCM), used by World Bank to calculate the control of corruption is a mathematical and statistical work done for all countries each year and carries methodological rigorousness. As the table shows Iran is ranked one of the lowest in ‘control of corruption’ among 13 countries.
The data by foreign sources even if absolutely wrong, biased, and political, still have their economic influences in the country. Foreign investors and international economic and non economic agents trust and refer to these sources in their decision for investment in Iran or any other country and we know that Iranian government since long have announced and demanded for the foreign direct investment. This is still if we ignore the influence of these international numbers on domestic investors.
Table 4: Control of Corruption in Middle East Countries
2000 2002 2003 2004 2005 2006 2007
Iran -0.51 -0.3 -0.34 -0.52 -0.54 -0.53 -0.56
Bahrain 069 0.93 0.76 0.63 0.53 0.46 0.6
Iraq -1.46 -1.46 -1.13 -1.54 -1.4 -1.5 -1.39
Israel 0.98 1.04 0.97 0.83 0.77 0.93 0.79
Jordan 0.04 0.01 0.3 0.37 0.25 0.28 0.32
Kuwait 1.04 1.08 0.92 0.88 0.83 0.73 0.49
Lebanon -0.65 -0.77 -0.49 -0.55 -0.46 -0.38 -0.31
Oman 0.83 0.95 0.62 0.79 0.69 0.72 0.62
Qatar 0.84 0.88 0.69 0.7 0.82 0.82 1
Saudi 0.5 0.51 0.32 0.05 0.07 -0.03 -0.1 Syria -0.61 -0.3 -0.5 -0.64 -0.64 -0.8 -0.88
Emirate 0.83 1.16 1.18 1.16 0.96 0.96 1
Yemen -0.66 -0.69 -0.68 -0.87 -0.72 -0.68 -0.62 Source: The World Bank, development group, June, 2008
Mahdavi, A. & H. Majderezaee. /61
Anything to resolve this duality should of course be theoretically clear and empirically operational. What is obvious is that Iran must tend to realize more from tax revenues and depends less on oil revenues. But it’s worth mentioning that financial strength alone cannot do much help in improving the country's economic structure. Income generating sources should be the basis for levying taxes so as to guarantee sustainable growth of investments and production in the economy. This is a key point to avoid the tax evasion.
Table 5: Tax Revenues (Billions of Rial)
2000 2001 2002 2003 2004 2005 2006 2007 2008
Total Revenue
104640.80 125479.50 165156.70 207867.50 255000.26 387669.40 413927.99 472995.00 595975.21
Tax
Revenue 36585.2 41786.1 50586.5 65099.0 84421.1 134574.4 151620.9 191815.3 239741.4
Tax Revenue (%Total Revenue)
34.9 33.3 30.6 31.3 33.1 34.7 36.6 40.5 40.2
Source: Central Bank of Iran
0 50000 100000 150000 200000 250000
2001 2002 2003 2004 2005 2006 2007
Objective Performance
B
il
li
on
s of
R
ia
l
Figure 13: Objective and Performance of Tax Revenues
Source: Central Bank of Iran
Mahdavi, A. & H. Majderezaee. /63
system is in a range of stability whenever it is capable of facilitating (rather than impeding) the performance of an economy, and of dissipating financial imbalances that arise endogenously or as a result of significant adverse and unanticipated events’. (Schinasi, 2004).
There is more agreement on the definition of monetary stability. As it was indirectly said above, monetary instability, interrelated with financial instability is a situation in which the economy suffers from either inflation, or deflation (stagnation) or both at the same time (stagflation).
A major goal of macroeconomic policy is to achieve low and stable inflation. There are many reasons in defense of this goal. One reason often given is that lowering and stabilizing inflation improves the informational content of the price system and thereby favors a more efficient allocation of resources. In this view, price stability allows investments to be more effectively channeled towards projects with the highest returns since the best opportunities are more easily identified.
Fiscal instability is known as a situation of progressively increasing budget deficits that is usually brought about, either by progressive reductions in a government's tax revenues, or by progressive increases in the bond market's risk premium additions to the interest rates payable on its public debt.
Putting aside more details, complexities and controversies, the above definitions are the least common and agreed upon explanations of the terms. To compare and contrast these definitions with the Iranian status we have to refer to the realities of the economy through available data.
exchange rate, which in turn means a lower value of the national currency and inflation. The vicious circle doesn’t stop until the imbalance of the budgets impels the government to borrow from the central bank and the increase in the volume of base money and the huge amount of M1, a chronic traditional macroeconomic problem of post revolution economy. Reduction of effective demand for exporting corporations, at the same time, will induce the reduction of their profits and consequently to unemployment. The circle shows the full interconnectedness and the simultaneous operation of the three dimensions of macro risks and instabilities, namely, financial, fiscal and monetary. Also the mechanism clearly shows the linkage of the financial and monetary systems to the real economy where it explains the way in which employment, effective demand, trade and development projects are under the influence of the exogenous shock. This allows us to say that the second key element of the financial system, functioning in a way to prevent the shocks to have disruptive effect on the real economy, has not worked well. Of course Iran as an oil exporting country has always been influenced by the fluctuations in oil prices. Depending on the magnitude of the price change and the ability of the officials to manage the process, the outcomes already discussed have been different. Therefore to avoid making a fast judgment, we have to refer to available data and local researches.
Mahdavi, A. & H. Majderezaee. /65
As long as the fiscal instability is concerned, one cannot see the high budget deficits in Iran and rejects its influence on the growth rate of the economy in long run. Chronologically the budget deficits have shown to be financed by print of money. Some studies in Iranian economy show that there is a negative relation between the budget deficit and long run growth. (Samimi, et al, 2006). From the two important expenditure items of the annual budgets, current and development expenditures, the bulk of the former consists of the salary payments of the government personnel and cannot be reduced, so usually the latter which is allocated to infrastructural projects is reduced to make up the required resources for the payments. This by itself has a significant impact on the growth rate, the implementation of which needs appropriate infrastructure. In Table 4 we have shown the increasing trend of the budget deficits during the period starting from 2000 and ending 2008. For these reasons we would say the chronic budget deficits constitute a constraint for growth. But we immediately add that unfortunately everything depends on the oil revenues. For years with a good amount and good price of the oil sale the government has been able to pomp the revenues in and for the bad years stuck. Hence, the binding constraint is somewhere else: oil, the spending procedure and for that matter a responsible governance.
Figure 14: Liquidity Growth and Inflation rates of Iran Source: Central Bank of Iran
0 10
20 30 40 50 60
1991 1992 1993 1994 1995 1996 1997 1998 1999 2000 2001 2002 2003 2004 2005 2006 2007
Table 6: Budget Deficits of Iran (Billions of Rial)
Source: Central Bank of Iran
6-Conclusions
We started this research with some ambiguities but with too much of hope and ambition to do a burdensome task of trying to answer a question carrying many economic and noneconomic dimensions: what is (are) the most important binding constraint (s) of a sustainable economic growth in Iran. We are finishing with too much of confidence that we must have done the job and remain the resolution of more ambiguities for the future research. After a brief history of economic development in Iran, a theoretical framework, an HRV model of economic growth for the country, introducing the low levels of investment as the main reason of low growth in Iran and investigating for the binding constraint (s) to low investments in all branches of HRV decision tree, according to the instruments and the constraints of the model, our analysis let us emphasize on two broad areas of concerns as the constraints to the sustained growth of the Iranian economy. In micro risks, the governance problems in the areas of property rights, corruption and coordination deficiencies and in macro risks, the governance problems in forms of fiscal and monetary instabilities. Of the two sets of constraints our attention is focused on the governance factors concerning property rights, corruption and coordination deficiencies as the binding constraints. While we have shown the other constraints of the economy such as international and local finance, recognition of the binding constraints have been at the center of attention. Purposefully, on recognition of these governance problems as binding, our analysis stressed and emphasized on the economic elements. However we believe, there are social, historical, anthropological and political elements that can support these results, the research on which remains on the shoulders of the researchers in these disciplines.
2000 2001 2002 2003 2004 2005 2006 2007 2008
Revenue 104608.9 125479.5 165156.7 207867.5 255000.26 387669.4 413927.99 472995 595975.21
Payment 105049.28 125297.7 202325.3 252054.99 304229.42 448522.8 561359.1 578549.9 777785.78
Budget
Mahdavi, A. & H. Majderezaee. /67
References
1-Ackerman, Susan (1996), When is Corruption Harmful?, a background paper for World Development Report 1997.
2-Amuzegar, Jahangir(1977), Iran An Economic Profile, the Middle East Institute, Washington DC,
3- Amuzegar, Jahangir. (2008), Iran’s Major Economic Surgery, Middle East Economic Survey Vol LI, No.47.
4-Baroomand S. (2008), Corruption, Private Investment, and Growth (case of Iran), The Quarterly Journal of Quantitative Economics, Vol.5, No.2, PP:107-129
5- Bin Zhou, Geographical Conditions and Economic Development, Department of Geography, Southern Illinois University Edwardsville Edwardsville, IL 62026
6- Borner, A. Brunetti, and B. Weder (1994), Political Credibility and Economic Development, New York: St. Martin's Press,
7- Canning, David. Pedroni, Peter (2004), The Effect of Infrastructure on Long Run Economic Growth, JEL.
8- Constitutional Law of Islamic Republic of Iran.
9- Dobronogov, Anton. Jalali Naini, Ahmad Reza (2007), Explaining large Inventories: The Case of Iran, Middle Eastern Finance and Economics, Issue1.
10- Duisenberg, Wim F.(2001), The Contribution of the Euro to Financial Stability, in Globalization of Financial Markets and Financial Stability-Challenges for Europe (Baden-Baden: Nomos Verlagsgesellschaft), PP:37-51.
11-Huasmann, Ricardo, Rodrik, Dani.(2005), Self-Discovery in a Development Strategy for El Salvador, Economía, Vol.6, No.1,PP:43-101. 12- Iran’s economic, social, and cultural development plans.
13- Jalali-Naini A.R.(2007), Economic Growth and Economic Policy in Iran:1950-2003., in Contributions to Economic Analysis– Explaining Growth in the Middle East, by Jeffrey Nugent and Hashem Pesaran Editors, Elsevier, UK, 1st edition 2007.
15- Research Group, Macroeconomics and Growth Team & World Bank Institute of Global Governance Program
16-Lall, Sanjya.(2001), Competitiveness, Technology and Skills. Chelteham, England: Elgar.
17-Leiziger, D. and R. Zagha (2006), Getting out of the Rut, Journal of Finance and Development 43(1).
18-Looney, Robert E. Economic origins of the Iranian revolution. Pergamon press , New York, Oxford, Tornoto,1982.
19- --- ( 1977), Iran at the End of the Century. Lexington books, DC. Health and company, Lexington, Massachusetts, Toronto.
20- Mauro, P. (1995), Corruption and Growth. The Quarterly Journal of Economics, 110(3),PP: 681-712.
21- Mahdavi Mazdeh, A. (2001), Macro Strategies of Economic Growth, Institute for Commerce Studies and Research.
22- --- (2007), Economic Growth and Investment,Tehran: Jungle Publication.
23- --- and A. Nasiri Aghdam, (2010), The Evolution of the Research Program of an Economist: Douglas, C. North, Biquarterly Journal of Economic Essays.
24- Nelson, M.A., Singh R.D.(1994), The Deficit Growth Connection: Some Recent Evidence from Developing Countries; Economic development and Cultural Change(vol.42).
25- North, D. (1993), "Institutions and Credible Commitment", JITE, Vol.149,
No.1, PP: 11-23.
26- Ranani, Mohsen (1975), Bazar and Nabazar, Tehran: Jahade Daneshgahi.
27-Rodrik D. (1994) .Getting Interventions Right: How South Korea and Taiwan Grew Rich, BER Working Paper No. 4964.
28-Rodrik, D. Subramanian, A.Trebbi, F (2004), Institutions rule: The Primacy of Institutions over Geography and Integration in Economic Development. Journal of Economic Growth 9, PP: 131-165.
Mahdavi, A. & H. Majderezaee. /69
30- Salehi Esfahani, Hadi. Pesaran, M. Hashem (2009).The Iranian Economy in the Twentieth Century: A Global Perspective. Iranian Studies, 1475-4819, Volume 42, Issue 2, PP: 177 – 211.
31- Samimi Jafari,A. Alizadeh M. Azizi, K (2006), Investigation of long run relationship between budget Deficit and Macroeconomic Performance: A Theoretical and Empirical Analysis, Journal of economic Research, Vol.6, No. 4.
32- Schinasi, Garry J. (2004), Defining Financial Stability, IMF Working Paper International Capital Markets Department.
33- Todaro, M. Smith,C.(2009), Economic Development, Pearson Addison Wesley.