16
THE EFFECT OF CARDIORESPIRATORY FITNESS ON THE
ASSESSMENT OF THE PHYSICAL WORKING CAPACITY AT THE
FATIGUE THRESHOLD
Brittney M. Mikkelsen1, Jorge M. Zuniga2, William K. Herron1, Frances E. Frauso1, Anne N. Pulliam1 1Department of Exercise Science and Pre-Health Professions, Creighton University, Omaha, NE, USA
2Department of Biomechanics, University of Nebraska Omaha, Omaha, NE, USA
Abstract
Purpose: The purpose of this study was to determine if different cardiorespiratory fitness levels
(maximal oxygen uptake or VO2max) affect neuromuscular fatigue as measured by the physical working capacity at the fatigue threshold (PWCFT). Methods: Fourteen adults (14 men; mean ± SD; age = 20.79 ± 0.89 years; body weight = 80.7 ± 10.91 kg; height = 178.4 ± 5.29 cm) volunteered to participate in the investigation. Each participant performed an incremental cycle ergometry test to fatigue while electromyographic (EMG) signals were measured from the vastus lateralis (VL) muscle. Mean, standard deviation, and range values were calculated for the power outputs determined by the PWCFT. The relationships for EMG amplitude and power output for each participant were examined using linear regression (SPSS software program, Chicago, IL). An alpha level of p ≤ 0.05 was considered significant for all statistical analyses. Results: Participants were divided in a low and high fitness levels according to their VO2max values. A paired dependent t-test was used to determine if there were significant mean differences in power outputs associated to the PWCFT test for the low (Mean ± SD 162.5 ± 90.14 W) and high (173.21 ± 49.70 W) VO2max groups. The results of the dependent t-test indicated that there were no significant mean differences (p > 0.05) between the high and low VO2max groups. The zero-order correlation for the power outputs between groups were not significantly correlated (r = 0.23). Conclusion: The results of the present investigation indicated that the cardiorespiratory fitness level does not affect neuromuscular fatigue assessment during cycling.
17
Introduction
Electromyography (EMG) is a method used to examine the recruitment of muscle fibers throughout a movement and the electrical activity produced from the nerves in the muscle1. An EMG recognizes the signals and
converts the data to numerical values that can be transferred to a graph. The signal provides the amplitude and frequency of the energy produced in the muscle. The amplitude is determined by the number of motor units recruited and the increased rate of which the action potentials propagate throughout the muscle. As the intensity of the exercise increases, the muscles respond by recruiting more muscle fibers, thus, resulting in a higher amplitude
reading1. The amplitude of the EMG
determines the physical working capacity at the fatigue threshold (PWCFT). The PWCFT
represents the average value between the highest output without fatigue-related increases in EMG amplitude and the lowest power output at the point of fatigue-related
increases in EMG amplitude1-2. The
disproportional increase of the EMG amplitude has been used as an indicator of neuromuscular fatigue (NMF).
Fatigue can be understood as a decline in physical functioning or inability to maintain an exercise at the initial set intensity3.
Fatigue exists in two forms: central fatigue and peripheral fatigue. Peripheral fatigue is the type which manifests itself in the muscles, affecting the peripheral nerves, neuromuscular junctions, and the muscle
itself . As an individual begins to fatigue, the decline in his or her performance is a result of several changes in the muscle’s functioning. Changes occur in the maximum isometric force, shortening velocity, and relaxation time span3. Fatigue in the muscle
can be identified when the EMG displays the recruitment of more motor units (seen as a disproportional increase in EMG amplitude) to maintain the same exercise intensity2. In a study conducted by Camic et
al., at fatiguing exercise intensities, the
EMG amplitude increased linearly.
However, if the participants exercised at intensities that did not induce fatigue, no change was observed in the EMG amplitude2. By assessing the level of
exercise at which an individual begins to fatigue, one can determine an exercise intensity that will delay the onset of exhaustion.
The cardiorespiratory system circulates oxygen throughout the body and provides muscles with the essential sources required to exercise. In order to measure the cardiorespiratory response during exercise, there are different methods that are used. Throughout the exercise, ergometer tests are used in which a tube is attached on a participant to calculate his or her VO24.
18
based on a person’s physical fitness level. To assess CRF levels, the maximal oxygen uptake (VO2max) may be measured by an
ergometer test or by the Fick equation assuming values are provided to solve the
mathematical problem. VO2max is a
product of the maximal cardiac output Q (L blood x min-1) and arterial-venous oxygen difference (mL O2 x L blood-1)5. The higher
the CRF level on an individual, the higher VO2max they will have. Graef et. al. used an
EMG fatigue threshold test (EMGFT) to
examine the metabolic relationship
between VO2peak, ventilatory threshold
(VT), and the EMGFT in order to compare
the power output at VO2peak, VT, and
EMGFT. The main difference between
VO2max and VO2 peak is when the
participant decides to voluntarily withdraw from the test or not. In addition, the EMGFT
test is an adaptation to the PWCFT test,
using a bipolar supramaximal protocol6.
Previous studies verified the use of the
EMGFT as a reliable and non-invasive
method for identifying the onset of NMF6.
However, there was no significant
difference between metabolic values at EMGFT, VO2, and VT found6. Based on this
information, it is unclear if CRF has an effect on the assessment of a measure of muscular fatigue, such as PWCFT.
The purpose of this study was to determine if different cardiorespiratory fitness levels, measured by the EMG and ergometer procedure, affect the PWCFT. From the
EMG, the amplitude domain will provide
electrical signals that represent the amount of muscle fibers recruited throughout the exercise1. As the intensity of exercise
increases, the muscles recruit more muscle fibers and increase the amplitude reading. This increase in amplitude reading provides information about the development of fatigue1. Fatigue decreases the physical
functioning of the muscles and the ability to maintain an exercise at a high intensity level3. CRF plays an important role in the
delivery and utilization of oxygen to the exercising muscle with that said fatigue decreases the physical functioning of the muscles and the ability to maintain an exercise at high intensity level3,5. Based off
the previous study concluded by Camic, there is a correlation between the ventilatory threshold (VT) and PWCFT2. We
hypothesize from the knowledge
established in past studies that the higher an individual’s VO2max, the higher one’s
PWCFT.
Methods
Participants
Fourteen adults (14 men; mean ± SD; age = 20.79 ± 0.89 years; body weight = 80.7 ± 10.91 kg; height = 178.4 ± 5.29 cm)
volunteered to participate in the
19 Instrumentation
Maximal Cycle Ergometer Protocol
Participants were instructed on the maximal cycle ergometer test that they were going to execute. Each participant performed an incremental test to exhaustion on a Calibrated Lode (Corival V3, Groningen, the Netherlands) electronically braked cycle ergometer at a pedal cadence of 70 rev∙min-1. The seat was adjusted so that the participant’s legs were near full extension during each pedal revolution. Heart rate was monitored with a Polar Heart Watch system (Polar Electro Inc., Lake Success, NY). Borg’s rating of perceived exertion (RPE, 6-20) scale was explained to the participant and recorded for each stage of the test. The participants started pedaling at 50 W, and the power output was increased by 25 W after each 2-min stage until voluntary exhaustion. The test was terminated if the participant met at least two of the following three criteria: a) 90% of age-predicted heart rate (220-age), b) RPE of 18 or higher, and c) an inability to maintain the pedal cadence of 70 rev∙min-1.
After the test was finished the participants were encouraged to cool-down.
EMG Measurements
According to the SENIAM Project
recommendations, EMG electrode (circular 4 mm diameter, silver/silver chloride, BIOPAC Systems, Inc., Santa Barbara, CA) arrangements were placed on the vastus lateralis (VL) of both legs (7). Prior to placing the EMG electrodes, reference lines
were drawn after one-third the distance from the lateral border of the patella to the anterior superior iliac crest and was measured with the tape measure (Gulick Tape II, Moberly, Missouri) (7). A goniometer (Smith and Nephew Rolyan, Inc., Menomonee Falls, WI) was used to orient the electrodes at a 20 degree angle to the reference line to approximate the pennation angle of the VL (8). The site was carefully shaved, abraded and cleaned with an alcohol wipe. Electrodes were then placed over the vastus lateralis with interelectrode distance of 20 mm center to center to prepare for EMG measurements (1). Interelectrode impedance was less than 2000 Ω. The EMG signal was amplified (gain: x1000) using differential amplifiers (EMG 100, Biopac Systems, Inc., Santa Barbara, CA, bandwidth= 10-500 Hz).
Procedures Signal Processing
The raw EMG signals from the VL were digitized at 1000 Hz and stored in a personal computer for subsequent analysis (Inspiron 1520, Dell, Inc., Round Rock, TX). All signal processing was performed using a custom program written with LabVIEW
programming software (version 7.1,
National Instruments, Austin, TX). The EMG signals were bandpass filtered (fourth-order Butterworth) at 10-500 Hz.
Determination of the PWCFT
The PWCFT was determined by utilizing the
20
recorded from the VL during each stage of the cycle ergometry test to exhaustion (9). Six, 10-s EMG samples were recorded and used to calculate the average of the EMG amplitude (microvolts root mean square, µV RMS) values (9). The 10-s epochs for each stage were plotted in a graph across time and the slope was determined (2). The PWCFT was calculated by taking an average
of the highest power output that resulted in a non-significant slope (p > 0.05) and the lowest power output with a significant positive slope (p ≤ 0.05).
Statistical analyses
Mean, standard deviation, and range values were calculated for the power outputs determined by the PWCFT and VO2 methods.
The relationships for EMG amplitude and power output for each participant were examined using linear regression (SPSS software program, Chicago, IL). A paired dependent t-test was used to determine if there were significant mean differences in
power outputs between the PWCFT and the
VO2 methods. A zero-order correlation was
used to determine the relationships
between the power output of the PWCFT
and the VO2. An alpha level of p ≤ 0.05 was
considered significant for all statistical analyses.
Results
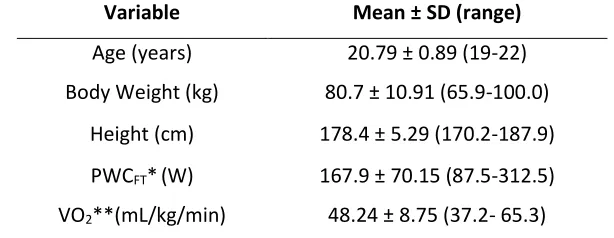
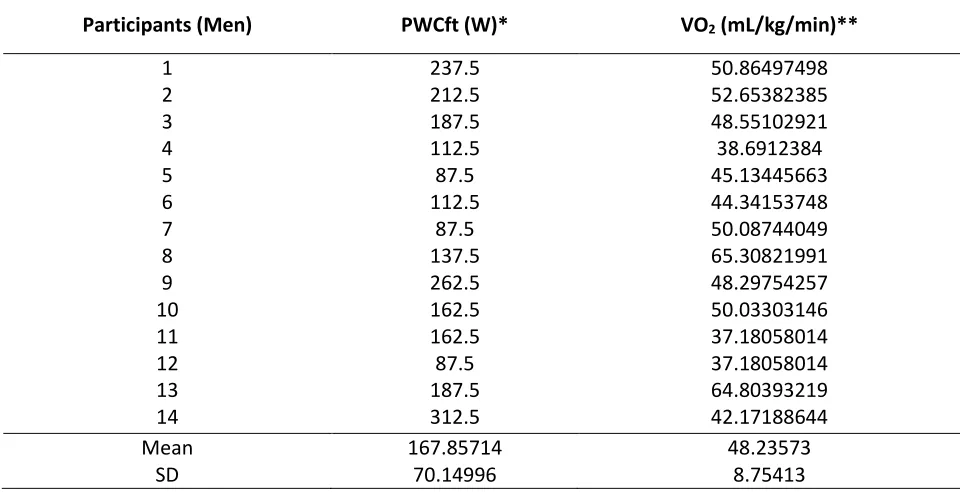
Table 1 provides the mean, standard deviation and range values for all fourteen participants’ demographic data. Table 2 provides the PWCFT and VO2 values for each
participant based on the EMG amplitude. The results of the dependent t-test indicated that there were not significant mean differences (p > 0.05) between the PWCFT high VO2 and PWCFT low VO2 values.
The zero-order correlation for the power
outputs determined by the PWCFT high VO2
and PWCFT low VO2 values showed that the
two methods were not significantly correlated (r = 0.23).
Table 1. Physical characteristics and means for fatigue thresholds (n=14). Variable Mean ± SD (range)
Age (years) 20.79 ± 0.89 (19-22) Body Weight (kg) 80.7 ± 10.91 (65.9-100.0)
Height (cm) 178.4 ± 5.29 (170.2-187.9) PWCFT*(W) 167.9 ± 70.15 (87.5-312.5) VO2**(mL/kg/min) 48.24 ± 8.75 (37.2- 65.3) * PWCFT = EMG physical working capacity at fatigue threshold
21
Table 2. Individual, mean, and standard deviation values for fatigue thresholds (n=14).
Participants (Men) PWCft (W)* VO2 (mL/kg/min)**
1 237.5 50.86497498
2 212.5 52.65382385
3 187.5 48.55102921
4 112.5 38.6912384
5 87.5 45.13445663
6 112.5 44.34153748
7 87.5 50.08744049
8 137.5 65.30821991
9 262.5 48.29754257
10 162.5 50.03303146
11 162.5 37.18058014
12 87.5 37.18058014
13 187.5 64.80393219
14 312.5 42.17188644
Mean 167.85714 48.23573
SD 70.14996 8.75413
PWCFT = EMG physical working capacity at fatigue threshold VO2 = Measure of maximal oxygen consumption
Figure 1. Example of method used for estimating the physical working capacity at the fatigue threshold
22
Discussion
The purpose of this study was to examine the effect of the cardiorespiratory fitness on the assessment of the PWCFT. It was
hypothesized that the higher an individual’s VO2max, the higher the one’s PWCFT would
be. The main findings of the present investigation disagreed with our hypothesis, as the analysis demonstrated that there were no significant mean differences (p >
0.05) between the PWCFT of the low (Mean
SD 162.5 ± 90.14 W) and high (173.21 ±
49.70 W) VO2max groups and that the
power outputs between groups were not significantly correlated (r = 0.23) to the PWCFT method when assessing NMF during
cycling. These findings suggest that the power outputs between groups could not be considered an accurate method of assessment for NMF using the amplitude domain of the EMG signal, therefore, in determining the PWCFT. It has been found
that the PWCFT test is determined by EMG
amplitude fatigue curves during a single continuous, incremental test on a cycle
ergometer2,10. Therefore, it seems
conceivable to suggest to researchers that utilizing VO2 levels as an indication of PWCFT
will not yield accurate measurements.
In the present investigation, the PWCFT from
the amplitude domain of the EMG signal
was compared to the high and low VO2
levels using the correlation test and dependent t-test. VO2max is a product of
the maximal cardiac output Q (L blood x
min-1) and arterial-venous oxygen
difference (mL O2 x L blood-1) and seems to affect the CRF, but it has not been shown to
affect the PWCFT5. In previous
investigations, the fatigue threshold
determined by the EMG amplitude have different factors between cardiac and
neuromuscular factors for fatigue11.
Previous studies2,10 reported that fatigue
induced signals from the EMG occurred at a lower power output for the amplitude than the frequency. The reasoning for this is unclear but several studies have suggested that the accumulation of metabolic byproducts of muscular contraction as an individual starts to become fatigued.
Previous studies conclude that the
intracellular pH level declines as lactate increases resulting in an indication for more motor units to be recruited to maintain the power output and, therefore, causing the muscle fiber conduction velocity to
decline12. The decrease in muscle
contractility could result in the PWCFT
occurring at a lower power output. With tests, the current findings supports VO2
levels could not be used to assess NMF when performing a cycle ergometer test.
In a more recent study, the EMG frequency-based test that was used to assess NMF during an incremental cycle ergometry was seen if it could be applied to a single workout on a treadmill to derive a new fatigue threshold for running. They found that the application of the PWCFT model
23
consistent with an earlier study that they were able to identify a demarcation
between fatiguing and non-fatiguing
exercise by statistically examining the slope coefficients for the EMG amplitude versus time relationship at each running velocity during the incremental treadmill test2. It is
likely that increases in EMG amplitude that occur during constant-velocity treadmill running reflect fatigue-induced increases in muscle activation that are necessary to maintain the required pace2. Zuniga et al.
suggests that in addition to VO2 increasing
to VO2max and blood lactate increasing
throughout the work bout, the severe
exercise intensity domain is also
characterized by a decrease in EMG MPF that results from declines in conduction velocity and changes in shape of the action potential waveform of active muscle fibers13. These findings do not support the
current investigation, and it could be the cause of different physiological mechanisms that was not taken into account for.
A potential limitation of this study was the variability among the test subjects. Subjects were selected based on availability to participate, with no preference for fitness level, cycling experience, or body composition, all of which could have been
sources of error in the present
investigation. Similarly, the small sample of subjects may have caused irregularities in the statistical analysis of the mean values. Future studies should examine larger populations with high levels of cycling
experience to produce more accurate results.
Future studies should examine the correlation between PWCFT and VO2 levels
using a larger sample with consistent fitness and cycling abilities. It could also examine the effects of different intensities or modes of incremental exercise on different muscle groups. Although the methodology used in this study was practical, it could be made
effective in a future investigation.
Certainly, multiple visits from the subjects could help assess retest reliability.
Interestingly, in the present study standard deviation of VO2 level were lower than
PWCFT indicating that it has less variability.
Collecting VO2max levels seems to be a
more practical way to assess
cardiorespiratory fitness instead of PWCFT
because the current findings show they are not correlated.
Conclusions
In conclusion, the present study found that were no significant mean differences in the high and low VO2 levels and the PWCFT
values. There were also no significantly correlated value when assessing the NMF. Our study and previous studies suggest that
PWCFT cannot be related to
cardiorespiratory fitness. These findings are important for exercise scientists, coaches, or athletes trying to assess NMF during incremental exercise testing. It can be
beneficial to exercise scientists in
24
separate physiological mechanisms than cardiorespiratory fitness. The findings also suggest that future studies should examine the physiological mechanisms that regulate
neuromuscular fatigue and
cardiorespiratory fitness assessed by
VO2max.
Acknowledgements
The authors would like to thank all of the subjects who donated their time for the study and students in EXS 407: Basic Statistics and Research Design (Spring 2016) who helped with subject recruitment and data collection.
Address for Correspondence
Jorge M. Zuniga, Ph.D., Department of Biomechanics, University of Nebraska Omaha, Omaha, NE, USA 68182. PHONE: (402) 554-3228; EMAIL: jmzuniga@unomaha.edu.
References
1. Galen SS, Guffey DR, Coburn JW, Malek MH.
(2015). Determining the electromyographic fatigue threshold following a single visit exercise test. J Vis Exp, 101, e52729.
2. Camic CL, Kovacs AJ, Enquist EA, VanDusseldorp
TA, Hill EC, Calantoni AM, Yemm AJ. (2014). An electromyographic-based test for estimating neuromuscular fatigue during incremental treadmill running. Physiol Meas, 35, 2401-2413.
3. Allen DG, Lamb GD, Westerblad H. (2008).
Skeletal muscle fatigue: Cellular mechanisms.
Physiol Rev, 88, 287-332.
4. Aminoff T, Smolander J, Korhonen O,
Louhevaara V. (1997). Cardiorespiratory and subjective responses to prolonged arm and leg exercise in healthy young and older men. Eur J
Appl Physiol Occup Physiol, 75, 363-368.
5. Medicine ACS. (2013). ACSM's guidelines for
exercise testing and prescription. Wolters Kluwer Health.
6. Graef JL, Smith AE, Kendall KL, Walter AA, Moon
JR, Lockwood CM, Beck TW, Cramer JT, Stout JR. (2008). The relationships among endurance performance measures as estimated from VO(2PEAK), ventilatory threshold, and electromyographic fatigue threshold: A relationship design. Dyn Med, 7:15.
7. Hermens HJ, Freriks B, Disselhorst-Klug C, Rau G.
(2000). Development of recommendations for SEMG sensors and sensor placement procedures.
J Electromyogr Kinesiol, 10, 361-374.
8. Fukunaga T, Ichinose Y, Ito M, Kawakami Y,
Fukashiro S. (1997). Determination of fascicle length and pennation in a contracting human muscle in vivo. J Appl Physiol (1985), 82, 354-358.
9. Bracciano EM, Zuniga JM, Mita AN, King KM,
Lawson TA, King KJ. (2014). The effects of precooling on the assessment of the physical working capacity at the fatigue threshold. J Ath
Med, 2, 20-28.
10. Camic CL, Housh TJ, Johnson GO, Hendrix CR,
Zuniga JM, Mielke M, Schmidt RJ. (2010). An EMG frequency-based test for estimating the neuromuscular fatigue threshold during cycle ergometry. Eur J Appl Physiol, 108, 337-345.
11. Guffey DR, Gervasi BJ, Maes AA, Malek MH.
(2012). Estimating electromyographic and heart rate fatigue thresholds from a single treadmill test. Muscle Nerve, 46, 577-581.
12. Lindstrom L, Magnusson R, Petersen I. (1970).
Muscular fatigue and action potential conduction velocity changes studied with frequency analysis of EMG signals. Electromyography, 10, 341-356.
13. Zuniga JM, Housh TJ, Camic CL, Hendrix CR,