An Estimation Of The Impact of Economic
Sanctions And Oil Price Shocks On Iran-Russian
trade: Evidence from a Gravity- VEC approach
Ehsan Rasoulinezhad*1, Liudmila Popova2
Received: 2016, April 5 Accepted: 2017, January 9 Abstract
his article is an empirical attempt to explore the relationship between sanctions (financial and non-financial), oil price shocks and Iran-Russian bilateral trade flows over the period 1991–2014. In contrast to earlier studies in which a gravity model has been estimated through a panel data approach, in this paper the authors apply a gravity model for only two countries and do the estimations using the vector error correction approach. The overall estimation results indicate that financial sanctions, non-financial sanctions and oil price shocks negatively impact the Iran-Russian trade. Furthermore, financial sanctions had the greatest negative impact on Iran-Russian trade rather than non-financial sanctions and sharp oil price shocks.
Keywords: Iran-Russian Bilateral Trade, Sanctions, Oil Price Shocks, Gravity Model, Vector Error Correction Approach.
JEL Classification: F42, F51, C13.
1. Introduction
It is widely believed that trade between two countries depends on a range of various factors. Although theoretically, the amount of capital, labor, technology, and even energy can be defined as the main production inputs affecting the power and capability of a country in foreign trade, there are a vast number of factors such as a financial crisis (Allen & Giovannetti, 2011), trade liberalization (Santos-Paulino, 2001), sanctions (Newnham, 2015; Rasoulinezhad, 2016), war (Anderton, 2001), natural disasters (Felbermayr & Grosch, 2013), which can make harsh changes in trade between nations.
1. Department of World Economy, Faculty of Economics, Saint Petersburg State University, St. Petersburg, Russia (Corresponding Author: erasolinejad@gmail.com).
2. Department of World Economy, Faculty of Economics, Saint Petersburg State University, St. Petersburg, Russia (l.v.popova@spbu.ru).
In the case of bilateral trade between Iran and Russia, one major factor that influences the trade flow is global oil price shock (Maui & Uleukaev, 2015; Idrisov et al., 2015; Taghizadeh Hesary et al., 2013; Farzanegan & Raeisian Parvari, 2014; Ito, 2009; Farzanegan, M.R. Markwardt, 2009; Rykunova, 1995; Nasre Esfahani & Rasoulinezhad, 2016; Taghizadeh Hesary et al., 2015, Taghizadeh et al., 2016). Sharp changes in oil prices (Based on the World Bank definition, ±30% oil price fluctuation compared to the previous year can be theoretically defined as a sharp oil price change) can immensely affect the economy of these two countries through the foreign exchange system and public budget. It is widely discussed that without an appropriate state control, a positive shock of oil prices can decrease economic growth, leads to a higher inflation and creates disproportions in bilateral trade flow (Takatsuka et al., 2015; Idrisov et al., 2015; Beine et al., 2012; Sachs & Warner, 2001; Fardmanesh, 1991; Fardmanesh, 1990; Krugman, 1987). Conversely, with a negative jump in oil prices, there is inevitable collapse in foreign exchange earnings leading to a critical shortage of foreign currency, which eventually causes trade deficit in oil-exporting countries (Malikov, 2016; Rati & Vespignani, 2015; Oxenstierna, 2015; Essers, 2013).
Interbank Financial Telecommunications) payment system, freezing foreign assets of the Iran’s Central Bank and the introduction of an embargo on its oil exports.
The main objective of this study is to find out how the sanctions and oil price shocks can influence on bilateral trade flow between Iran and Russia. To this end, we combine the physico-economic gravity trade model as a popular international trade theory with the VECM (Vector Error Correction Model) method and estimate our model over the period of 1991 to 2014. The choice of these two countries in this study is motivated by the fact that Iran and Russia are strategic allies in the region and many common interests have brought these two countries together. Therefore, analyzing the bilateral trade pattern of them would provide useful results for academics and policy makers.
The remainder of this paper is structured as follows: Section 2 provides a brief description of bilateral trade between Iran and Russia. Section 3 represents a brief literature review, while data and methodology are discussed in Section 4. Section 5 presents the research results and, Section 6 concludes with a discussion and directions for further research.
2. Major Trends in Iran-Russian Bilateral Trade
Since the end of the Iran-Iraq war of 1990 and the dissolution of the Soviet Union in the following year, economic relations between Iran and Russia have improved dramatically. The first major attempt of these two countries to improve bilateral trade and accelerate economic integration was establishing of a Joint Economic Commission in 1996 (Karimi, 2010). This effort was mainly made in response to the imposition of sanctions against Iran by the USA in 1996 (The Iran and Libya Sanctions Act of 1996 (ILSA))1. As a result of oil price shock of 1998 and under the pressure of the USA on Russia to put constraints on its exports to Iran (Gore-Chernomyrdin Agreement over Iran in 1999 (Black, 2004), the Iran-Russian bilateral trade decreased nearly by 20% over 1998-1999. However, since early of 2000s, economic ties between the two countries saw a certain improvement.
1. For futher information about this sanction, please read: Katzman, K. (2006). The Iran-Libya Sanctions Act (ILSA). CRS Report for U.S. Congress. URL:
This was a result of FDI liberalization in Iran, which allowed Russian oil companies to expand their investments in the Iran’s petroleum industry, and also a rapprochement of the countries since the first round of international sanctions on Iran in 2006, which facilitated political and economic relations between Iran and Russia as an opposition to the West. Consequently, trade volume between the countries went up over 1 billion USD in 2003 and then reached a peak in 2008 at almost 3.6 billion USD. In 2009, under a new oil price shock and a cancellation of the contract on delivery of the S-300 system to Iran, bilateral trade decreased again by nearly 17.1%. However, the more significant reduction in Iran-Russian bilateral trade occurred in 2011-12 after the introduction of an oil embargo on Iran by the EU and disconnection of Iranian banks from the SWIFT payment system (Carbaugh, 2014). The Iran-Russian trade volume has dropped to only 1.68 billion USD in 2014 from 2.3 billion USD in 2012. The development of trade between Iran and Russia during 1991-2014 is shown in Figure 1.
Figure 1: Iran-Russian Bilateral Trade (1991-2014, Million USD)
Resource: IRICA and Trade Map
Overall, during the whole period from 1991 up to 2014, bilateral trade between Iran and Russia surged from less than 200 million USD to nearly 1.6 billion USD. Nonetheless, over recent years, trade
0 500 1000 1500 2000 2500 3000 3500 4000
1991 1992 1993 1994 1995 1996 1997 1998 1999 2000 2001 2002 2003 2004 2005 2006 2007 2008 2009 2010 2011 2012 2013 2014
Milli
o
n
$
between the two countries was eroded. Despite Iran and Russia made various remarkable attempts to prop up and improve trade turnover through some economic cooperation agreements, but the financial and banking sanctions imposed against Iran in 2011 have noticeably pushed down the trade turnover between these two counties. Another reason for trade reduction was oil price shocks. Due to the high oil dependency of the Russian and Iranian government budgets, oil price shocks hugely influence their revenues (Smirnov, 2015; Kudrin & Gurvich, 2015; Bouoiyour et al., 2015; Bennkhodja, 2014; Fang & You, 2014; Malle, 2013; Rautava, 2004). In case of sharp decline in oil prices, their budget revenues also went down which hit bilateral trade. With a sharp increase in oil prices, the revenues of the countries also recovered, although this didn’t allow them to use high revenues to improve their trade.
With regard to commodity composition of mutual trade, it has undergone significant changes during 1991-2014. While in 1991 top export commodities of Russia to Iran were machinery, electrical instruments, steel and iron, by 2013 top Russian export goods to Iran included cereals, woods and electrical instruments. The structure of Russia’s merchandise imports from Iran during the period has remained virtually the same – both in 1991 and 2013 the most important items included agricultural products and organic metals. Throughout the period under review, Russia maintained a surplus in bilateral trade with Iran.
3. Literature Review of the Gravity Approach
A high number of scholars have investigated bilateral trade flows through the Gravity model, which is a well-known tool to model international trade (Brun et al., 2002; Redding & Venables, 2004; Liu & Xin, 2011; Novy, 2013; Ulengin et al., 2015; Rasoulinezhad & Kang, 2016; Rasoulinezhad, 2016; Rasoulinezhad, 2017; Popova & Rasoulinezhad, 2016). The related literature can be divided into three strands of study: (i) developing the gravity model; (ii) consideration of Iranian or Russian trade through a gravity model; and (iii) exploring the effects of oil price shocks or sanctions on trade volume.
trade flows goes back to Jan Tinbergen’s paper “Shaping the world economy: suggestions for an international economic policy” published in 1962. He believed that based on the Newton’s gravity rule, the trade between two countries can be a function of their economic sizes and distance between them (Tinbergen, 1962). The Tinbergen’s theoretical foundation of this model was further improved by (Linneman, 1966; Anderson, 1979; Helpman & Krugman, 1985; Bergstrand, 1989; Brocker, 1989; Deardorff, 1998).
represented the negative sign of ECO and positive signs of ASEAN, BA1 and SAARC RTAs. Chen & Novy (2011) applied a gravity model to find out trade integration across manufacturing industries in European Union countries. They concluded that substantial technical barriers to trade in specific industries are the most important trade barriers. Ulengin et al. (2015) developed two gravity models to analyze Turkish textile exports to 18 selected EU countries between 2005−2012. Their result proved the fact that the quota limitations violate Customs Union regulations.
The second strand of literature attempted to apply the gravity model to study trade pattern in the cases of Iran or Russia. Kaukin (2013) tested various gravity models to find out the trade pattern of the Russian Federation. His results showed the positive signs of GDP in Russia’s regions, GDP in Russia’s trade partners and borders, while depicted a negative coefficient for distance variable. Traekorova & Pelevina (2014) applied a gravity model to explore the trade flows between BRICS for the period of 2005-2011. Their findings for Russia represented a positive coefficient of GDP for both import and export. Besides, distance had a negative coefficient in export equation, while had a positive effect on Russia’s import during 2005-2010. Taghavi & Hosein Tash (2011) analyzed the international trade patterns of Iran with 12 oil exporting countries by using a gravity model. The results reported that GDP and distance are statistically significant in the case of Iran’s export to developed oil exporting countries, while they are statistically insignificant in trade with other oil exporting nations such as Libya and Nigeria. Soori & Tashkini (2012) investigated trade flows between Iran and regional blocs through a gravity model over the period of 1995-2009. The results of this study proved that geographical distance has a significant negative coefficient. Furthermore, they found that FDI is positively correlated with trade.
The third strand of research considered oil price and sanctions in the gravity model of international trade. Mirza & Zitouna (2010) tried to find out the impact of oil prices on the geography of US imports
through a gravity model. The results showed that an oil price shock would increase the share of US neighbors by around 0.8%. Beckmann & Fidrmuc (2012) examined the effects of oil price shock as a dummy variable on the CMEA (Council for Mutual Economic Assistance) trade during 1950-1990 by applying a gravity model. They concluded that the oil price crisis in the 1970s had several repercussions on Eastern Europe.
Van Bergeijk (1992) had an attempt to find out the impact of diplomatic barriers on trade through a cross section gravity model that deals with forty countries in the year 1985. His results depicted that any diplomatic sanctions can affect the export and export flows. Evenett (2002) estimated the impact of economic sanctions of eight industrialized economies on their imports from South Africa by using a gravity model. His findings showed that sanctions most adversely affected South African exports. Yang et al. (2004) applied an empirical analysis through a gravity model for the period from 1980−1998 to find out the impact of US economic sanctions on USA trade with other countries. The findings depicted that sanctions increased trade between target countries and the EU or Japan. Ziaee Bigdeli et al. (2012) investigated the impact of economic sanctions on the Iran’s trade flows with its 30 trade partners during 1972-2006 through a gravity model. Their results showed that the imposition of any economic sanctions against Iran can decrease its trade flows by 0.089%.
Overall, it can be seen that there has not been a serious attempt to examine the impact of sanctions and oil price shocks on the Iran-Russian bilateral trade. Hence, this paper would provide new and useful results in order to find out how both financial and non-financial sanctions, as well as oil price shocks can affect bilateral trade between Iran and Russia.
4. Data Description and Methodology
4.1 Dataset Description
import and export) between Iran and Russia in million U.S. dollars, GDP in current million U.S. dollars, transportation cost between these two countries in U.S. dollars, population in million people, trade openness in percent, three main dummy variables that are non-financial sanctions, non-financial sanctions and oil price shocks, and two control dummy variables consists of PV (President’s visit), WTO (Accession to the World Trade Organization). The main variables (time-variant variables) used in this study are all in natural logarithmic structure, based on the advantages of this form than using the level of variables (Wooldridge 2013). In the case of oil price shocks, we determined them based on the World Bank definition as global oil price changes of ±30% (World bank, 2015). It helps us to have a specific dummy variable of oil price shocks in our research. Table 1 reports definitions and units of all the variables. It should be noted that data on trade volume come from the ITC (International Trade Center, (Trademap, 2015)) and IRICA (Islamic Republic of Iran Customs Administration, (IRICA, 2015)). GDP, trade openness and population
Table 1: Variables of Model
Variables Definition Unit
Trade Trade volume between Iran and Russia Million US $
GDP GDP of Iran and Russia Million US $
POP Population of Iran and Russia Million people
TC Transportation cost U.S. Dollars
TO Trade openness
SANCNF
Dummy variable taking a value of one if there are non financial sanctions against Iran (1996,
2005-2014)
Dummy (0/1)
SANCF Dummy variable taking a value of one if there
are financial sanctions against Iran ( 2011-2014) Dummy (0/1)
OILSHOCK
Dummy variable taking a value of one if there are sharp changes in the oil prices (1998, 2003,
2007,2008,2009 ,2011,2014)
Dummy (0/1)
PV
Dummy variable captures a value of 1 in the years when there is president’s visiting from
Iran or Russia, otherwise it takes 0
Dummy (0/1)
WTO
Dummy variable captures a value of 1 in the years of Russia’s membership to the WTO (2012,2013 and 2014), otherwise it takes 0
Dummy (0/1)
Resource: Author’s compilation.
Indicators online database. Meanwhile, since just two countries (Iran and Russia) are considered in our gravity model, the distance variable which is a constant number over the time period should be omitted from the model. Hence, we have used the annual transportation cost (exporting full 40 ft containers from the Amirabad port in Iran to the Astrakhan port in Russia) data which are collected from the Amirabad port website.
4.2 Model Specification
The simple equational representation of the gravity model of international trade for a two countries (i and j) model is as follows:
𝑇𝑖𝑗= 𝐺 ∗ 𝐺𝐷𝑃𝑖∗ 𝐺𝐷𝑃𝑗/𝐷𝑖𝑗 (1)
Where G is the constant, T stands for bilateral trade flow, D indicates geographical distance and GDP represents economic dimensions of the two countries.
The above equation (Equation 1) can be changed into a linear form for the purpose of econometric analyses by employing logarithms:
𝐿𝑜𝑔𝑇𝑖𝑗= 𝛼 + 𝛽 log(𝐺𝐷𝑃𝑖) + 𝛿 log(𝐺𝐷𝑃𝑗) − 𝛷log(𝐷𝑖𝑗) + 𝜀𝑖𝑗 (2)
Deardorff (1998) used the following principle of logarithm to change the Equation 2 of gravity model:
Log (XY) = Log (X) + Log (Y) (3)
Therefore, his new form of gravity model can be formulated as:
𝐿𝑜𝑔𝑇𝑖𝑗= 𝛼 + 𝜇 log(𝐺𝐷𝑃𝑖∗ 𝐺𝐷𝑃𝑗) − 𝛷 log(𝐷𝑖𝑗) + 𝜀𝑖𝑗 (4)
Deardorff (1998) also added the variable population to the above equation and his final form of gravity model become as:
𝐿𝑜𝑔𝑇𝑖𝑗= 𝛼 + 𝜇 log(𝐺𝐷𝑃𝑖∗ 𝐺𝐷𝑃𝑗) + 𝜓 log(𝑃𝑂𝑃𝑖∗ 𝑃𝑂𝑃𝑗) − 𝛷log(𝐷𝑖𝑗) + 𝜀𝑖𝑗 (5)
It should be noted that this kind of gravity model of trade has been widely used by many researchers (Ulengin et al., 2015; Narayan & Nguyen, 2016; Goh et al., 2013; Rasoulinezhad & Kang, 2016; Rasoulinezhad, 2016) in order to catching better estimations, solving the collinearity problem, and lower bias.
gravity model form introduced by Deardorff (1998) and developed by Yang et al. (2004), our econometric model takes the following form of time series:
𝐿𝑛𝑇𝑅𝐴𝐷𝐸𝑡= 𝛽0+ 𝛽1𝐿𝑛𝐺𝐷𝑃𝑡+ 𝛽2𝐿𝑛𝑃𝑂𝑃𝑡+ 𝛽3𝐿𝑛𝑇𝐶𝑡+ 𝛽4𝐿𝑛𝑇𝑂𝑡+
𝛽5𝑆𝐴𝑁𝐶𝑁𝐹𝑡+ 𝛽6𝑆𝐴𝑁𝐶𝑁𝐹𝑡+ 𝛽7𝑂𝐼𝐿𝑆𝐻𝑂𝐶𝐾𝑡+𝛽8𝑃𝑉𝑡 +𝛽9𝑊𝑇𝑂𝑡+𝜀𝑡 (6)
In this model TRADE denotes aggregate trade fow between Iran and Russia, GDP is (GDPIran* GDPRussia) which represents the joint size of the
economy in Iran and Russia. POP indicates (populationIran*
populationRussia) that shows the population size in Iran and Russia. TC and
TO are transportation cost between these two countries and trade openness degree, respectively. Non-financial sanctions (SANCNF), financial sanctions against Iran (SANCF) and global oil price shocks (OILSHOCK) are our main three dummy variables, while President’s visiting (PV) and accession to the WTO (WTO) are our two control dummy variables.
Prior to implementation of examinations, the variables need to be analyzed for stationarity. In this study, the stationary analysis is carried by the Augmented Dickey Fuller (Dickey & Fuller, 1981; Dickey & Fuller, 1979) and the Phillips-Perron (Phillips & Perron, 1988) tests. After applying the stationary tests, if the variables are integrated of the same order, the Johansen-Juselius co-integration test (two different likelihood ratio tests, i.e. the trace test and maximum eigenvalue test) would be run to obtain the number of co-integrating vectors (before running this test, the Lag Length Selection would be implied to detect the lag length using three popular criteria as AIC,BIC and HQ)(Saboori et al., 2017).
If the Johansen-Juselius suggests that variables are co-integrated, an error correction model in VECM structure would be considered as follows:
∆LnTradet= α1+ α1ECTt−1+ ∑i=0n βi∆LnTradet−i+ ∑ni=0δi∆LnGDPt−i+
∑ni=0θi∆LnPOPt−i+ ∑ni=0γi∆LnTCt−i+ ∑ni=0μ𝑖∆LnTOt−i+ φDummy + ε1t(7)
Where β, δ,θ,γ and μ are the coefficients to be estimated, ECTt-1 is the
vector error correction term which is obtained by the long run co-integration relationship, φ is the coefficient of dummy variable, Δ is the difference operator, n is the number of lags and ɛ1t indicates the
5. Results and Discussion
5.1 Unit Root Tests
In order to evaluate the stationarity of all series, we performed two unit root tests on all variables at levels and first differences. The tests used are the Augmented Dickey-Fuller (ADF) and Phillips-Perron tests. The results are summarized in Tables 2 and 3 through which it can be concluded all the variables become stationary through doing first difference or in other words, all time series are I(1).
Table 2: ADF Unit Root Test Results
Variable ADF 1% level 5% level 10%
level H0 Stationary
LnTRADE D(LnTRADE) -2.04 -5.85 -3.95 -3.92 -3.08 -3.06 -2.68 -2.67 Accept Reject No Yes LnGDP D(LnGDP) -0.34 -2.73 -3.85 -3.83 -3.04 -3.02 -2.66 -2.65 Accept Reject No Yes (at 10%) LnPOP D(LnPOP) -2.26 -5.05 -3.83 -3.85 -3.02 -3.04 -2.65 -2.66 Reject Reject No Yes LnTC D(LnTC) -3.02 -6.16 -3.83 -3.85 -3.02 -3.04 -2.65 -2.66 Reject Reject
No (at 1%) Yes LnTO D(LnTO) -1.46 -4.62 -3.95 -3.92 -3.08 -3.06 -2.68 -2.67 Accept Reject No Yes Note: ADF refers to Augmented Dicky Fuller, D refers to first differences. Resource: Authors’ compilation from Eviews 7.0
Table 3: PP Unit Root Test Results
Variable PP 1% level 5% level 10% level H0 Stationary
LnTRADE D(LnTRADE) -3.02 -8.75 -3.83 -3.85 -3.02 -3.04 -2.65 -2.66 Accept Reject No Yes LnGDP D(LnGDP) -0.17 -2.73 -3.83 -3.85 -3.02 -3.04 -2.65 -2.66 Accept Reject No Yes (at 10%) LnPOP D(LnPOP) -1.96 -4.57 -3.83 -3.85 -3.02 -3.04 -2.65 -2.66 Accept Reject No Yes LnTC D(LnTC) -3.02 -8.75 -3.83 -3.85 -3.02 -3.04 -2.65 -2.66 Reject Reject
No (at 1%) Yes LnTO D(LnTO) -1.84 -4.44 -3.95 -3.92 -3.08 -3.06 -2.68 -2.67 Accept Reject No Yes Note: PP refers to Phillips-Perron, D refers to first differences.
Resource: Authors’ compilation from Eviews 7.0
5.2 Lag selection
find out the appropriate lag length (Taghizadeh Hesary et al., 2015). Table 4 shows the lag order selection criteria of our model. In this study, the optimal lags are chosen in regards to the Akaike (AIC), Schwarz (SIC) and Hanna-Quinn (HQ) criteria. The results report that the model should contain one lag by AIC , HQ and SIC criteria.
Table 4: Lag Length Selection
HQ SIC AIC Lag 11.19 11.42 11.05 0 2.36* 3.11* 2.38* 1 2.64 3.49 2.78 2 2.84 4.15 2.84 3
Resource: Authors’ compilation
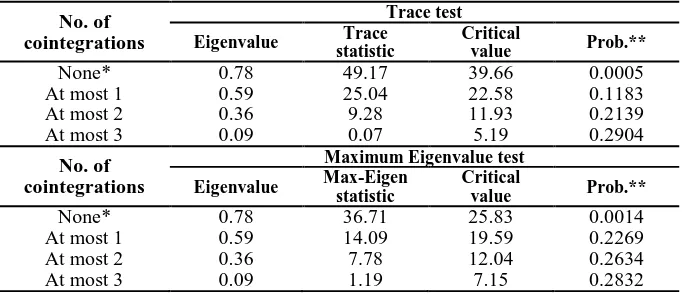
5.3 Johanson Cointegration Tes
As the ADF and PP unit root tests depicted that the variables are stationary, we can imply a co-integration analysis using Johansen’s method by assuming linear deterministic trend and drift, also taking the lagged ratio as 1 according to the lag selection results. Generally, Johansen’s technique is done through two likelihood ratio test statistics: the Trace and the Maximum eigenvalue. The Trace and the Maximum Eigenvalue tests suggest the existence of the co-integration relationship among research variables at the 0.05 level (Table 5). The results report that there are long-run equilibrium relationships between variables in our model.
Table 5: Johansen and Juselius Cointegration Test Results
No. of cointegrations
Trace test Eigenvalue Trace
statistic
Critical
value Prob.**
None* 0.78 49.17 39.66 0.0005
At most 1 0.59 25.04 22.58 0.1183
At most 2 0.36 9.28 11.93 0.2139
At most 3 0.09 0.07 5.19 0.2904
No. of cointegrations
Maximum Eigenvalue test Eigenvalue Max-Eigen
statistic
Critical
value Prob.**
None* 0.78 36.71 25.83 0.0014
At most 1 0.59 14.09 19.59 0.2269
At most 2 0.36 7.78 12.04 0.2634
At most 3 0.09 1.19 7.15 0.2832
Resource: Authors’ compilation from Eviews 7.0
5.4 VECM Estimation
Since all the series are co-integrated, a VEC model is set up for exploring short- and long-run relationships. It should be noted that all the three dummy variables should be included into the VEC model as exogenous variables (Zivot & Wang, 2006), hence they will not appear in the long-run vector. The long-run co-integrating vector, estimated by VEC is as below:
LTRADE = -0.57*LGDP – 0.06 *LTC + 0.12 *LTO + 0.73*LPOP – 3.17 (8)
According to the above equation (Equation 8), there is a positive relationship between population – trade flow and trade openness- bilateral trade flow, while there is a negative long-run relationship between economy size (GDP) and transportation cost with the Iran-Russian trade volume.
The results reveal that a 1% increase in the joint GDP in Iran and Russia, decreases the bilateral trade volume in the long-run by nearly 0.57%. The main reason is that when each of these two countries faces an economic problem with the Western countries, they try to improve the bilateral trade, while a good economic relation with the Western nations makes an economic divergence between Iran and Russia. Hence, an increase in GDP of Iran and Russia, which generally happens during good relations with the Western countries, may lead to divergence between these two countries and a lower bilateral trade flow.
In the case of the long-run relationship between Iran-Russia bilateral trade and transportation cost, the findings show that transportation cost negatively influences on the trade volume. A 1% increase in the transportation cost between these two countries, decreases the bilateral trade volume in the long-run by approximately 0.06%.
flow between these two countries.
Lastly, a 1% increase in trade openness degree of Iran and Russia can accelerate the bilateral trade growth between these two nations by nearly 0.12%.
Furthermore, the short-run coefficients are shown in the following table. It should be mentioned that the robustness of the VEC model is evaluated by applying the normality residual test of the Jarque-Bera and the White homoscedasticity test. Based on their results shown in Table 6, it can be concluded that our VEC model successfully passes all the tests.
Table 6: Short-run Estimation of VECM
Short run
Variables D(LGDP) D(LPOP) D(LTC) D(TO) OILSHOCK SANCF SANCNF PV WTO
Coefficients 0.51 0.09 -0.64 0.03 -0.23 -0.49 -0.35 0.51 0.24
t-statistic 3.42 4.11 3.51 4.80 -2.48 -5.22 -4.91 6.11 1.35
P-value 0.00 0.00 0.00 0.00 0.03* 0.00* 0.00* 0.00 0.54
R-squared 0.97
The normality residual test statistics of Jarque–Bera The joint test statistics of the White homoscedasticity test
3.28 36.14 P-value (0.31) Resource: Authors’ compilation from Eviews 7.0
shocks is consistent with the results of Sek et al., (2015), Rati & Vespignani, (2013), Qianqian, (2011), Korhonen & Ledyaeva, (2010), Lutz & Meyer, (2009), Faria et al., (2009) and Dick et al., (1984).
We did not find a similar result for our two control dummy variables. While president’s visiting positively affects trade flow between these two countries, the effect of Russia’s membership in the WTO is not statistically significant. The main reason is that by visiting the Iran’s president from Russia or vise versa, a number of economic agreements are signed and therefore the trade volume would be enhanced. Furthermore, since Iran is not a member of the WTO (Iran has an observer status at the WTO since 2005), Russia’s accession to the WTO could not make any opportunity for these two countries in order to go to reach a higher trade volume.
6. Conclusion and Policy Implications
This study mainly investigates the impacts of sanctions, as well as oil price shocks on Iran-Russia trade through the estimation of a gravity model for the quarterly data over the period 1991-2014. The estimation of our gravity model is done by the Vector Error Correction (VEC) approach.
As a new interesting result, it proved that GDP has a negative long-run relationship with the bilateral trade between Iran and Russia. The main reason is the tendency of these two countries to improve their trade relationship with the Western countries (Both of Iran and Russia are oil-based economy who want to have a good economic relationship with the developed and industrialized nations), while during the problem with the Western countries (sanctions, restrictions, etc.) when their GDP always decreases, they find each other as an regional allies and try to boost up their bilateral economic relationship. Hence, it can be concluded that an increase of GDP in Iran and Russia in long-run, which can be a sign of good relations with the West, may lead to divergence of these two countries. However, in the short-run, an increase in GDP leads to rise of the Iran-Russian bilateral trade, which is the principle of the gravity model of international trade.
Iran-Russian bilateral trade. This result proves the Staffan Linder (1961)’s theory (Linder, 1961). He expressed that a higher number of population tend to consume various bundles of goods. This fact is reflected by the positive coefficient of population in our gravity model of the Iran-Russian bilateral trade.
In addition, the results reveal that trade-distance nexus is negative in the case of Iran-Russia bilateral trade. This result is in line with many previous studies such as Leamer (2007) and Disdier & Head (2008) who found that trade volume declines dramatically with the distance. This variable can be considered as a geographical barrier between two trading partners and also as a cost for goods’ transportation.
Furthermore, we did not find any significant relationship between accession of Russia to the WTO and the Iran-Russian bilateral trade flow, while any president’s visiting strongly accelerates the trade growth between these two nations.
Lastly, the empirical results show that the coefficient of the financial sanctions was estimated as negative, which means imposing any financial sanctions against Iran has a profound negative effect on trade between these two countries. In addition, the effect of non-financial sanctions on Iran-Russian bilateral trade is statistically significant and negative as well. The influence of the oil price shocks on Iran-Russian trade is also negative, so any sharp changes in this variable will decrease the trade volume between these two countries.
According to the research findings we can make the following conclusions.
1. Due to the negative coefficient of non-financial sanctions in our research, it seems plausible that economic relations between Iran and Russia have greater potential in the absence of non-financial sanctions against Iran.
suddenly rise. But this situation cannot improve the trade volume between Iran and Russia. The main cause is the existence of the Dutch disease in Iran, which has been proved by many previous studies such as Mardaneh (2012), Manzoor et al. (2012) and Atashbar (2013), and means a sudden jump in oil revenues has a negative impact on economy growth of Iran. The negative coefficient of an oil price shock in our findings proves this fact. Hence an oil price shock, whether a sudden sharp increase or decrease in prices, influences adversely the bilateral trade of these two exporting oil countries.
3. The financial sanctions against Iran have a critical significance for bilateral trade development between Iran and Russia. According to our findings, it has a remarkable negative coefficient, which stands for the harsh and vigorous influence of this variable on bilateral trade. Nevertheless, despite Iran and Russia have attempted to solve this problem by creating a joint regulatory structure in order to improve financial transactions between their banking systems, bilateral monetary agreement or enhancing barter trade during global sanctions, up to now, it has not come in their real trade process.
4. Financial sanctions have the most negative effects on Iran-Russian trade. Excluding from SWIFT system, problems with issuing and payments of Letter of Credit, sanctions on the Iranian banks and the Central bank of Iran have dramatically harmed the amount of bilateral trade between Iran and Russia in recent years. However, lifting of financial sanctions in 2016 according to the Joint Comprehensive Plan of Action (JCPOA) would have a profound positive impact on the Iran-Russia trade turnover.
events, thereby we suggest to use another econometric model in the future researches to cover up this limitation.
However, from the point of our view, this research, proves a useful and interesting findings, which can help economists and policy makers to achieve a better view of Iran- Russia bilateral trade.
References
Allen, F., & Giovannetti, G. (2011). The Effects of the Financial Crisis on Sub-Saharan Africa. Review of Development Finance, 1(1), 1-27.
Anderson, J. E. (1979). Theoretical Foundation for the Gravity Equation. American Economic Review, 69(1), 106-116.
Anderton, C. H. (2001). The Impact of War on Trade: An Interrupted Time-Series Study. Journal of Peace Research, 38(4), 445-457.
Atashbar, T. (2013). Iranian Disease: Why a Developing Country’s Government Did not Listen to Economists' Advises. Americal Journal
of Economics and Sociology, 72(3), 732-760.
Barret, S. (1997). The Strategy of Trade Sanctions in International Environmental Agreements. Resource and Energy Economics, 19(4), 345-361.
Bazooabandi, S. (2015). Sanctions and Isolation, the Driving Force of Sino-Iranian Relations. East Asia, 32, 257-271.
Beckmann, E., & Fidrmuc, J. (2012). Oil Price Shock and Structural Changes in CMEA Trade: Pouring Oil on Troubled Waters? The
European Journal of Comparative Economics, 9(1), 31-49.
Beine, M., Bos, C. S., & Coulombe, S. (2012). Does the Canadian
Economy Suffer from Dutch Disease? Resource and Energy
Bennkhodja, M. T. (2014). Monetary Policy and the Dutch Disease Effect in an Oil Exporting Economy. International Economics, 138, 78-120.
Van Bergeijk, P. A. G. (1992). Diplomatic Barriers to Trade. De
Economist, 140(1), 45-64.
Bergstrand, J. H. (1989). The Generalized Gravity Equation, Monopolistic Competition, and the Factor-Proportions Theory in International Trade. Review of Economics and Statistics, 71, 143-153.
Black, J. L. (2004). Vladimir Putin and the New World Order: Looking
East, Looking West? Maryland: Rowman & Littlefield Publishers.
Blumenfeld, J. (1987). The Economics of South African Sanctions.
Intereconomics, 22(4), 190-198.
Bouoiyour, J., Selmi, R., Kumar Tiwari, A., & Shahbaz, M. (2015). The Nexus Between Oil Price and Russia’s Real Exchange Rate: Better Paths via Unconditional vs Conditional Analysis. Energy
Economics, 51, 54-66.
Brocker, J. (1989). Partial Equilibrium Theory of Interregional Trade and the Gravity Model. Spatial Interaction: Theory and Applications, 66(1), 7-18.
Brun, J. F., Carrere, C., Guillaumont, P., & De Melo, J. (2002). Has Distance Died? Evidence from a Panel Gravity Model. World Bank
Economic Review, 19(1), 99-119.
Byers, D. A., Talan, B. I., & Lesser, B. (2000). New Borders and Trade Flows: A Gravity Model Analysis of the Baltic States. Open
Economies Review, 11(1), 73-91.
Carbaugh, R. J. (2014). International Economics. Boston: Cengage Learning Press.
Cheraghali, A. (2013). Impacts of International Sanctions on Iranian Pharmaceutical Market. DARU Journal of Pharmaceutical Sciences, 21(64), 1-3.
Deardorff, A. V. (1998). Determinants of Bilateral Trade: Does Gravity Work in a Neoclassical World. In The Regionalization of the
World Economy. Chicago: University of Chicago Press.
Denant-Boemont, L., Masclet, D., & Noussair, C. N. (2007). Punishment, Counter Punishment and Sanction Enforcement in a Social Dilemma Experiment. Economic Theory, 33(1), 145-167.
Dick, H., Gupta, S., Vincent, D., & Voigt, H. (1984). The Effect of Oil Price Increases on Four Oil-poor Developing Countries: A Comparative Analysis. Energy Economics, 6(1), 59-70.
Dickey, D. A., & Fuller, W. A. (1981). Likelihood Ratio Statistics for Autoregressive Time Series with a Unit Root. Econometrica, 49, 1057-1072.
--- (1979). Distribution of the Estimators for Autoregressive Time Series with a Unit Root. Journal of the American Statistical
Association, 74, 427-431.
Dickie, P. (1992). The Gulf Crisis One Year on: Problems for International Traders. Marine Policy, 16(2), 107-110.
Disdier, A., & Head, K. (2008). The Puzzling Persistence of the Distance Effect on Bilateral Trade. The Review of Economics and
Statistics, 90(1), 37-48.
Ekanayake, E. M., Mukherjee, A., & Veeramacheneni, B. (2010). Trade Blocks and the Gravity Model: A Study of Economic Integration among Asian Developing Countries. Journal of Economic
Integration, 25(4), 637-643.
Elliott, K. A., & Uimonen, P. P. (1993). The Effectiveness of Economic Sanctions with Application to the Case of Iraq. Japan and
Essers, D. (2013). Developing Country Vulnerability in Light of the Global Financial Crisis: Shock Therapy. Review of Development
Finance, 3(2), 61-83.
Evenett, S. J. (2002). The Impact of Economic Sanctions on South African Exports. Scottish Journal of Political Economy, 49(5), 557-573.
Fang, C., & You, S. Y. (2014). The Impact of Oil Price Shocks on the Large Emerging Countries’ Stock Prices: Evidence from China, India and Russia. International Review of Economics & Finance, 29, 330-338.
Fardmanesh, M. (1991). Dutch Disease Economics and Oil Syndrome: An Empirical Study. World development, 19(6), 711-717.
--- (1990). Terms of Trade Shocks and Structural Adjustment in a Small Open Economy: Dutch Disease and Oil Price Increases.
Journal of Development Economics, 34(1-2), 339-353.
Faria, J. R., Mollick, A. V., Albuquerque, P. H., & Leon Ledesma, M. A. (2009). The Effect of Oil Price on China’s Exports. China
Economic Review, 20(4), 793–805.
Farzanegan, M., & Raeisian Parvari, M. (2014). Iranian-Oil-Free Zone and International Oil Prices. Energy Economics, 45, 364–372.
Farzanegan, M. R., & Markwardt, G. (2009). The Effects of Oil Price Shocks on the Iranian Economy. Energy Economics, 31(1), 134–151.
Felbermayr, G., & Groschl, J. (2013). Natural Disasters and the Effect
of Trade on Income: A New Panel IV Approach. European Economic
Review, 58, 18-30.
Furstenberg, G. M. (1991). Scoring the Success of Sanctions. Open
Economies Review, 2(3), 305-313.
Goh, S., Wong, K. N., & Tham, S. Y. (2013). Trade Linkages of
Inward and Outward FDI: Evidence from Malaysia. Economic
Helpman, E., & Krugman, P. (1985). Market Structure and Foreign Trade: Increasing Returns, Imperfect Competition and the
International Economy. Massachusetts: MIT Press.
Idrisov, G., Kazakova, M. & Polbin, A., (2015). A Theoretical Interpretation of the Oil Prices Impact on Economic Growth in Contemporary Russia. Russian Journal of Economics, 1(3), 257-272.
IRICA. (2015). Retrieved November 8, 2015 from http://www.irica.gov.ir.
Ito, K. (2009). The Russian Economy and the Oil Price: A Cointegrated VAR Approach. Transition Studies Review, 16(1), 220-227.
Jabalameli, F., & Rasoulinezhad, E. (2012). Iran Solutions against the Economic Sanctions: Analytic Hierarchy Process Approach. American
Journal of Business and Management. 1(1), 23-29.
Kaplow, L. (1990). A Note on the Optimal Use of Nonmonetary Sanctions. Journal of Public Economics, 42(2), 245-247.
Karimi, J. (2010). Iran-Russia Relations (The New Cooperation Era). Tehran: Iran’s Ministry of Foreign Affairs Press.
Kaukin, A. S. (2013). Empirical Estimates of the Gravity Model of the Russian Foreign Trade. Russian Foreign Economic Bulletin, 4, 71-84.
Korhonen, L., & Ledyaeva, S. (2010). Trade Linkages and Macroeconomic Effects of the Price of Oil. Energy Economics, 32(4), 848-856.
Krugman, P. (1987). The Narrow Moving Band, the Dutch Disease, and the Competitive Consequence of Mrs. Thatcher: Notes on Trade in the Presence of Dynamic Scale Economies. Journal of Development
Economics, 27(1-2), 41-55.
Kudrin, A. & Gurvich, E. (2015). A New Growth Model for the Russian Economy. Russian Journal of Economics, 1(1), 30-54.
Leamer, E. E. (2007). A Flat World, a Level Playing Field, a Small World After All, or None of the Above? A Review of Thomas L Friedman’s The World is Flat. Journal of Economic Literature, 45(1), 83-126.
Linder, S. B. (1961). An Essay on Trade and Transformation. New Jersey: John Wiley and Son.
Linneman, H. (1966). An Econometric Study of International Trade
Flows. Amsterdam: North-Holland Publishing Co.
Liu, X. & Xin, X. (2011). Transportation Uncertainty and International Trade. Transport Policy, 18, 156-162.
Lutz, C. & Meyer, B. (2009). Economic Impacts of Higher Oil and Gas Prices: The Role of International Trade for Germany. Energy
Economics, 31(6), 882-887.
Malikov, E. (2016). Dynamic Responses to Oil Price Shocks: Conditional vs Unconditional (a)Symmetry. Economics Letters, 139, 31-35.
Malle, S. (2013). Economic Modernization and Diversification in Russia. Constraints and Challenges. Journal of Eurasian Studies, 4(1), 78-99.
Manzoor, D., Haqiqi, I. & Aghababaei, M. E. (2012). Modeling Dutch Disease in the Economy of Iran: A Computable General Equilibrium Approach. Quarterly Energy Economics Review, 8(31), 59-84.
Mardaneh, S. (2012). Inflation Dynamics in a Dutch Disease Economy. University of Leicester Working Paper,12/25, Retrieved from http://www.le.ac.uk/ec/research/RePEc/lec/leecon/dp12-25.pdf.
Martinez-Zarzaso, I. (2003). Gravity Model: An Application to Trade Between Regional Blocs. Atlantic Economic Journal, 31(2), 174-187.
Maugeri, L. (2006). The Age of Oil: The Mythology, History, and
Future of the World’s Most Controversial Resource. Connecticut:
Maui, V., & Uleukaev, A. (2015). Global Crisis and Challenges for Russian Economic Development. Russian Journal of Economics, 1(1), 4-29.
Mirza, D., & Zitouna, H. (2010). Oil Prices, Geography and Endogenous Regionalism: Too Much Ado About (Almost) Nothing.
CPII Working Paper, 2009-26, Retrieved from
http://www.cepii.fr/PDF_PUB/wp_nts/2009/wp2009-26.pdf.
Narayan, S., & Nguyen, T. T. (2016). Does the Trade Gravity Model Depend on Trading Partners? Some Evidence from Vietnam and Her 54 Trading Partners. International Review of Economics and Finance, 41, 220-237.
Nasre Esfahani, M., & Rasoulinezhad, E. (2016). Will Be There New CO2 Emitters in the Future? Evidence of Long-Run Panel Co-Integration for N-11 Countries. International Journal of Energy
Economics and Policy, 6(3), 463-470.
Neuenkirch, M., & Neumeier, F. (2015). The Impact of UN and US Economic Sanctions on GDP Growth. European Journal of Political
Economy, 40, 110-125.
Newnham, R. E. (2015). Georgia on My Mind? Russian Sanctions and the End of the “Red Revolution”. Journal of Eurasian Studies, 6(2), 161-170.
--- (2013). Pipeline Politics: Russian Energy Sanctions and the 2010 Ukrainian Elections. Journal of Eurasian Studies, 4(2), 115-122.
Novy, D. (2013). International Trade without CES: Estimating Transloggravity. The Journal of International Economics, 89, 271-282.
Okubo, T. (2007). Trade Bloc Formation in Inter-war Japan. A gravity
Model Analysis. Journal of the Japanese and International
Economies, 21(2), 214-236.
Papazoglou, C. (2007). Greece’s Potential Trade Flows: A Gravity Model Approach. International Advances in Economic Research, 13(4), 403-414.
Phillips, P. C. B. & Perron, P. (1988). Testing for a Unit Root in Time Series Regression. Biometrica, 75(2), 335-346.
Popova, L. & Rasoulinezhad, E. (2016). Have Sanctions Modified Iran’s Trade Policy? An Evidence of Asianization and De-Europeanization through the Gravity Model. Economies, 4(4), 1-15.
Porojan, A. (2001). Trade Flows and Spatial Effects: The Gravity Model Revisited. Open Economies Review, 12, 265-280.
Qianqian, Z. (2011). The Impact of International Oil Price Fluctuation on China’s Economy. Energy Procedia, 5, 1360-1364.
Rasoulinezhad, E. (2017). China’s Foreign Trade Policy with OPEC
Member Countries. Journal of Chinese Economic and Foreign Trade
Policy, 10(1), 61–81.
--- (2016). Investigation of Sanctions and Oil Price Effects on the Iran-Russia Trade by Using the Gravity Model. Vestnik of St
Petersburg University, Series 5 (Economics), 2, 68-84.
--- (2012). Evaluation of Countries Solution against the US Economic Crisis through a Multiple Attribute Decision Model.
Journal of Economics and International Finance. 4 (1), 1-9.
Rasoulinezhad, E., & Kang, G. S. (2016). A Panel Data Analysis of South Korea’s Trade with OPEC Member Countries: The Gravity Model Approach. Iranian Economic Review, 20(2), 203-224.
Rati, R. A., & Vespignani, J. L. (2015). OPEC and Non-OPEC Oil Production and the Global Economy. Energy Economics, 50, 364-378.
--- (2013). Why are Crude Oil Prices High when Global Activity is Weak? Economics Letters, 121(1), 133-136.
Rautava, J. (2004). The Role of Oil Prices and the Real Exchange Rate in Russia’s Economy - a Cointegration Approach. Journal of
Redding, S., & Venables, A. J. (2004). Economic Geography and International Inequality. The Journal of International Economics, 62(1), 53-82.
Rykunova, T. (1995). Trade and Investment Opportunities in the Petroleum Industry of Russia. Chemistry and Technology of Fuels and Oils, 31(3), 99-103.
Saboori, B., Rasoulinezhad, E., & Sung, J. (2017). The Nexus of Oil
Consumption, CO2 Emissions and Economic Growth in China, Japan
and South Korea. Environmental Science and Pollution Research, 24(1), 1-20.
Sachs, J. D., & Warner, A. M. (2001). The Curse of Natural Resources. European Economic Review, 45, 827-838.
Santos-Paulino, A. U. (2001). Effects of Trade liberalization on Imports in Selected Developing Countries. World development, 30(6), 959-974.
Sek, S. K., Teo, X. Q., & Wong, Y. N. (2015). Comparative Study on the Effects of Oil Price Changes on Inflation. Procedia Economics
and Finance, 26, 630-636.
Shirov, A. A., Yantovskii, A. A., & Potapenko, V. V. (2015). Evaluation of the Potential Effects of Sanctions on Economic Development of Russia and the European Union. Studies in Russian
Economic Development, 26(4), 317-326.
Smirnov, S. (2015). Economic Fluctuations in Russia (from the late 1920s to 2015). Russian Journal of Economics, 1(2), 130-153.
Soori, A. R., & Tashkini, A. (2012). Gravity Model: An Application to Trade between Iran and Regional Blocs. Iranian Economic Review, 16(31), 1-12.
Taghizadeh Hesary, F., Yoshino, N., Abdolo, Gh., & Farzinvash, A. (2013). An Estimation of the Impact of Oil Shocks on Crude Oil
Exporting Economies and Their Trade Partners. Frontiers of
Economics in China, 8(4), 571-591.
Taghizadeh Hesary, F., Rasoulinezhad, E., & Kobayashi, Y. (2015). Oil Price Fluctuations and Oil Consuming Sectors: An Empirical Analysis of
Japan. ADBI Working Paper, 539, Retrieved from
https://www.adb.org/sites/default/files/publication/166896/adbi-wp539.pdf.
Taghizadeh Hesary, F., Rasoulinezhad, E., & Kobayashi, Y. (2016). Oil Price Fluctuations and Oil Consuming Sectors: An Empirical Analysis of Japan. Economics and Policy of Energy and the
Environment, 2, 33-51.
Takatsuka, H., Zeng, D., & Zhao, L. (2015). Resource-based Cities and the Dutch Disease. Resource and Energy Economics, 40, 57-84.
Tian, H., & Whalley, J. (2010). Trade Sanctions, Financial Transfers and BRIC Participation in Global Climate Change Negotiations.
Journal of Policy Modelling, 32(1), 47-63.
Tinbergen, J. (1962). Shaping the World Economy: Suggestions for an
International Economic Policy. New York: The Twentieth Century
Fund Publication.
Trademap. (2015). Retrieved November 10, 2015 from
http://www.trademap.org.
Traekorova, E. C., & Pelevina, K. A. (2014). Gravity Model of BRICS’s Foreign Trade. Journal of Saratov University, 1(2), 133-142.
Trofimova, O. E. (2015). Russian-Israeli Economic Cooperation Under Economic Sanctions. Herald of the Russian Academy of
Sciences, 85(5), 459-465.
Ulengin, F., Cekyay, B., Palut, P. T., Ulengin, B., Kabak, Q., Ozaydin, O., & Ekici, S. O. (2015). Effects of Quotas on Turkish Foreign Trade: A Gravity Model. Transport Policy, 38, 1-7.
Wooldridge, J. M. (2013). Introductory Econometrics: A Modern
World Bank. (2015). Global Economic Perspects. Retrieved from https://www.worldbank.org/content/dam/Worldbank/GEP/GEP2015a/ pdfs/GEP15a_web_full.pdf.
Xuegang, C., Zhaoping, Y., & Xuling, L. (2008). Empirical Analysis of Xinjiang’s Bilateral Trade: Gravity Model Approach. Chinese
Geographical Science, 18(1), 9-16.
Yang, J., Askari, H., Forrer, J., & Teegen, H. (2004). U.S. Economic Sanctions: An Empirical Study. The International Trade Journal, 18(1), 23-62.
Ziaee Bigdeli, M. T., Gholami, E., & Tahmasbi Beldaji, F. (2012). Investigation of the Impact of Economic Sanctions on Iran’s Trade: Application of Gravity Model. Journal of Economic Research, 13(48), 109-119.
Zivot, E., & Wang, J. (2006). Modelling Financial Time Series with
S-Plus. New York: Springer Press.