1
Abstract— as literature review shows it is possible to
replace synthetic dyes with echo-friendly ones as natural dyes. Although plants exhibit a wide range of colors, not all of these pigments can be used as dyes directly. Sunflower seed is one of the popular vegetal cooking oil source used in Iran, as well as in the world. The main colorants in the sunflower seed hulls (SFSH) are anthocyanin. Anthocyanin dyestuffs are mainly used in food industry. Most of the purple, blue and black fruits are sources of anthocyanin. Anthocyanins can be used as pH indicators because their color changes with pH. The aim of this study is to understand firstly the SFSH useable source for textile dyeing and secondly the effect of dyeing bath pH, temperature and dye concentration on the woolen yarn properties. The range of color developed on dyed materials are evaluated in terms of (L*, a*, b*) CIE LAB coordinates and the dye absorption concentration on the woolen yarn dyed by SFSH is studied by using K/S values. Also fastness tests on dyed samples for light and washing fastness were carried out.
CIELab coordinates of the samples change in different dyeing processes. This could be explained with presence of anthocyanin components that are sensitive to pH and temperature. The study of the effects of different factors on dye ability of wool by SFSH extract showed that the pH and the temperature of dye bath considerably affected the color yield. The best results were obtained at pH 3.5 and boiling temperature.
Keywords: dyeing, sunflower seed hulls, wool
I.INTRODUCTION
n recent years, there has been a growing tendency towards the use of natural dyes in textile coloration because of the increasing awareness of environment, ecology, pollution control and sustainability. Indeed, their use is mainly restricted to niche products for special markets such as the manufacturing of up market products and textiles eco-friendly. Thus, considerable research works have been undertaken around the world to discover new sources of natural coloring agents and especially the industry which lowers costs in order to make these textile products as popular as possible. The main colorant in sunflower seed hulls is anthocyanin. Its chemical structure is shown in Fig. 1.
Anthocyanins, also known as anthocyans, are water soluble flavonoid pigments that depending on pH and in some cases complexing agents, can contribute diverse colors such as red, purple and blue [1-4]. They can occur in
Z.Ahmadi is with the Department of Carpet, Faculty of Applied Arts, Art University of Tehran, Tehran, Iran. F. G. Houjeghan is with the Department of Handicraft, Faculty of Applied Arts, Art University of Tehran, Tehran, Iran. Correspondence should be addressed to Z. Ahmadi (E-mail: ahmadi@art.ac.ir).
almost all tissues of higher plants, including roots, stems, leaves, flowers, and fruits [3]. Sunflower is one of the major oilseed crops ranking fourth with a worldwide production of about 45.6 million Metric tons in 2016[5]; the share of Iran was 45000 Metric tons. A set of simple analytical procedures and variations in application of the dyes were compared with regard to a possible correlation of the dyeing results. The Indians of Southwest United States have extracted pigments from purple- hulled genotypes to dye blankets and other woolen goods for centuries [6]. The extracted anthocyanin from grape has been used as a source for textile dyeing [7-9]. Bechtold [8] has reported that applying anthocyanin extracted from grape produces moderate to weak fastness properties on the textile. He suggested these natural dyes can be a new source for textile dyeing. The purpose of this study was to use anthocyanins from purple-hulled sunflower genotypes to determine if such pigments were qualitatively and quantitatively competitive with other sources of natural pigments for textiles such as Indigo, Woad or Henna with mordant.
Fig. 1. Schematic chemical structure of anthocyanin [3].
The present study focuses on the valorization of sunflower seed hulls (SFSH) in dyeing and fastness properties of wool yarns. The effects of some experimental conditions (dye bath pH, dye bath temperature and dye concentration) on the dye-ability of wool were investigated.
II.EXPERIMENTAL
Purple Sunflower seed from Azerbaijan province (the west North of Iran) was chosen. The Hulls of sunflower seeds were separated by milling and shelling. Anthocyanin compounds extracted from the sunflower seed hulls are used as natural dyes (SFSH). Pre-scoured wool pile yarn 20 Metric, Alum mordant (KAl(SO4)2.12H2O), acetic,
oxalic , Ascorbic, chloridric and lactic acid were laboratory reagent grades from Merk, Germany.
Dyeing was performed using a liquor ratio of 1:40. Dyeing for the first group of woolen yarns started at 40 ºC and then the temperature was raised to boiling temperature in open beakers with manual agitation of the material
I
Evaluation of Color Sensitivity to Dyeing Parameters in
Natural Dyeing with Anthocyanin
which continued for 1 hour. The second group of woolen yarns dyed at 65 ºC for 2 hours and the third group dyed at room temperature for 3 hours.
The wet woolen yarns were put in the boiled dye solution containing acid and alum mordant. Adjustment of pH was made with different acids. Dyeing method was followed as a meta-mordating procedure. The detailed dyeing procedure is given in literature [10]. At the end of the dyeing period at about 90 ºC, the bath was cooled down to approximately 60 ºC and then the woolen yarns were washed with detergents and rinsed. The constitution of dyeing bath is explained in the Table I.
A. Colour Strength
Relative color strengths (K/S values) were determined using the Kubelkae Munk equation; Eq. (1) [10].
2 (1 )
2
K R
S R
(1)
where R is the decimal fraction of the reflectance of dyed woolen yarn, K is the absorption coefficient, and S is the scattering coefficient. The L*, a*, b* were calculated for light source D65.
The relative color strength, Eq. (2), and color difference, Eq. (3), of dyed woolen yarn samples were obtained using following relationships:
%
100 Relative color strength
of different Acid or Temprature
K
of target sample S
K
S
(2)
2 2 2Color Difference E L a b (3)
where ∆𝐿 = L different acid or temprature – L target sample , ∆𝑎 = a* different acid or temprature – a* target sample, ∆𝑏= b* different acid or temprature – b* target sample
; L describes lightness (100 for white, 0 for black), a
measures redness (+), greenness (-) and b measures yellowness (+), blueness (-).
* h * (tan 1)
b*
a
Reflectance of dyed samples
(4
* ( *2 * )2Dye saturation C SQRT a b (5)
B. Fastness Testing
The dyed woolen yarns were tested according to ISO standard methods. The specific tests were as follows: ISO C02 (1989), color fastness to washing and ISO 105-B02 (1988), color fastness to light (xenon arc) [11].
III.RESULTS AND DISCUSSION A. Effect of Temperature and pH
The effect of temperature on the dye ability of wool yarns with SFSH colorants was investigated at different temperatures. The effect of dye bath temperature on the dyeing quality of wool by SFSH extract was studied in the range of 25–90 ºC. This quality was evaluated by measuring the color yield (K/S) and the CIELab (L*, a*, b*) parameters. The results of this study are presented in Table II.
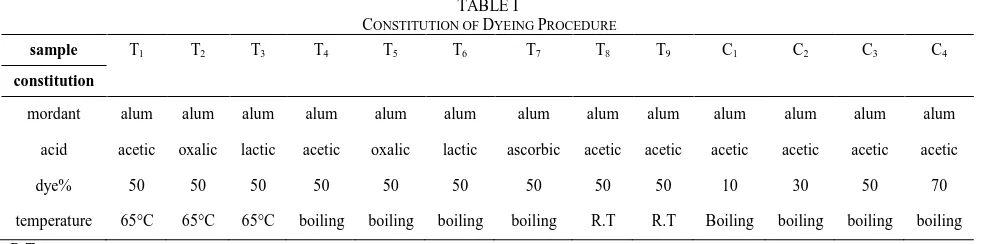
The pH of the dyeing bath varied from 2 to 5. The effect TABLE I
CONSTITUTION OF DYEING PROCEDURE
sample T1 T2 T3 T4 T5 T6 T7 T8 T9 C1 C2 C3 C4
constitution
mordant alum alum alum alum alum alum alum alum alum alum alum alum alum acid acetic oxalic lactic acetic oxalic lactic ascorbic acetic acetic acetic acetic acetic acetic
dye% 50 50 50 50 50 50 50 50 50 10 30 50 70
temperature 65°C 65°C 65°C boiling boiling boiling boiling R.T R.T Boiling boiling boiling boiling R.T: room temperature
TABLE II
EFFECT OF DYEING TEMPERATURE AND DYEING BATH pH ON COLORIMETRIC VALUES
R% max λ* max
(nm) K/S
CIEL*a*b*system
dye conc. % acid conc.%
T(°C) sample
b* a*
L*
53 580
0.21 7.04
-1.12 55.1
50% AC 4%
65 °C T1
48 540
0.30 5.18
0.31 46.1
50% OG4%
65 °C T2
49
-0.26 7.63
5.91 49.2
50% LA4%
65 °C T3
48 580
0.28 2.89
-1.54 48.8
50% AC 4%
boiling T4
36 580
0.56 2.96
-2.10 37.3
50% OG 4%
boiling T5
39 540
0.50 4.35
4.00 42.0
50% LA 4%
boiling T6
40 560
0.45 4.51
2.73 41.7
50% AS 3%
of this variation on the evolution of color yield (K/S) and CIELab coordinates are reported in Table II too.
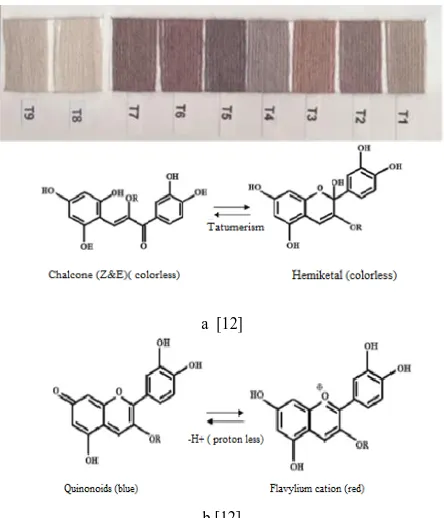
This table clearly indicates that the color yield values are increased with the increase of the dyeing temperature and its maximum value is reached at boiling temperature. Also as shown in Table II, the color strength improves with the increase in dyeing temperature and reaches a maximum value at boiling temperature. It seems that at room temperature there was no considerable dye adsorption by woolen yarn dyed with SFSH even though mordant had been used, and the woolen yarns were colorless and color of anthocyanin pigment did not observe on the woolen yarns; Fig. 2(a). It is concluded that the SFSH chemical structure at low temperature is in the hemiketal and chaltone form which is colorless as shown in Fig. 2(a).
The relative color strength and color difference of samples compared to sample 4 (target sample) is shown in Table III.
TABLE III
RELATIVE COLOR STRENGTH (K/SRATIO) AND COLOR DIFFERENCES IN THE WOOLEN YARN DYED BY DIFFERENT CONCENTRATION OF SFSH sample (t) T4 -T1 T4-T2 T4-T3 T4-T5 T4-T6 T4-T7
color difference
(E)
7.56 3.8 8.8 11.36 9.02 8.5 K/S ratio 74.5% 104% 94.6% 202% 176% 160% target sample: T4
The results show that the difference of sample T5 in both
studied parameters is much more than others. Low dyeing bath pH and boiling temperature result in darkest color and highest value of color strength. Furthermore, the color depth of all samples changed to yellowish and reddish hue as indicated by the values of a* and b* in similar samples by decreasing the dyeing temperature. While against pH effect, less reddish and yellowish hue has been indicated at boiling temperature. It seems that the temperature has no bathochromic effect.
Fig. 2 shows that the pH values have a considerable effect on the shades of wool yarns when the SFSH extracted dye is used. The effect of the dye bath pH can be attributed to the correlation between dye structure and wool yarns. Since anthocyanin is sparingly soluble in water and it contains OH groups, it would interact ionically with the protonated terminal amino groups of wool at acidic pH via ion exchange reaction due to the acidic character of OH groups. The anion of the dye molecule has a complex character, and when it is bound on the fiber with ionic forces, this ionic attraction has a synergism effect and dye-ability of fiber would be increased, as is clearly observed from Table 2. Also it is followed by the effect of dye concentration which is explained in the next part.
As shown in Table II , dye strength is higher at pH<4. Then the dye-ability decreases at pH values higher than 5 due to the variation of protonated number of terminal amino groups of wool fibers, and therefore the ionic interaction decreases.
The data of Table II reveals that the color yield value (K/S) increased with decrease in the dyeing bath pH. However, the luminosity L* decreased. In the case of a*
and b*parameters, it appears that these two parameters are more sensitive; whatever the pH of the dyeing bath is. The highest (K/S) value was obtained in the presence of oxalic acid. The PK1 value of oxalic acid is 5.35×10⁻² while for
lactic acid, acetic acid and citric acid PK1 values
respectively are 1.37×10⁻⁴, 1.75×10⁻⁵, and 7.45×10⁻⁴. The ability of different acids in ionization of wool results in different colors.
a [12]
b [12]
Fig. 2. Different Structural transformation of anthocyanin with change of dyeing affected by pH and Temperature.
chalcone form in either Cis or Trans configuration. The shade of the samples is violet reddish.
The efficiency of anthocyanins is greater at higher temperatures and also at higher dye concentrations [3,7].
The “typical absorption band” for anthocyanins is in 490 to 550 nm region of the visible spectrum [17,18]. The results of λmax affected by dyeing bath pH and temperature are indicated in the Table II. Sample T6 with more
anthocyanin value shows a λmaxnear to 540 nm. The dye solutions were applied without pH adjustment to avoid precipitation of dye lakes at higher pH. When diluted HCl is used to dissolve the dyestuff, higher redness value were obtained in comparison to the results obtained by using oxalic acid. Application of HCl caused this sample to degrade and colorimetric measurements could not be carried out. This indicates that further research and improvement is required to optimize the dyeing bath pH.
According to the dyeing reference procedure (sample T4), the CIEL*a*b* coordinates of dyeing with use of
SFSH indicated more brilliant colors, especially the higher b* coordinate was observed where dyeing temperature was low.
The lightness (L*) value of dyed samples at lower pH was more than that of the dyed samples with weak acidic condition. This is attributed to the higher value of color strength. Furthermore, the color depth of all samples was much bluish and less reddish as indicated by the values of
a* and b*, and more quinoidal form of anthocyanin was
present in the dyeing bath. B. Effect of Dye Concentration
The dyeing procedure was presented by different concentration of SFSH dyes. The colorimetric parameters L*, a* and b* of the dyed samples are shown in Table IV.
The results proved that for samples dyed with SFSH dyes, a* and b* value increased as the dye concentration was increased.
Fig. 3 shows a clear trend for a given set of meta-mordanting conditions. The increase in the SFSH dye percentage (from 10 to 50%) is accompanied by a gradual increase in the K/S values of dyed samples (from 0.14 up to 0.34), which could be ascribed to the greater availability and accessibility of dye molecules onto and/or within the vicinity of the meta-mordanted substrate, thereby enhancing the extent of dye absorption, and helping the dye interaction or fixation with the mordanted wool fibers, i.e. higher color strength.
It is also evident (Fig. 4) that increasing the dye concentration, like decreasing the dyeing bath pH, results
in an increase in the K/S value, and hence dark shades will be obtained.
Fig. 3. Effect of dye concentration on the color of woolen yarn.
Fig. 4. Relationship between dye concentration (%) and dyeing bath pH on the color strength of woolen yarn dyed with SFSH.
The results of absorbance and K/S values in Table III confirm that the maximum absorption value is attained with 50% of SFSH. As expected, the results show that an increase in the dye percentage leads to higher absorbance. Also dyeing of woolen yarns with higher concentration showed higher b* coordinate and higher brilliance compared to target sample (T4 or C3). In the reference
sample the low dye strength value resulted from low tendency of dye. It seems that the driving force for transferring a dye molecule from one phase to another, i.e., from dye bath to the fiber or the reverse, depends on the concentration gradient of the dye between the two phases, therefore more dye molecules are transferred to the fabric [12]. A higher apparent depth of color occurs when the dye bath concentration is increased, but increasing the dye concentration to more than 50 % has a reversible trend. With higher dye concentration, there is no considerable change in the absorbance. Moreover, as Fig. 3 shows, by increasing the dye concentration to 70% , a decrease in the dye absorption is observed. It can be explained by the dye saturation value which is around 50% of SFSH. This indicates that a level of saturation in dye uptake already is achieved at a color depth of 50 of SFSH dye.
0 10 20 30 40 50 60 70
0 0.2 0.4 0.6 0.8 1
%
D
y
e
pH
K/S
pH %Dye C4
C2 C1
C
1C4
C2
C3 TABLE IV
EFFECT OF DYE CONCENTRATION OF SFSH ON COLORIMETRIC VALUES
E Samples(,) E
R max % λ* max
(nm) K/S
CIEL*a*b*system dye
conc.% acid
conc.% sample
b* a*
L*
(C1,C3) 18.1 1,3
18.1 59
580 0.14
4.85 -1.33
62.45 10%
AC 4% C1
(C2,C3) 7.22 2,3
7.22 50
580 0.25
2.27 -1.56
51.40 30%
AC 4% C2
-45 580
0.34 2.81
-0.52 44.23
50% AC 4%
C3
(C4,C3) 13.36 4,3
13.36 55
580 0.19
8.81 -1.34
56.20 70%
The results showed that for dyed samples, greenness (negative a*) and bluish lower b* were increased as the dye concentration was increased to 50% of the weight of fiber.
By increasing the dye concentration, the h parameter increases while the C* decreases. The values of h and C* are calculated via Eqs. (4) and (5). As Fig. 5 shows additional dye concentration after 50% causes the dye strength and h parameter both to decrease.
Fig. 5. Relationship between h and C* on the color strength of woolen yarn dyed with different concentration of SFSH.
Also as Fig. 6 shows, λmax is constant for all dye concentrations while the color strength has a maximum value for samples dyed with 50% of SFSH. Dye concentration does not affect the λmaxposition.
Fig. 6. Effect of dye concentration on the K/S values of the obtained dyeing (1: 10%, 2: 30%, 3: 50%, 4: 70% of SSH).
C. Fastness Properties
Tables V and VI summarizes the data on fastness properties of the dyed woolen yarn by SFSH.
TABLE V
VARIOUS COLOR FASTNESS OF WOOLEN YARN DYED WITH SFSH; EFFECT OF DYEING TEMPERATURE AND PH
stain on wool stain on cotton washing fastness light fastness sample 4-5 5 5 3 T1 5 5 4 3 T2 3-4 5 4 3 T3 5 3-4 4 3 T4 4 4 4 3 T5 3-4 3-4 4 3 T6 3-4 3-4 3 3 T7 TABLE VI
VARIOUS COLOR FASTNESS OF WOOLEN YARN DYED WITH SFSH, EFFECT OF DYE CONCENTRATION
stain on wool stain on cotton washing fastness light fastness sample 5 5 4 3 C1 5 5 4 3 C2 5 4 4 3 C3 4-5 5 5 3 C4
Besides the change in color, the bleeding onto accompanying woolen and cotton yarn is also shown in Tables V and VI. The results indicate good fastness properties of the dyed samples normally. Washing and staining fastness value changes between 3 and 5. The light fastness value of samples was moderate, around Rating 3.
IV.CONCLUSION
It is concluded that Anthocyanin pigments can be obtained easily from purple sunflower seed hulls (SFSH) in relatively large quantities for dyeing woolen yarns.
This paper focuses on purple sunflower hulls that have practical potential as a source of anthocyanins to be used as textile dyeing with good fastness properties and high dye uptake. They can serve as a noteworthy source of raw material in the future.
As can be seen the obtained colors vary from yellowish blue (pH>4) dye and alum mordant) to reddish violet (pH<3). And also colorless samples were obtained in RT dyeing. Dyeing on woolen yarn showed acceptable fastness to water for all.
The considerable variation in the absorbance of SFSH dye in different dyeing temperature and pH prove that more research is needed to answer the questions.
Acknowledgements
This work was supported by Art University of Tehran.
REFERENCES [1] P. S. Devi, M. S. Kumar, and S. Mohandas ,“ The effects of
temperature and pH on stability of anthocyanins from red sorghum (Sorghum bicolor) bran”, Afr. J. Food Sci., vol. 6 no. 24, pp. 567-573, 2012.
[2] Q. Zhao, C-Q. Duan, and J. Wang, “Anthocyanins profile of grape berries of Vitis amurensis, its hybrids and their wines”, Int. J. Mol. Sci. vol. 11, pp. 2212–2228, 2010.
[3] G. Mazza and R. Brouillard, “Color stability and structural transformations of cyanidin 3, 5-diglucoside and four 3-deoxyanthocyanins in aqueous solutions”, J. Agric. Food Chem. vol. 35, pp. 422–426, 1987.
[4] F. He, Na-Na. Liang, Lin Mu, Q-H. Pan, J. Wang, M. J. Reeves, and C-Q. Duan, “Anthocyanins and their variation in red wines I. monomeric anthocyanins and their color expression”, Molecules17, pp.1571-1601, 2012.
[5] The statistical portal , spectral database, available: https://www.statista.com/ statistics/267271/worldwide-oilseed-production-since-2008/
[6] G. P. Nabhan, “Sunflower of Indians of the southwest”, The
Sunflower, pp.30-32,1982.
[7] S. Kobayashi and K. Yamauchi, “Dyeing in red with Anthocyan.”,
J. Home Econ. Japan, vol.49, no.3, pp. 295–301,1998.
[8] T. Bechtoldt , R. Mussak, A. Mahmud-Ali, E.Ganglberger, and S. Geissler, Extraction of natural dyes for textile dyeing from coloured plant wastes released from the food and beverage industry, J. Sci. Food Agric., vol. 86, pp. 233-242, 2006.
[9] T. Bechtold, A. Mahmud-Ali and R. Mussak, “Anthocyanin dyes extracted from grape pomace for the purpose of textile dyeing”, J.
Sci. Food Agric., vol. 87, no. 14, pp. 2589–2595, 2007.
[10] Z. Ahmadi and N. Shayegh broujeni, “Effectual parameters on the natural dyeing process”, J. Text. polym., vol.1, no.3, pp. 15-18, 2013.
[11] AATCC, AATCC Technical Manual, Vol.75. American Association of Textile Chemists and Colorists, Research Triangle Park, NC, 2000.
[12] Z. Ahmadi and F. Gholami, “Evaluation of effectual parameters in the natural dyeing of woolen yarns with sunflower seed hulls”, Academic Dissertation, University of Art Tehran, winter 2015. 0 2 4 6 8 10
0 1 2 3 4 5
C* h K/S h C* C4 C2 C1 C1
C4 C 2
C3
C3
400 450 500 550 600 650 700
[13] Z. Ahmadi, F. Gholami, and M. Aftabi, “Different behavior of some natural dyes in the wool dyeing process”, proceeding of 12th ATC, China Shanghai, 22-24 October, 2013.
[14] M. Rein, “Co-pigmentation reactions and color stability of berry anthocyanins”, Academic Dissertation, University of Helsinki, 2005.
[15] W. Routray and V. Orsat, “Blueberries and their anthocyanins: factors affecting biosynthesis and properties”, Comp. Rev. Food
Sci. Food Safety, vol. 10, pp. 303-320, 2011.
[16] R. L. Prior, S. A. Lazarus, G. Cao, H. Muccitelli, and J. F. Hammerstone, “Identification of procyanidins and anthocyanins in
blueberries and cranberries (vaccinium Spp.) using high-performance liquid chromatography/mass spectrometry”, J. Agric.
Food Chem, vol.49, no.3, pp. 1270–1276, 2001.
[17] R. Khanal, L. Howard, and R. Prior, “Effect of heating on the stability of grape and blueberry pomace procyanidins and total anthocyanins”, Food Res. Int. vol. 43, no. 5, pp. 1464–1469, 2010. [18] R. E. Wrolstad, T. E. Acree, E. A. Decker, M. H. Penner, D. S.
Reid , S. J. Schwartz, C. F. Shoemaker, D. M. Smith, and P. Sporns,“ Handbook of food analytical chemistry-pigments,
colorants, flavors, texture, and bioactive food components”, John
![Fig. 1. Schematic chemical structure of anthocyanin [3].](https://thumb-us.123doks.com/thumbv2/123dok_us/8953008.1862376/1.595.371.499.435.524/fig-schematic-chemical-structure-anthocyanin.webp)