Modelling of Thrust Forces in Drilling of AISI 316 Stainless Steel
Using Artificial Neural Network and Multiple Regression Analysis
Çiçek, A. − Kıvak, T. − Samtaş, G. − Çay, Y.
Adem Çiçek1− Turgay Kıvak2− Gürcan Samtaş2,*− Yusuf Çay3 1 Düzce University, Faculty of Technology, Turkey
2 Düzce University, Cumayeri Vocational School of Higher Education, Turkey 3 Karabük University, Faculty of Engineering, Turkey
In this study, the effects of cutting parameters (i.e., cutting speed, feed rate) and deep cryogenic treatment on thrust force (Ff) have been investigated in the drilling of AISI 316 stainless steel. To observe the effects of deep cryogenic treatment on thrust forces, M35 HSS twist drills were cryogenically treated at –196 °C for 24 h and tempered at 200 °C for 2 h after conventional heat treatment. The experimental results showed that the lowest thrust forces were measured with the cryogenically treated and tempered drills. In addition, artificial neural networks (ANNs) and multiple regression analysis were used to model the thrust force. The scaled conjugate gradient (SCG) learning algorithm with the logistic sigmoid transfer function was used to train and test the ANNs. The ANN results showed that the SCG learning algorithm with five neurons in the hidden layer produced the coefficient of determinations (R2) of 0.999907 and 0.999871 for the training and testing data, respectively. In addition, the root mean square error (RMSE) was 0.00769 and 0.009066, and the mean error percentage (MEP) was 0.725947 and 0.930127 for the training and testing data, respectively.
Keywords: artificial neural networks, regression analysis, cryogenic treatment, machining, thrust force, predictive modelling
0 INTRODUCTION
In recent years, applying different heat treatments to tool steels has been widely executed in order to increase productivity [1]. Specifically, cryogenic treatment has proved for many years to be an effective method to improve tool life and to eliminate residual stress [2] and [3]. Cryogenic treatment is a supplementary process to conventional heat treatments and is a permanent procedure that affects the entire material, unlike hard coatings [4] and [5]. In addition, cryogenic treatment increases the wear resistance of materials by providing a more intensive and homogeneous distribution of carbides due to transformation of the retained austenite into martensite [6]. The cryogenic treatment significantly increases the lifetime of the HSS cutting tools. The improvements in tool life vary from 65 to 343% depending on the cutting conditions used [7].
One of the most important factors in manufacturing costs is energy consumption. Specifically, the power consumed during machining determines the energy consumption. Depending on the specific cutting resistance of the material, the thrust force which determines the consumed power and the energy cost are the most important parameters in the cutting process. A large number of parameters influence the cutting forces, including cutting speed, feed rate, depth of cut, rake angle, nose radius, cutting edge inclination angle, physical and chemical characteristics of the machined part, and chip breaker geometry. Therefore, developing a proper cutting force analytical model is very difficult [8]. Several
the abductive network, regression analysis was used to develop a second prediction model. The comparison of the two models indicated that the abductive network prediction model was more accurate than the one developed using regression analysis.
The objectives of this study are to determine the effects of three different heat treatments and cutting parameters on the thrust force in drilling of AISI 316 stainless steel, and to predict the thrust force using multiple regression analysis and ANNs, without the need for complex and time-consuming experimental studies.
1 EXPERIMENTAL DETAIL
In this study, AISI 316 austenitic stainless steel blocks were used as the workpiece material. The dimensions of this workpiece material were 100×170×15 mm. The chemical composition of AISI 316 austenitic stainless steel is given in Table 1.
Table 1. The chemical composition of AISI 316 stainless steel
C Si Mn P S Cr Ni Mo Cu
0.05 0.380 0.971 0.039 0.006 16.58 9.94 2.156 0.321
The drilling tests were performed using a Johnford VMC 850 model CNC vertical machine centre at four cutting speeds (V, 12, 14, 16, and 18 m/min) and three feed rates (f, 0.08, 0.1, and 0.12 mm/rev). Blind holes were drilled at a constant depth of the cut (13 mm). In the experiments, uncoated M35 HSS (DIN 1897) twist drills were used. Three holes were drilled to confirm the results in each machining condition. A number of drills (Guhring) with a diameter of 6 mm were cryogenically treated in order to observe the effects of deep cryogenic treatment. Three types of uncoated drills (Ct) were used: conventionally heat-treated drills (CHT), cryogenically heat-treated drills (CT), and cryogenically treated and 2h tempered drills (CTT) at 200 °C. The cryogenic treatment for the M35 HSS drills was performed by gradually lowering the temperature from room temperature to ‒196 °C at approximately 1.5 °C/min. This minimum cryogenic temperature was held for 24 h, and then raised back to room temperature at the same rate. Before the experiments, the stainless steel blocks were ground to eliminate the adverse effects of any surface defect on the workpiece. During the drilling tests, thrust force values were measured by the Kistler 9257B type dynamometer. 36 experiments were performed at all combinations of cutting speeds, feed rates, and heat treatments applied to the cutting tools.
1.1 Artificial Neural Networks
ANNs can be successfully applied to many industrial situations. ANNs are suitable for modelling various manufacturing functions because of their ability to easily learn complex non-linear and multivariable relationships between process parameters [15] to [17]. An ANN consists of three main layers, namely input, hidden, and output layers. The neurons in the input layer transfer data from the external world into the hidden layer. In the hidden layer, outputs are produced using data from the input layer, using bias, summation, and activation functions. The summation function calculates the net input of the cell, as shown in Eq. 1:
NETi w xij j wbi j
n
= +
=
∑
1, (1)
where NETi is the weighted sum of the input to
the ith processing element, wij is the weight of the connections between the ith and jth processing elements, xj is the output of the jth processing element,
and wbi is the weight of the biases between layers.
The activation function provides a curvilinear match between input and output layers. In addition, it determines the output of the cell by processing the net input to the cell. The selection of an appropriate activation function significantly affects network performance. Recently, the logistic sigmoid transfer function has been commonly used as an activation function in multilayer perception models, because it is a differentiable, continuous, and non-linear function. For this reason, the logistic sigmoid transfer function was used as the activation function in this study. This function produces a value between 0 and 1 for each value of the net input. The logistic sigmoid function in this study is shown in Eq. 2.
f NET
e
i NETi
( )= .
+ −
1
1 (2)
numbers of neurons in the hidden layer were used in the built network structure for thrust force. In consequence of trials, the best learning algorithm and network architecture for the prediction of thrust force became SCG: 3-5-1, respectively (Fig. 1).
Fig. 1. ANNs architecture with a single hidden layer
As mentioned above, the logistic sigmoid transfer function was used in this study. One of the characteristics of this function is that only a value between 0 and 1 can be produced. Thus, the input and output data sets were normalised before the training and testing processes. In this study, the input and output values were normalised between 0.1 and 0.9 to obtain optimal predictions. The cutting tool, cutting speed, and thrust force data were normalised by dividing by 6, 60, and 950, respectively. Feed rate was also normalised by multiplying by 4. The cutting tool digits for the ANN were determined to be CHT = 1, CT = 2, and CTT= 3 since they do not have numerical values. In order to understand whether an ANN is making good predictions, thrust force values
predicted after ANN training were compared with the values obtained from experimental study. RMSE (root mean square error), R2 (determination coefficient), and MEP (mean error percentage) values were used for comparison. These values were calculated with the following equations:
RMSE
p t oj j
j =
−
1
∑
21 2/
, (3)
R j t o
j o
j j
j
2
2
2 1
= −
(
−)
( )
∑
∑
, (4)MEP
j t o
t p
j j
j
% ,
( )
=−
×
∑
100(5)
where t is the goal value, o is the output value, and p is the number of samples.
2 DISCUSSION AND RESULTS
2.1 The Effects of Heat Treatments and Cutting Parameters on the Thrust Forces
The variations in thrust force depending on the heat treatment, feed rate and cutting speed in are shown in Fig. 2. As shown in Fig. 2, the thrust force substantially increases with increasing feed rate because the shear area is elevated. In contrast, the thrust force was not considerably affected by the cutting speed within the
tested cutting range. With increasing cutting speed, the thrust forces for the three different tools decreased until 16 m/min, but slightly increased after this cutting speed. This decrease is due to the softening effect of the work piece at higher cutting speeds. The thrust forces for the CT and CTT drills were less than the CHT drill. This can be attributed to the lower wear rate, lower temperature of the tool tip, and less distortion of the cutting edge of the CT and CTT drills in comparison with the CHT drill during the drilling process [18].
Table 2. Experimental results
Cutting speed
Feed rate
Cutting tools
CHT CT CTT
1 2 3
Thrust force Thrust force Thrust force
12 0.08 680 662 641
14 0.08 662 645 634
16 0.08 660 640 628
18 0.08 668 635 632
12 0.1 770 765 757
14 0.1 765 757 742
16 0.1 756 752 737
18 0.1 767 761 749
12 0.12 894 855 846
14 0.12 871 847 836
16 0.12 867 844 839
18 0.12 870 848 842
The uniform distribution of carbide particles, the refinement of small particles, the precipitation of secondary carbides, and the improved toughness led to the CTT drill having the lowest thrust force [2]. The thrust force was also predicted by ANNs and multiple regression analysis, and their affects and reliability were evaluated using statistical methods. The thrust forces measured in the experiments are given in Table 2. The effects of three different cutting tools, cutting speed, and feed rate on the thrust force measured during the drilling experiments were analysed by ANOVA (Analysis of Variance).
2.2 Prediction of Thrust Forces with Multiple Regression Analysis
Regression analysis is a statistical tool for evaluating the relationship of one or more independent variables (x1, x2 ,…, xk) to a single, continuous dependent
variable (y). This analysis is most often used when the independent variables cannot be controlled, for example, when they are collected in a sample survey or other observational study. As with straight-line regression, an ANOVA table can be used to provide an overall summary of a multiple regression analysis. The particular form of an ANOVA table may vary, depending on how the contributions of the independent variables are considered. A simple form reflects a contribution in which all independent variables are considered collectively in order to make the prediction [19]. The analysis of the variance shows that the cutting tools, cutting speed, and feed rate affect the thrust forces within the experimental limits. The obtained ANOVA results are given in Table 3.
As shown in Table 3, the feed rate is the most significant factor affecting the thrust force (97.08%). This factor is followed by the cutting tools (1.91%) and the cutting speed (0.23%). The experimental results are evaluated by regression analysis for a significance level of 5% (or 95% confidence level), and regression analysis results are shown in Fig. 3. The mathematical statements established with multiple regression analysis for the thrust force are given in Eq. (6). The coefficient of determination (R2) of the equation was calculated as 0.992:
Ff =294 861 14 458. − . Ct−1 833. V+5150f, (6)
where Ff is the thrust force [N], Ct is the cutting tool,
V is cutting speed [m/min], and f is the feed rate [mm/ rev]. According to the obtained mathematical model, it was observed that there was a linear relationship between cutting tools, cutting speed, and feed rate with the thrust force.
Table 3. Analysis of variance for thrust force
Source Degrees of freedom Sum of square Mean square F value Pr > F Contribution %
Model 3 260238.04 86746 1380.449 <.0001
-Cutting Tools 1 5017.04 5.017 79.8396 <.0001 1.91
Cutting Speed 1 605 605 9.6278 0.0040 0.23
Feed rate 1 254616 254616 4051.880 <.0001 97.08
Error 32 2010.85 62.8 <.0001 - 0.78
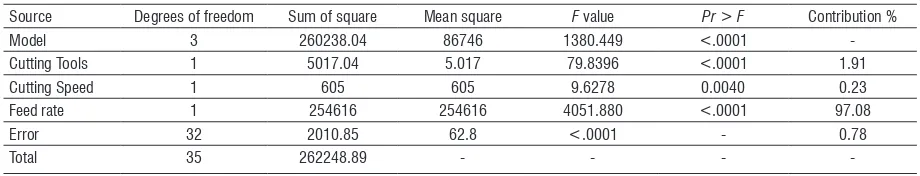
-a)
b)
c)
Fig. 4. Comparison of the actual and predicted thrust forces; a) 0.08 mm/rev, b) 0.1 mm/rev, c) 0.12 mm/rev
A comparison of the experimental and thrust forces predicted by the multiple regression method is shown in Fig. 4. It was found that the values predicted by the multiple regression method at the feed rates of 0.08 and 0.12 mm/rev were more convergent than the predicted values at 0.1 mm/rev as shown in Fig. 4. This indicates that the effect of the 0.1 mm/rev feed rate in the regression model is less than the other feed rates.
2.3 Prediction of Thrust Forces with ANNs
The training and testing data sets were prepared using the experimental data. In this study, 36 patterns were obtained from the drilling experiments. Among them, 9 patterns were randomly selected and used as the testing data. Cutting speed, feed rate, and cutting tools were used in the input layer, while the thrust force was used in the output layer of the ANN. To obtain accurate results, a single hidden layer with five neurons was used. Table 4 shows the statistical evaluation of results of the ANN with five neurons.
The equation of the thrust force is given in Eq. (7). Also, the thrust force can be accurately calculated by the following formula:
Ff
e F F F F F =
+ − × + × + × − × + × +
1
1 3 2694. 1 3 0517. 2 3 7990. 3 7 7062. 4 0 0511. 5 00 9165
950
.
,
( )
×
× (7)
where Fi (i = 1, 2, ..., 4 or 5) can be calculated
according to Eq. (8):
F e
i = + −Ei
1
1 , (8)
where Ei is the weighted sum of the inputs, and is calculated using the equation in Table 3. The data flow is completed with the weights among the layers. The weight values input and hidden layer are given in Table 5.
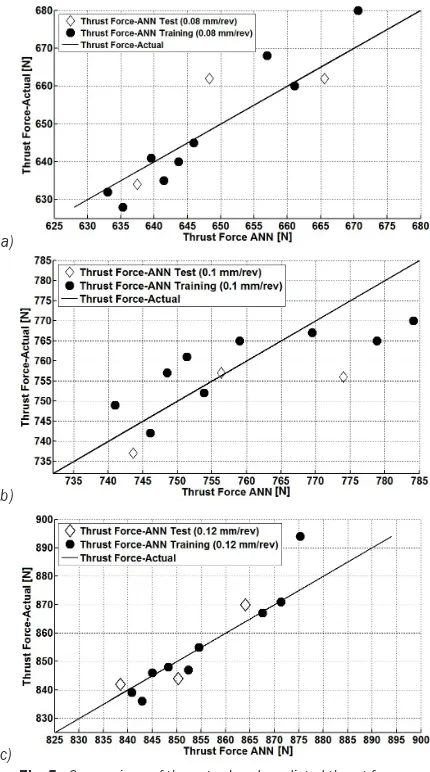
a)
b)
c)
Fig. 5. Comparison of the actual and predicted thrust forces; a) 0.08 mm/rev, b) 0.1 mm/rev, c) 0.12 mm/rev
After the training and testing stages, the R2 value for the training data was 0.999907, while the R2 value for the testing data was 0.999871. The RMSE values for the training and testing data were respectively 0.00769 and 0.009066, and the mean error values were 0.725947 and 0.930127, respectively. Therefore,
the thrust force values were accurately predicted by the ANN. Fig. 5 shows a comparison of the actual and the predicted thrust force values by the ANN.
Table 5. The weights between the input and hidden layers Ei = w1x(Ct/6) + w2x(V/60) + w3x(fx4) + θi
i w1 w2 w3 θi
1 -6.7500 -4.4407 -6.8930 11.7137
2 -2.3814 -6.5059 -4.7796 11.8331
3 -9.1133 -4.9393 6.0572 -2.7930
4 0.0480 0.1832 -6.4262 3.7340
5 3.3620 -8.5526 -2.2916 8.9342
3 CONCLUSIONS
In this study, multiple regression and ANN approaches were used to predict the thrust forces in the drilling of AISI 316 stainless steel blocks. The best results were obtained using the SCG algorithm and a network with five hidden neurons. The developed models were evaluated in terms of their prediction capability. In general, the predicted values were found to be close to the experimental values. The proposed models can thus be used effectively to predict the thrust force in such drilling process. The R2 was found to be 0.999 for both the training and testing data in the ANN, while it was 0.992 for the multiple regression analysis. Both methods are suitable for the prediction of the thrust forces within acceptable error limits. In addition, the relationship between cutting parameters and thrust force can be determined by using the ANN. Therefore, the usage of ANNs is highly recommended for the prediction of the thrust force instead of complex and time-consuming experimental studies.
4 REFERENCES
[1] Simranpreet, G.S., Rupinder, S., Harpreet, S., Jagdev, S. (2009). Wear behaviour of cryogenically treated tungsten carbide inserts under dry and wet turning conditions. International Journal of Machine Tools & Manufacture, vol. 49, no. 3-4, p. 256-260, DOI:10.1016/j.ijmachtools.2008.11.001.
[2] Firouzdor, V., Nejati, F., Khomamizadeh, E. (2008). Effect of deep cryogenic treatment on wear resistance and tool life of M2 HSS drill. Journal of Materials Processing Technology, vol. 206, no. 1-3, p. 467-472, DOI:10.1016/j.jmatprotec.2007.12.072.
Table 4. Statistical evaluation for the thrust force
Goal algorithmLearning Number of neurons Training data Testing data
RMSE R2 MEP RMSE R2 MEP
[3] Sweeney Jr., T.P. (1986). Deep cryogenics: the great cold debate. Heat Treating, p. 28-32.
[4] Smolnikov, E.A., Kossovich, G.A. (1980). Cold treatment of cutting tools., All-Union Scientific-Research Tool Institute, vol. 10, p. 5-7. (in English) [5] Wilkins, C. (1999). Cryogenic processing; the big chill.
Electrical Discharge Machining Today, p. 36-44. [6] Huang, J.Y., Zhu, Y.T., Liao, X.Z., Beyerlein, I.J.,
Bourke, M.A., Mitchell, T.E. (2003). Microstructure of cryogenic treated M2 tool steel. Materials Science and Engineering A, vol. 339, No. 1-2, p. 241-244, DOI:10.1016/S0921-5093(02)00165-X.
[7] Da Silva, F.J., Franco, D.D., Machado, A.R., Ezugwu, A.R., Souza Jr.A.M. (2006). Performance of cryogenically treated HSS tools. Wear, vol. 261, p. 674-685, DOI:10.1016/j.wear.2006.01.017.
[8] Tamas, S. (1999). Cutting force modeling using artificial neural networks. Journal of Materials Processing Technology, vol. 92-93, p. 344-349, DOI:10.1016/S0924-0136(99)00183-1.
[9] Hao, W., Zhu, X., Li, X., Turyagyenda, G. (2006). Prediction of cutting force for self-propelled rotary tool using artificial neural networks. Journal of Materials Processing Technology, vol. 180, p. 23-29, DOI:10.1016/j.jmatprotec.2006.04.123.
[10] Özel, T., Karpat, Y. (2005). Predictive modeling of surface roughness and tool wearing hard turning using regression and neural networks. International Journal of Machine Tools and Manufacture, vol. 45, no. 4-5, p. 467-479, DOI:10.1016/j.ijmachtools.2004.09.007. [11] Panda, S.S., Chakraborty, D., Pal, S.K. (2007).
Monitoring of drill flank wear using fuzzy back-propagation neural network. International Journal Advanced Man ufacturing Technology, vol. 34, no. 3-4, p. 227-235, DOI:10.1007/s00170-006-0589-0.
[12] Asiltürk, I., Çunkas, M. (2010). Modeling and prediction of surface roughness in turning operations using artificial neural network and multiple regression
method. Expert Systems with Applications, vol. 38, no. 5, p. 5826-5832.
[13] Nalbant, M., Gökkaya, H., Toktaş, İ., Sur, G. (2009). The experimental investigation of the effects of uncoated, PVD- and CVD-coated cemented carbide inserts and cutting parameters on surface roughness in CNC turning and its prediction using artificial neural networks. Robotics and Computer-Integrated Manufacturing, vol. 25, no. 1, p. 211-223, DOI:10.1016/j.rcim.2007.11.004.
[14] Lin, W.S., Lee, B.Y. (2001). Modeling the surface roughness and cutting forces during turning. Journal of Materials Processing Technology, vol. 108, no. 3, p. 286-93, DOI:10.1016/S0924-0136(00)00835-9. [15] Karayel, D. (2009). Prediction and control of surface
roughness in CNC lathe using artificial neural network. Journal of Materials Processing Technology, vol. 209, no. 7, p. 3125-3137, DOI:10.1016/j. jmatprotec.2008.07.023.
[16] Ibrikçi, T., Saçma S., Yıldırım, V., Koca, T. (2010). Application of artificial neural networks in the prediction of critical buckling loads of helical compression springs. Strojniški vestnik - Journal of Mechanical Engineering, vol.56, no. 6, p. 409-417. [17] Gonçalves, D.V., De Almeida, L.F., Mathias, M.H.
(2010). Wear particle classifier system based on an artificial neural network. Strojniški vestnik - Journal of Mechanical Engineering, vol. 56, no. 4 p. 284-288. [18] Sreerama Reddy, T.V., Sornakumar, T.,
VenkataramaReddy, M., Venkatram, R. (2009). Machinability of C45 steel with deep cryogenic treated tungsten carbide cutting tool inserts. International Journal of Refractory Metals & Hard Materials, vol. 27, p. 181-185.