RESEARCH ARTICLE
---
*Corresponding author ():: [email protected]; [email protected]
Received: 26 March 2018/ Revised: 26 June 2018 Accepted: 27 June 2018
Study of genetic variation of some Iranian rice (
Oryza
sativa
) genotypes based
on morphological traits, physicochemical properties and molecular markers
Aliakbar Babajanpour
1, Seyyed Hamidreza Hashemi-Petroudi
1*, Masoud Haghpanah
21 Genetic engineering and biology department, Genetics and Agricultural Biotechnology Institute of Tabarestan (GABIT), Sari
Agricultural Sciences and Natural Resources University (SANRU), Sari, Iran, P. O. Box 578
2Department of Biotechnology and Plant Breeding, Sari Agricultural Sciences and Natural Resources University, Sari, Iran
ABSTRACT: Assessment of genetic diversity and individual relationships in rice (Oryza sativa) germplasm collections seems to be necessary for future rice breeding program. In order to understand genetic relationshipsof 30 rice genotypes, nine morphological traits, seven physicochemical properties and twelve RAPD primers were used for study of 30 rice genotypes. Among morphological traits, number of unfilled grain, number of tiller, number of filled grain and plant height had the highest CV value that indicated the high range of genetic diversity for studied genotypes. Pairwise correlation of morphological traits and physicochemical properties showed plant height had a strong positive correlation with panicle length (r = 0.721, P< 0.0001). Also, ratio of white rice to paddy rice and milling ratio had a negative correlation with plant height and 1000-grain weight, respectively. Cluster analysis of physicochemical properties and morphological traits grouped all genotypes into three main clusters. A total of 105 obtained RAPD bands, a number of 35 bands were polymorphs which range 7 to 19 bands per primer. OPB-14 and OPH-12 primers shown that lowest and the highest number of bands per primers, respectively. Cluster analysis of molecular data based on UPGMA algorithm and Jaccard's similarity coefficient grouped 30 rice genotypes into three clusters. The findings of this study might provide valuable information about local rice cultivar relationships in terms of their genetic distance, and can be useful in rice breeding program.
KEYWORDS: Oryza sativa, Genetic variation, Morphological trait, Physicochemical property. RAPD
INTRODUCTION
Various estimates show that the world food production must be doubled by 2025 to meet the needs of 11 billion people (25). Considering the global climatic changes, this must be obtained on the smaller land area and with the less water resources (19). Rice (Oryza sativa) belongs to Poaceae family, and is one of the most important food sources worldwide (3). After bread wheat, rice has the second ranks of calories consumed in the human diet, and is served for over fifty percent of world’s population especially in Asia (3, 16).
2 J Plant Mol Breed (2018) 6(2): 1-9 to exploit the heterosis (hybrid vigor), especially in
commercial crops (4, 11). Generally, the first step towards crop improvement is rapid identification of germplasm, maintain and expand germplasm diversity in a short time (13, 14). In this view, the role of different morphological, physicochemical and molecular markers for genetic diversity assessment is undeniable. Genetic variation of different Iranian rice landraces has been studied using different morphological traits (6, 36, 37), physicochemical properties (22, 34) and molecular markers including isozymes (26), PCR-based RFLP (restriction fragment length polymorphism) (9), RAPD (random-amplified polymorphic DNA) (35), AFLP (amplified fragment length polymorphism) (1, 32), SSR (Simple sequence repeats) (2, 30, 32), and so on. However, the characterization of germplasm based on morphological and physicochemical traits is influenced by environmental conditions, but they are still considered as the initial prerequisites of many population genetic analyses such as mapping studies. In this view, the evaluation of genetic variation will be more appreciated if both molecular and non-molecular markers are utilized together (29). This research was conducted to study the genetic variation among different genotypes of Iranian rice genotypes using morphological traits, physicochemical properties and RAPD markers.
MATERIALS AND METHODS
Plant materials, field experiments, and traits evaluation
This study was conducted at the Genetic and Agricultural Biotechnology Institute of Tabarestan (GABIT), Sari Agricultural Sciences and Natural Resources University (SANRU), Sari, Iran (36°39'36''N latitude, 54°04'05''E longitude, -26 m altitude). The plant materials (30 cultivars) were obtained from Rice Research, Amol, Iran (Table 1). The seeds of collected samples were sown in an incomplete block design, lattice, with three replications. Each plot consisted of five rows of 2.0 m length with a plant spacing of 0.25 m in either direction. Standard agronomic practices were followed during crop growth period to minimize weed and insect damage in order to reach maximum grain yield. Any possible border effect was controlled by measuring the central three rows in each plot. The morphological traits including plant height, tiller number, panicle length, 1000-grain weight,
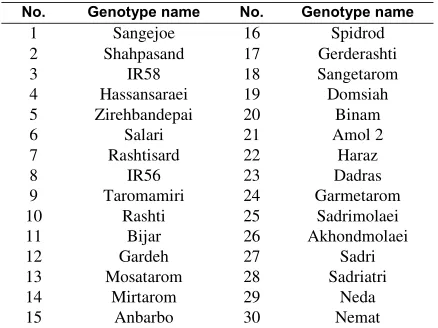
Table 1. Different rice genotypes used in this study.
No. Genotype name No. Genotype name
1 Sangejoe 16 Spidrod
2 Shahpasand Gerderashti17
3 IR58 Sangetarom18
4
Hassansaraei Domsiah19
5
Zirehbandepai 20 Binam
6 Salari 21 Amol 2
7 Rashtisard 22 Haraz
8 IR56 23 Dadras
9 Taromamiri Garmetarom24
10 Rashti Sadrimolaei25
11 Bijar Akhondmolaei26
12 27Gardeh Sadri
13
Mosatarom Sadriatri28
14
Mirtarom 29 Neda
15 Anbarbo 30 Nemat
grain length, grain width, grain length/width ratio, number of filled grain, number of unfilled grain were measured based on standard evaluation system (SES) (31). Physicochemical properties such as the milling ratio, ratio of white rice to paddy rice, head rice grain percentage, grain length after cook, elongation were measured based on SES. Gelatinization temperature (20) and amylose content (17) also were evaluated with minor modifications. All traits that distributed normally at least with one of normality tests (Shapiro-Wilk test, Anderson-Darling test, Lilliefors test and Jarque-Bera test) were considered as normal data. Cluster analysis for all eight agronomical traits and seven physiochemical properties was performed using the Infostat software (Version 2012) based on Euclidean distance and Ward cluster algorithm. Coefficient of variation (CV) for morphological traits was calculated by using EXEEL software and factor analysis of morphological traits was computed by using SPSS15 software.
RAPD analysis
Fresh leaves were collected at tiller stage and immediately were transferred to -20ºC. DNA was extracted according to a Dellaporta et al. procedure with minor modifications. The quality and quantity of extracted DNA were determined using agarose gel electrophoresis and spectrophotometry, respectively. Twenty-fourRAPD primers were used in this study. The list of primers is given in Table 2. RAPD analysis was performed in 12.5 l reaction volume which contained 15 ng DNA, 3 mM MgCl2, 2 mM of each dNTPs, 1 µM
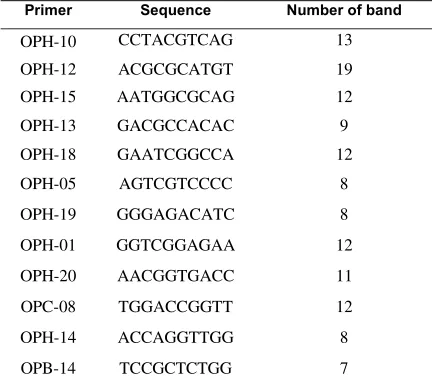
Table 2. RAPD primers and their features.
Primer
Sequence Number of band
OPH-10 13CCTACGTCAG
OPH-12 ACGCGCATGT 19
OPH-15 12AATGGCGCAG
OPH-13 GACGCCACAC 9
OPH-18 GAATCGGCCA 12
OPH-05 AGTCGTCCCC 8
OPH-19 GGGAGACATC 8
OPH-01 12GGTCGGAGAA
OPH-20 11AACGGTGACC
OPC-08
TGGACCGGTT 12
OPH-14 ACCAGGTTGG 8
OPB-14
TCCGCTCTGG 7
ification was as follow: 4 min at 94ºC, followed by 35 cycles of 94ºC for 1 min, 38ºC for 1 min and 72ºC for 10 min. The final extension was 7 min at 72ºC. The amplified products were resolved in 1.5% agarose gel (0.5 X TBE), stained with ethidium bromide (10µg/ml) and photographed under UV light. In order to generate a binary matrix, each locus base on presence or absence a band across all the genotypes was scored as 1 and 0, respectively. It should be noted that, Co-migrating bands were assumed to be originating from the same genetic locus. The obtained binary matrix was analyzed using the NTSYS-PC version 2.02 software in order to calculate the similarity matrices, construct the dendrograms, and compare clusters base on Mantel test (11). Dendrograms were regenerated by dendroscope software Ver 3.
RESULTS and DISCUSSION
On the contrary of other cereal grains such as wheat, barley and sorghum, quality characteristics of rice grains play a key role for the choice and demand of rice consumers (27, 28). These characteristics largely depend on the physicochemical properties, which are greatly influenced by the genotype (18). For this base, the genetic potential of a variety/cultivar determines the diversity of future use (33). In this study, genetic variation of some Iranian rice was investigated base on physicochemical properties and morphological traits in order to identify characteristics that can be useful for rice breeding programs. Physicochemical properties were milling ratio, ratio of white rice to paddy rice, head rice grain percentage, grain length after cook, elongation,
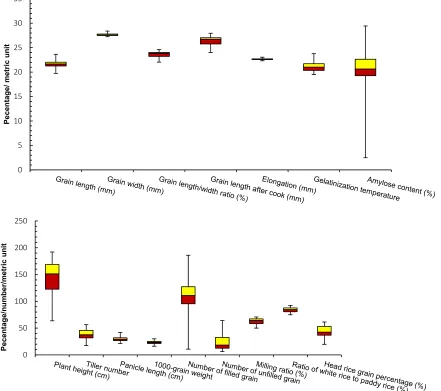
gelatinization temperature and amylose content. Morphological traits were plant height, tiller number, panicle length, 1000-grain weight, grain length, grain width, grain length/width ratio, number of filled grain, number of unfilled grain. Our results showed extensive variations in quality traits among studied genotypes. Among morphological traits, number of unfilled grain, number of tiller, number of filled grain and plant height had the most variation with the CV value of 76.7%, 37.66%, 24.73% and 21.55%, respectively. These values reflect the high range of genetic diversity between studied genotypes for given traits. Our results are also in agreement with Bagheri et al. findings (2008) . The box-plot graph of the rice physicochemical properties and morphological traits has depicted in Figure 1.
Results of pairwise correlation of morphological traits and physicochemical properties are given in Table 3. Plant height showed a strong positive correlation with panicle length (r = 0.721, P< 0.0001). Grain length/width ratio was found to have a strong positive correlation (r =0.747, R2 =0.557, P < 0.0001) with grain length, while
had strong negative correlation (r =-0.885, R2 =0.782, P <
0.0001) with grain width. As it is shown in Table 3, ratio of white rice to paddy rice and milling ratio had a negative correlation with plant height and 1000-grain weight, respectively. Number of unfilled grain also had negative correlation with tiller number and 1000-grain weight. A significant positive correlation was observed for milling ratio with ratio of white rice to paddy rice and head rice grain percentage. Our results are in agreement with Haque et al. study, that reported there was a strong positive correlation between milling ratio and head rice grain (10). The distance matrix based on the Euclidean coefficient among genotypes ranged from 13.97 to 183.99 with an average distance index of 98.98. The lowest genetic distance was observed between local Binam and Domsiah and the highest one belongs to Mosataom and Salari. Results obtained from cluster analysis of physicochemical properties and morphological traits grouped all genotypes into three main clusters (Figure 2). Cluster I contains genotypes of
4 J Plant Mol Breed (2018) 6(2): 1-9
Table 3. Pairwise correlation of morphological traits and physicochemical properties.
X1 X2 X3 X4 X5 X6 X7 X8 X9 X10 X11 X12 X13 X14 X15 X16
X1 1
X2 -0.063 1
X3 -0.2950.721** 1
X4 0.044-0.069 -0.126 1
X5 -0.1870.038 0.123 0.156 1
X6 -0.0930.129 0.136 -0.108 -0.402* 1
X7 -0.003-0.112 -0.063 0.260 0.747** -0.885** 1
X8 -0.321-0.134 -0.068 0.345 0.139 0.015 0.068 1
X9 -0.450*0.003 0.254 -0.492** 0.121 0.109 -0.056 0.063 1
X10 0.0950.112 0.109 -0.474** -0.069 0.309 -0.289 0.026 0.192 1
X11 0.002-0.441* -0.252 0.034 -0.055 0.230 -0.170 0.211 -0.041 0.447* 1
X12 -0.0800.012 0.013 -0.339 -0.259 0.202 -0.274 0.099 0.210 0.678** 0.408* 1
X13 -0.040-0.153 -0.028 0.205 0.268 0.135 0.075 0.177 0.156 0.175 0.453 -0.076 1
X14 -0.0980.215 0.161 -0.032 0.156 0.112 0.002 0.144 0.137 0.332 0.249 0.356 0.334 1
X15 0.1600.091 0.073 0.232 -0.032 -0.158 0.127 0.206 -0.337 -0.033 0.002 -0.037 -0.149 0.076 1
X16 -0.1270.191 0.225 -0.016 0.172 0.129 -0.023 -0.103 -0.022 -0.073 -0.198 -0.329 -0.076 -0.036 0.286 1
**Indicates a significant difference at p ˂ 0.01, * significant difference at p ˂ 0.5
foreign lines including Amol 2, IR58, IR56, Sepidrod, Neda, Nemat, and Haraz as well as Sadriatri and Gerdehrashti allocated in cluster III. From 24 RAPD primers used in this study, only 12 primers produced clear and scorable bands (Table 2). A total of 105 obtained bands, a number of 35 bands were polymorphs which range 7 to 19 bands per primer. OPB-14 and OPH-12 primers shown that lowest and the highest number of bands per primers, respectively. Average number of bands was 10. The data generated from 12 RAPD markers for 30 rice genotypes were applied for calculating similarity coefficient and constructing dendrogram. The Mantel test was used to determine the correlation coefficient between similarity matrices and cophenetic correlation values (21). Similarity coefficient based on RAPD molecular data were ranged from 0.31 to 0.88. The lowest genetic
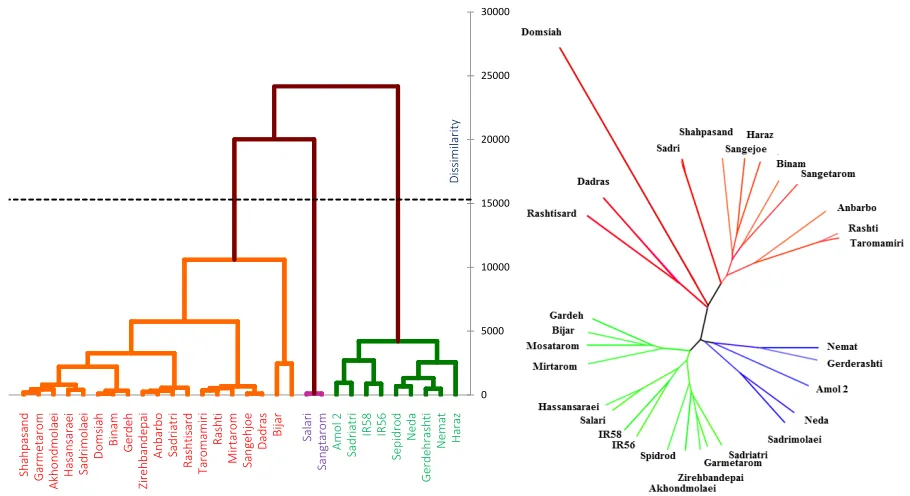
similarity was observed between Salari and Haraz with a value of 0.31. The highest genetic similarity value was 0.88 that were observed between Sadri and Sadrimolaei; Sadri and Akhondmolaei; Rashtisard and Akhondmolaei. Cluster analysis based on UPGMA algorithm and Jaccard's similarity coefficient grouped 30 rice genotypes into three main clusters (Figure 3).
Cluster 1 includes 12 genotypes, namely Rashtisard, Dadras, Domsiah, Sadri, Sadriatri, Shahpasand, Sangejoe, Haraz, Binam, Sangetarom, Anbarbo, Rashti and Taromamiri. This cluster is further divided into three subgroups. Cluster-II includes five genotypes (Nemat, Gerderashti, Amol 2, Neda and Sadrimolaei) which except Gradeh- rashti all others are cultivated in Mazandaran province. The remaining genotypes namely Sadriatri, Garmetarom, Zirehbandepai, Akhondmolaei,
Figure 1. The box-plot graph of the rice morphological traits and physicochemical properties of 30 rice genotypes.
0 5 10 15 20 25 30 35
P
ece
nt
ag
e/
m
et
ric
u
n
it
0 50 100 150 200 250
P
ece
n
ta
g
e/
n
u
m
b
er/m
et
ric
u
n
6 J Plant Mol Breed (2018) 6(2): 1-9
Figure 2. Cluster analysis of different rice genotypes based on physicochemical and morphological traits.
Figure 3. Dandrogram of rice genotypes based on RAPD random markers.
Spidrod, IR56, IR58, Salari, Hassansaraei, Mirtarom, Mosatarom, Bijar and Gardeh were allocated in cluster III.
Generally, the primary purpose of cluster analysis is classification of genotypes based on their similarities or dissimilarities (24). Individuals which are grouped in one cluster are closer genetically to each other. On the other side, individuals which are grouped on different clusters show more genetic variance. Theoretically, hybridization between varieties with high genetic distance, can produce more heterosis (23).
Relatively large amounts of physicochemical, morphological and molecular variability were measured for all given genotypes. The high level of genetic variation suggests that this collection of local and foreign lines would enhance the selection efficiency of desirable varieties, and also is appropriate for future rice breeding program.
ACKNOWLEDGEMENT
This research was funded by Genetics and Agricultural Biotechnology Institute of Tabarestan at Sari Agricultural Sciences and Natural Resources University.
REFERENCES
[1] Alizadeh, M., Nematzadeh, G., Ebrahimi, M., and Hashemi, S. 2013. Fingerprinting of Some Rice (Oryza
sativa L.) Germplasm via AFLP Markers. Crop Biotech.,
3(4): 53-60.
[2] Allhgholipour, M., Farshdfar, E., and Rabiei, B. 2014. Molecular characterization and genetic diversity analysis
of different rice cultivars by microsatellite markers.
Genetika, 46(1): 187-198.
[3] Babaei, A., Nematzadeh, G.-A., and Hashemi, H. 2011. An evaluation of genetic differentiation in rice mutants using semi-random markers and morphological
characteristics. Australian Journal of Crop Science, 5(13):
1715.
[4] Babaei, A., Nematzadeh, G.-A., and Hashemi, H. 2011. Molecular RAPD markers analysis of Sange-tarom and Taromhashemi cultivars (Oryza sativa L.) in M2
population. Annals Biol. Res, 2(4): 24-30.
[5] Babaei, A., Nematzadeh, G.A., Avagyan, V., and Hashemi-Petrodi, S.H. 2010. Radio sensitivity studies of morpho-physiological characteristics in some Iranian rice
varieties (Oryza sativa L.) in M1 generation. African
Journal of Agricultural Research, 5(16): 2124-2130.
[6] Bagheri, N., Babaeian, J.N., and HASAN, N.E. 2008. Genetic diversity of Iranian rice germplasm based on
morphological traits.
[7] Bagheri, N., Babaeian, N., and nataj, H. 2008. Genetic diversity of Iranian rice germplasm based on
morphological traits. Iranian journal of field crops
research, 6(2): 235-243.
[8] Dellaporta, S.L., Wood, J., and Hicks, J.B. 1983. A plant
DNA minipreparation: version II. Plant molecular biology
reporter, 1(4): 19-21.
[9] Ghareyazie, B., Huang, N., Second, G., Bennett, J., and Khush, G. 1995. Classification of rice germplasm. I.
Analysis using ALP and PCR-based RFLP. TAG
Theoretical and Applied Genetics, 91(2): 218-227. [10] Haque, M., Islam, S., Banik, M., Khalequzzaman, M.,
Siddiquee, M., and Mian, M. 2013. Physicochemical and cooking properties of local aromatic rice gerplasm in
Bangeladesh. Eco-friendly Agril. J., 6(11): 243-248.
[11] Hashemi-Petroudi, S.H., Maibody, S.A.M.M.,
Nematzadeh, G.A., and Arzani, A. 2010. Semi-random PCR markers for DNA fingerprinting of rice hybrids and
theirs corresponding parents. African Journal of
Biotechnology, 9(7): 979-985.
[12] Hashemi, S.H., Mirmohammadi-Maibody, S.A.M.,
Nematzadeh, G.A., and Arzani, A. 2009. Identification of
rice hybrids using microsatellite and RAPD markers.
African Journal of Biotechnology, 8(10).
[13] Huang, B.E., George, A.W., Forrest, K.L., Kilian, A., Hayden, M.J., Morell, M.K., and Cavanagh, C.R. 2012. A
multiparent advanced generation inter‐cross population
for genetic analysis in wheat. Plant biotechnology journal,
10(7): 826-839.
[14] Huang, Y.-F., Poland, J.A., Wight, C.P., Jackson, E.W., and Tinker, N.A. 2014. Using genotyping-by-sequencing
(GBS) for genomic discovery in cultivated oat. PloS one,
9(7): e102448.
[15] Jahani, M., Nematzadeh, G., Dolatabadi, B., Hashemi, S.H., and Mohammadi-Nejad, G. 2014. Identification and validation of functional markers in a global rice collection
by association mapping. Genome, 57(6): 355-362.
[16] Jahani, M., Nematzadeh, G., Mohammadi-Nejad, G., Hashemi, S., Dolatabadi, B., and Hajipoor, A. 2013. Grain
size diversity in rice (Oryza sativa L.) genotypes.
International Journal of Agronomy and Plant Production, 4(8): 2024-2029.
[17] Juliano, B.O. and Villareal, C. 1993. Grain quality evaluation of world rices. Int. Rice Res. Inst.
[18] Kishine, M., Suzuki, K., Nakamura, S., and Ohtsubo, K.i. 2008. Grain qualities and their genetic derivation of 7 new
rice for Africa (NERICA) varieties. Journal of agricultural
and food chemistry, 56(12): 4605-4610.
[19] Lal, R. 2004. Soil carbon sequestration impacts on global
climate change and food security. science, 304(5677):
1623-1627.
[20] Little, R.R. 1958. Differential effect of dilute alkali on 25
varieties of milled white rice. Cereal Chem., 35: 111-126.
[21] Mahjoob, B., Zarini, H., Hashemi, S., and Shamasbi, F. 2016. Comparison of ISSR, IRAP and REMAP markers for assessing genetic diversity in different species of
Brassica sp. Russian Journal of Genetics, 52(12):
1272-1281.
[22] Majzoobi, M. and Farahnaky, A. 2010. The
Physicochemical Properties of Starch Component of six
Iranian Rice Cultivars. Iran Agricultural Research,
27(1.2): 113-122.
[23] Melchinger, A.E. and Gumber, R.K. 1998. Overview of
heterosis and heterotic groups in agronomic crops.
Concepts and breeding of heterosis in crop plants, (conceptsandbree): 29-44.
[24] Mohammadi, S. and Prasanna, B. 2003. Analysis of genetic diversity in crop plants—salient statistical tools
and considerations. Crop science, 43(4): 1235-1248.
[25] Mullet, J.E. 2017. High-Biomass C 4 Grasses− Filling the
Yield Gap. Plant Science.
[26] Nematzadeh, G. and Khush, G. 1993. Classification of rice
germplasm from Iran through isozyme analysis. Intl. Rice
Res. Newslett, 10.
[27] Neoh, W.T. 2011. Physicochemical characteristics of
different rice varieties found in Sabah.
[28] Odenigbo, A.M., Ngadi, M., Ejebe, C., Woin, N., and Ndindeng, S.A. 2014. Physicochemical, cooking characteristics and textural properties of TOX 3145 milled
rice. Journal of Food Research, 3(2): 82.
[29] Parsaeian, M., Mirlohi, A., and Saeidi, G. 2011. Study of genetic variation in sesame (Sesamum indicum L.) using
agro-morphological traits and ISSR markers. Russian
journal of genetics, 47(3): 314.
[30] Sajib, A.M., Hossain, M., Mosnaz, A., Hossain, H., Islam, M., Ali, M., and Prodhan, S.H. 2012. SSR marker-based molecular characterization and genetic diversity analysis
of aromatic landreces of rice (Oryza sativa L.). Journal of
BioScience & Biotechnology, 1(2).
[31] SES, I. 2002. Standard Evaluation System. International
Rice Research Institute, Manila, Philippines: 11-30. [32] Sorkheh, K., Masaeli, M., Chaleshtori, M.H., Adugna, A.,
8 J Plant Mol Breed (2018) 6(2): 1-9
Iran and world core germplasm set. Biochemical genetics,
54(2): 177-193.
[33] Stefanović, V.Ž., Filipović, N.K., and Jovanović, B.M.
2008. Undesirable metals content in wheat of different
wheat varieties. Acta Periodica Technologica, (39): 69-76.
[34] Tabkhkar, N., Rabiei, B., and Sabouri, A. 2012. Genetic diversity of rice cultivars by microsatellite markers tightly
linked to cooking and eating quality. Australian Journal of
Crop Science, 6(6): 980.
[35] Vaesi, B., Rahamini Moghadam, N., Nematzadeh, G., Kazemitabar, S., and Gharahyazi, B. 2005. Determination of genetic diversity and classification of Iran rice
germplasm with RAPD markers.
[36] Vazirzanjani, M., Sarhadi, W.A., NWE JJ, A.M., Siranet, R., and Trung, N. 2011. Characterization of Aromatic Rice Cultivars From Iran and Surrounding Regions for Aroma
and Agronomic Traits. SABRAO J Breed Genet, 43:
15-26.
[37] Zaynali Nejad, K., Mirlohi, F., Nematzadeh, G., and Rezai, A. 2003. Genetic diversity in some of Iranian Rice
(Oriza sativa L.) germplasm base on morphological traits.