DESERT 18 (2013) 63-71
Spatial Analysis of Meteorological Drought in Iran from 1965 to
2003
J. Bazrafshan
a*, A. Khalili
aa
Irrigation and Reclamation Engineering Department, University of Tehran, Iran
Received: 23 February 2013; Received in revised form: 6 August 2013; Accepted: 9 September 2013
Abstract
The present study examined year-to-year variations in areas affected by drought during a period of 39 water years in Iran. Ninety-five meteorological stations were chosen to provide near-continuous long-term records, although some data was missing (less than 10%). The missing data pointswere estimated using a linear correlation method between the reference station with the missing data points and a neighboring station that had a complete record. At all stations, the standard index of annual precipitation (SIAP) was calculated for water year (sum of precipitation from October 1 to September 31). The geo-statistical method of weighting moving average (WMA) was applied to a 2×2 km grid network map of Iran and the geographical distribution of SIAP was calculated and displayed. From this, the percentage of area affected by severe, moderate, and mild drought was computed for each year; the frequency of drought was analyzed by severity and the behaviors of the most extensive historical droughts were determined. The results showed that: a) the maximum frequency of severe drought was 5.1 times and moderate drought was 23.1 times per 100 years; b) the most extensive droughts (more than 80% of the country) occurred during 1970-1971 (82.21%), 1988-1989 (92.05%), and 1999-2000 (96.27%); and c) drought spread in Iran beginning from the northwestern and southeastern regions, gradually extending to the central regions.
Keywords: Drought; Severity; Extent; Geo-statistics; Iran
1. Introduction
Iran has an area of 1650 000 km2 and is located in the semi-arid regions of Middle Asia at 25° to 40° north latitude and 44° to 64° east
longitude. The latitudinal extension of the
country affects its topography and the distance of some areas from the sea, producing diverse climates. An large part of Iran is arid (65%) or semi-arid (20%); the rest has Mediterranean to very humid climates (Khalili, 2004).
As do other countries located in arid and semi-arid regions, Iran faces a naturally dearth of precipitation in some years that becomes critical at times of severe drought. Although drought commonly occurs in Iran, its importance was highlighted after the devastating
Corresponding author. Tel.: +98 263 2241119,
Fax: +98 263 2241119. E-mail address:[email protected]
droughts of 1998-2001, when the cost of the drought damage was estimated to be $7.8 billion. Details of this drought have been described by Mousavi (Mousavi, 2002).
There are many definitions of drought, but none are universally accepted. Dracup et al. (1980) suggested categorizing drought and Wilhite and Glantz (1985) developed this into a system approved by the American Meteorological Society (AMS, 2000). Based on the nature of water shortage, drought can be classified as meteorological, hydrological, agricultural, or socio-economic. The first three categories are types of environmental drought and the last is related to water resource systems (Wilhite, 2000).
In the last decade, assessments of drought have been done on the national and regional levels in Iran. The results of two studies were used in this research. Bazrafshan (2002) compared seven meteorological drought indices for diverse climates in Iran (arid to very humid regions). He recommended SIAP, SPI, and EDI for drought monitoring on annual, monthly, and daily timescales, respectively. Akhtari et al., (2009) compared the geo-statistical methods of kriging, co-kriging, thin plate smoothing spline, Theissen polygons, and WMA for spatial distribution of drought in Tehran province. Their results found that, although kriging is the most accurate method, WMA provided reasonable accuracy combined with simplicity and speed of procedure, and thus, can be also recommended for operational drought monitoring in the region.
The present study used SIAP to monitor meteorological drought in Iran and applied WMA to map SIAP across Iran for each year. The purpose of this research was to analyze the frequency and extent of drought and its spread across Iran over 39 years ending until 2003.
2. Methodology
2.1. Preliminary analysis of precipitation data
Precipitation sources in Iran can be divided into three general categories (Khalili, 2004): i) Mediterranean flows: a ridge of high-pressure build up over the Mediterranean Sea that moves east and enters the country from the southern and northern borders. This type affects the country for seven months from mid-October to mid-April; ii) northern Pacific Ocean flows: the build-up the northern Pacific Ocean crosses the Black Sea and enters the country from the northwestern borders; iii) Sudan flows: after crossing the Red Sea and the Persian Gulf, these
collected throughout the country. Before using precipitation data in drought analysis, it was necessary to do the preliminary controls for the length of the homogeneous record period, and on missing data and its reconstruction. This was accomplished in the following steps:
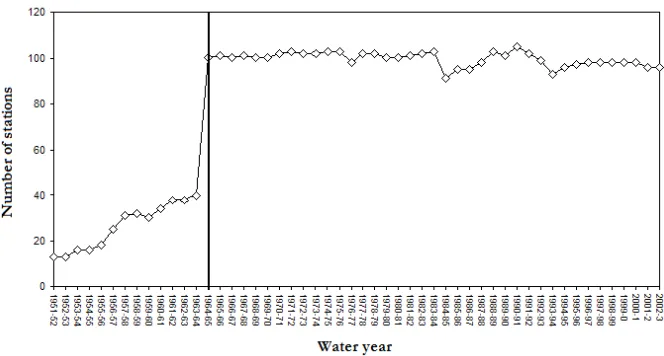
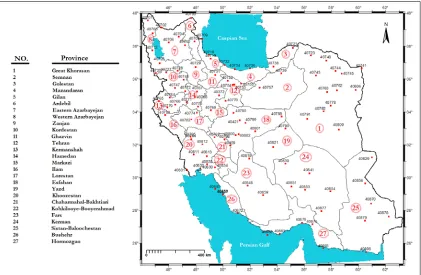
i. It was found that data from some precipitation records of the stations was missing for the statistical period of 1951-2003. Figure 1 shows the number of stations at which precipitation was measured for water years for 1951-2003. Water year precipitation is the sum of precipitation from October 1 of a given year to September 31 of the next year. As shown in Figure 1, there was a jump in the number of stations between 1963-64 (40 stations) and 1964-65 (100 stations). To accommodate this jump, the record period chosen for the study covered the water years 1964-65 to 2002-03. ii. After the basic length of the record was chosen, the frequency of missing data at each station was identified (Figure 2). It was found that 19 stations had no missing data and the amount of missing data at other stations ranged from 1 to 21 years. To ensure the suitability of the stations, those with more than 10% (4 years) missing data were omitted from the network. A total of 95 synoptic stations were chosen; Figure 3 shows the station network with over 35 years of records in the country.
Fig. 1. Number of stations in which precipitation amount was measured, vs. water year during 1951-2003
2.2. Drought monitoring
SIAP was chosen for use as the drought index because: i) it is computationally simple and the only input required is annual precipitation, which is measured at most meteorological stations; ii) for meteorological studies performed by the Iranian Water Project (JAMAB, 1991), different thresholds were tested for SIAP that indicated that the thresholds
shown in Table 1 accurately detected historical drought in Iran. The equation for SIAP is:
SD P P SIAP i i
(1)
where Pi is the sum of precipitation in a given
water year, P is the average water year
precipitation, and SD is the standard deviation of the water year precipitation (mm).
Table 1. Drought class classification of SIAP (JAMAB, 1991)
Drought classes SIAP values Normal and above normal SIAP > -0.5
Mild drought -1.0 <SIAP ≤ -0.5 Moderate drought -2.0 < SIAP ≤ -1.0
Severe drought SIAP ≤ -2.0
2.3. Interpolation technique for spatial analysis of drought
Geo-statistical techniques are frequently used for spatial analysis of environmental factors. One well-known methods is WMA, which served as the interpolation tool for spatial analysis of drought in this study. WMA was directly applied to SIAP values. In this technique, the quantity of a variable at an unknown point was estimated by adjacent known points using the following formula:
k i n i k i n i i d d Z Z 1 1* 1 (2)
where Z* is the estimated quantity at an
unknown point, Zi is the quantity of the variable at an adjacent point, di is the Euclidean distance between the Zi to the Z*, n is the power, and k is the number of adjacent points. As described by
Akhtari et al., (2009), the optimal values for n
and k were determined to be 2 and 6,
respectively.
3. Results and Discussion
3.1. On-site analysis of drought
severe drought in the provinces of Greater
Fig. 2. Number of missing data in each station. The dashed line represents the threshold of acceptable missing data for reconstruction during record period
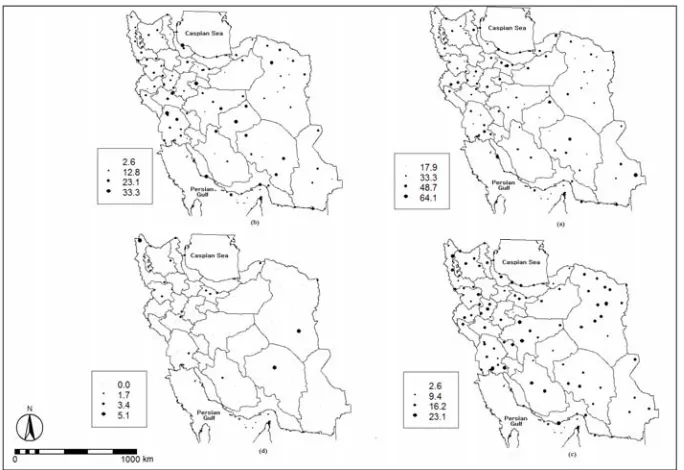
Fig. 4. The maximum and minimum quantity of SIAP in the country during the statistical period of 1965-2003
Fig. 5. Geographical distribution of drought frequency for severe, moderate, and mild categories along with normal category of SIAP in Iran
3.2. Spatial analysis of drought
WMA (ILWIS software, ver.3.0
environment) was used on the SIAP values computed at the stations of interest, maps of the iso-SIAP values were drawn, and the areas for the drought categories were computed for each water year. The areas affected by both drought and wet periods by water year are shown in Table 2. Except for water year 1999-2000, in which severe drought affected 0.11% of the country, severe drought was experienced by less than 0.02% of the rest of the country; however, for 80% of water years, the country did not experience severe drought. In 1999-2000, more than 70% of the country experienced moderate
drought that was almost twice the extent of moderate drought in other water years.
1976-77 0 0.04 7 76.02 15.03 1.9 0.01 1977-78 0 0.08 4.47 85.19 9.69 0.57 0 1978-79 0 0.09 4.68 68.56 20.38 6.23 0.06 1979-80 0 0.21 1.41 65.83 22.07 10.42 0.06 1980-81 0 0.01 8.84 69.01 16.77 4.98 0.39 1981-82 0 0.07 7.05 61.85 15.5 13.09 2.45 1982-83 0.02 0.91 1.11 31.03 42.28 24.61 0.04 1983-84 0 7.98 35.68 56.09 0.24 0 0 1984-85 0 3.93 46.13 48.71 1.06 0.14 0.02 1985-86 0 0.36 17.05 63.87 16 2.72 0 1986-87 0 0.96 9.16 73.98 12.52 3.34 0.04 1987-88 0 0 0.43 58.09 25.88 15.61 0
1988-89 0 31.37 60.68 7.94 0 0 0
1989-90 0 3.91 32.84 56.21 6.14 0.9 0 1990-91 0 1.83 18.13 44.78 25.03 10.19 0.05 1991-92 0 0 0.01 38.32 41.6 20.05 0.03 1992-93 0 0 0.07 28.31 33.64 35.1 2.87 1993-94 0 10.65 47.78 31.65 8.21 1.71 0 1994-95 0 0.03 3.95 42.49 30.73 22.62 0.18 1995-96 0 1.57 3.12 29.36 16.65 30.25 19.05 1996-97 0.01 12.42 39.6 42.82 3.96 1.18 0 1997-98 0 0.13 3.37 31.65 25.22 34.36 5.28 1998-99 0 16.72 16.33 62.28 4.32 0.35 0 1999-00 0.11 73.21 22.95 3.69 0.04 0.01 0 2000-01 0.01 39.42 32.22 28.27 0.08 0 0 2001-02 0 11.54 14.06 63.51 8.04 2.84 0.01 2002-03 0 1.11 28.07 53.51 13.1 4.17 0.04
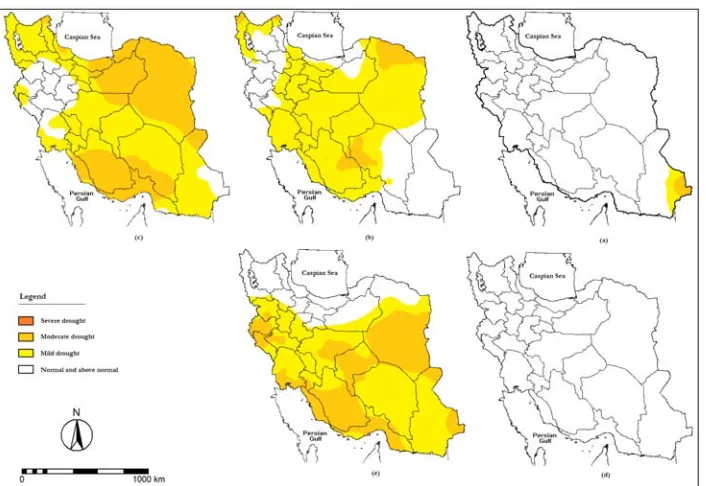
3.2.1. 1970-1971 drought
The occurrence of drought in water year 1968-1969 was the starting point of the widespread drought of 1970-1971. Figure 6(a) shows that this drought commenced in a small area from the southeast corner of the country and the following year (Figure 6(b)) encompassed southwestern, central, northeastern and western regions of the country. Continued lack of precipitation increased the severity and extent of drought in 1970-1971 (Figure 6(c)) over that of the previous year. Except for those western, central and southeastern parts of the country, mild and moderate drought dominated. Note that the following year (1971-1972), normal and above normal precipitation conditions occurred across the country (Figure 6(d)); although it appears
that, in water year 1971-1972, the widespread drought from the previous year terminated, in 1972-1973, large parts of the country (southern Alborz Mountains) again experienced drought.
3.2.2. 1988-1989 drought
Fig. 6. Spatial distribution of SIAP drought classes over Iran: a) 1968-1969, b) 1969-1970, c) 1970-1971, d) 1971-1972, and e) 1972-1973
Fig. 7. Spatial distribution of SIAP drought classes over Iran: a) 1984-1985, b) 1985-1986, c) 1986-1987, d) 1987-1988, and e) 1988-1989
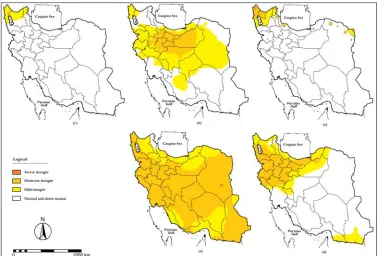
3.2.3. 1999-2000 drought
Figures 8(a) to 8(d) show the movement of drought over the country before the occurrence of extensive drought in water year 1999-2000. Figure 8(a) shows that a drought entered the
Fig. 8. Spatial distribution of SIAP drought classes over Iran: a) 1995-1996, b) 1996-1997, c) 1997-1998, d) 1998-1999, and e) 1999-2000
4. Conclusion
In this research, the severity and extent of droughts in Iran from 1965 to 2003 were analyzed. Drought monitoring at each station used SIAP drought index. The SIAP values in Iran varied from -2.51 to +4.84. At most stations, maximum positive SIAP values show a severe wet period and minimum negative SIAP values show moderate drought conditions. Assessing the frequency for each SIAP class indicates that severe and moderate drought occurred less than 5.1% and 23.1% of the time during the statistical period of interest. The geo-statistical WMA method was used to map SIAP across the country. The most extensive droughts in Iran (>80% of the country) occurred during 1970-1971 (82.21%), 1988-1989 (92.05%), and 1999-2000 (96.27%). It is evident that the extent of drought in Iran increased from 1965 to 2003 and that the time interval between pervasive droughts decreased.
References
Akhtari, R, S. Morid, M.H. Mahdian and V. Smakhtin, 2009. Assessment of areal interpolation methods for spatial analysis of SPI and EDI drought indices. International Journal of Climatology, 29: 135-145. American Meteorological Society, 2004. Statement on meteorological drought, Bulletin of American Meteorological Society, 85: 771-773.
Bahlme, H.N. and DA. Mooley, 1980. Large-scale droughts/floods and monsoon circulation, Monthly Weather Review, 108: 1197-1211.
Bazrafshan, J., 2002. A comparative study of several meteorological drought indices in some climatic zones of Iran. M.Sc. Thesis, University of Tehran, Karaj, Iran.
Byun, H.R. and D.A. Wilhite, 1999. Objective quantification of drought severity and duration. Journal of Climate, 12(9): 2747-2756.
Chang, T.J., 1991. Investigation of precipitation droughts by use of Kriging method. Journal of Irrigation and Drainage Engineering, 117(6): 935- 943.
Dracup, J.A., K.S. Lee and E.G. Paulson, 1980. On the definition of droughts. Water Resource Research, 16: 297-302.
JAMAB, 1991. Iran Water Integrated Project: Meteorological Report. Ministry of Power, Tehran. Khalili, A., 2004. The climatology of Iran. In: M.H. Banaei, M. Bybordi, A. Moameni, M.J. Malakouti. The soils of Iran, Soil and water research Institute, Iran, pp: 24-71.
McKee, T.B., N.J. Doesken and J. Kleist, 1993. The relationship of drought frequency and duration to time scales. Eight Conference On Applied Climatology, Anaheim, CA, American Meteorological Society, pp. 179-184.
Mousavi, S.F., 2002. Agricultural drought management in Iran: Water Conservation, Reuse, and Recycling. Proceeding of an Iranian-American Workshop Committee on US-Iranian Workshop on Water Conservation and Recycling, National Research Council, Washington D. C., [Available from www.nap.edu], pp. 106-113.
Palmer, W.C., 1965. Meteorological drought. U.S. Dept. of Commerce, Weather Bureau Research Paper, 45: 58 pp.
Santos, M.A.B., F.N. Correia and L.V. DaCunha, 1983. Drought characterization and drought impacts in Portugal. Memoria 591, Laboratorio Nacional de Engenharia Civil, Lisbon, Portugal.
Soule, P.T., 1992. Spatial patterns of drought frequency and duration in the contiguous USA based on
multiple drought event definitions. International Journal of Climatology, 12: 11-24.
Tsakiris, G. and H. Vangelis, 2005. Establishing a drought index incorporating evapotranspiration. European Water (EWRA), 9-10: 1–9.
Wilhite, D.A. and M.H. Glantz, 1985. Understanding the drought phenomenon: the role of definitions. Water International, 10 (3): 111-120.
Wilhite DA. 2000. Drought as a natural hazard: concepts and definitions. In: Drought: global assessment, edited by Wilhite DA., Routledge. pp. 3- 18.