R E S E A R C H
Open Access
Gestational diabetes is associated with
change in the gut microbiota composition
in third trimester of pregnancy and
postpartum
Mie Korslund Wiinblad Crusell
1, Tue Haldor Hansen
1, Trine Nielsen
1, Kristine Højgaard Allin
1,2, Malte C. Rühlemann
3,
Peter Damm
4,5, Henrik Vestergaard
1,6, Christina Rørbye
7, Niklas Rye Jørgensen
8,9, Ole Bjarne Christiansen
10,11,12,
Femke-Anouska Heinsen
3, Andre Franke
3, Torben Hansen
1, Jeannet Lauenborg
13and Oluf Pedersen
1*Abstract
Background:Imbalances of gut microbiota composition are linked to a range of metabolic perturbations. In the present study, we examined the gut microbiota of women with gestational diabetes mellitus (GDM) and normoglycaemic pregnant women in late pregnancy and about 8 months postpartum.
Methods:Gut microbiota profiles of women with GDM (n= 50) and healthy (n= 157) pregnant women in the third trimester and 8 months postpartum were assessed by 16S rRNA gene amplicon sequencing of the V1-V2 region. Insulin and glucose homeostasis were evaluated by a 75 g 2-h oral glucose tolerance test during and after pregnancy.
Results:Gut microbiota of women with GDM was aberrant at multiple levels, including phylum and genus levels, compared with normoglycaemic pregnant women.Actinobacteriaat phylum level andCollinsella,Rothiaand
Desulfovibrioat genus level had a higher abundance in the GDM cohort. Difference in abundance of 17 species-level operational taxonomic units (OTUs) during pregnancy was associated with GDM. After adjustment for pre-pregnancy body mass index (BMI), 5 of the 17 OTUs showed differential abundance in the GDM cohort compared with the normoglycaemic pregnant women with enrichment of species annotated toFaecalibacteriumand
Anaerotruncusand depletion of species annotated toClostridium(sensu stricto) and toVeillonella. OTUs assigned to
Akkermansiawere associated with lower insulin sensitivity whileChristensenellaOTUs were associated with higher fasting plasma glucose concentration. OTU richness and Shannon index decreased from late pregnancy to postpartum regardless of metabolic status. About 8 months after delivery, the microbiota of women with previous GDM was still characterised by an aberrant composition. Thirteen OTUs were differentially abundant in women with previous GDM compared with women with previous normoglycaemic pregnancy.
(Continued on next page)
* Correspondence:[email protected]
1Novo Nordisk Foundation Center for Basic Metabolic Research, Section for Metabolic Genetics, Faculty of Health and Medical Science, University of Copenhagen, Blegdamsvej 3B, 2200 Copenhagen N, Denmark Full list of author information is available at the end of the article
(Continued from previous page)
Conclusion:GDM diagnosed in the third trimester of pregnancy is associated with a disrupted gut microbiota composition compared with normoglycaemic pregnant women, and 8 months after pregnancy, differences in the gut microbiota signatures are still detectable. The gut microbiota composition of women with GDM, both during and after pregnancy, resembles the aberrant microbiota composition reported in non-pregnant individuals with type 2 diabetes and associated intermediary metabolic traits.
Keywords:Gut microbiota, Gestational diabetes, Pregnancy, Bacterial species, Body mass index, Glycaemic traits, Gestational hyperglycaemia
Background
Pregnancy induces metabolic and immunological changes, characterised by increased insulin resistance and immune tolerance against the foetus and placenta [1,2]. In predis-posed women, these physiological changes may lead to the development of gestational diabetes mellitus (GDM). GDM is defined as abnormal glucose regulation with on-set or first recognition during pregnancy and is one of the most common complications during pregnancy with an incidence of 2–6% of all pregnancies in Europe [3, 4]. GDM is a transient state, but even though glucose regula-tion often normalises shortly after delivery, women with GDM have a 40% increased risk of developing type 2 dia-betes mellitus within a 10–15-year period [3,5].
The influence of the gut microbial community on hu-man health is becoming increasingly evident, and it has been shown that patients with metabolic disorders such as obesity and type 2 diabetes differ in faecal microbiota composition from healthy individuals [6, 7]. Studies in-vestigating the gut microbiota of healthy pregnant women have documented profound alterations in com-position from the first to the third trimester [8, 9]. Koren et al. found an increased abundance of
Actinobac-teria and Proteobacteria and a decreased abundance of
Faecalibacterium during the third trimester, resembling the composition reported in non-pregnant adults with metabolic syndrome. Interestingly, when germ-free mice were inoculated with faeces from healthy women who were pregnant in the third trimester, some metabolic changes were demonstrated. The mice exhibited in-creased weight gain, slightly lower insulin sensitivity and a more pronounced inflammatory response when com-pared with mice inoculated with faeces from healthy women who were pregnant in the first trimester [8]; a result partly similar to the effects observed in germ-free mice when inoculated with microbiota from non-pregnant obese human donors [10] and when adults with metabolic syndrome is inoculated with microbiota from lean non-pregnant donors [11]. In contrast to the pronounced changes during pregnancy, no substantial differences in the maternal microbial composition have been reported when comparing late pregnancy to the first months postpartum [8,12].
Here, we hypothesise that GDM imposes changes in the faecal microbiota (here termed gut microbiota) dur-ing late pregnancy which are distinct from microbiota changes of normal pregnant women and that some microbiota aberrance remains postpartum in women with previous GDM. Hence, we aimed to investigate the differences in the gut microbiota and host metabolism between normoglycaemic pregnant women and women with newly diagnosed GDM in late pregnancy and on an average 8 months postpartum where insulin sensitivity and immune functions under normal circumstances have returned to a habitual stage.
Methods
Study population and design
During January 2014 to February 2015, we phenotyped at Herlev University Hospital in Denmark pregnant women who were referred to a 2-h 75-g oral glucose tol-erance test (OGTT) in their third trimester (27–33 ges-tational weeks). Selected references to the hospitals were due to the presence of risk factors for GDM (family his-tory of type 2 diabetes mellitus; previous delivery of a child weighing ≥4500 g at birth; glucosuria; pre-pregnancy BMI≥27 kg/m2; known polycystic ovarian syndrome). In total, 790 women were invited to participate in the project of whom 213 women were included in the study as they fulfilled the inclusion criteria of being singleton pregnant (verified by an ultrasound scan), of Danish white origin and without diagnosed pre-eclampsia at the time of inclusion. Mul-tipara women with a previous normoglycaemic preg-nancy were included. Women were excluded if they had taken antibiotics within a period of 2 months before the first visit. All included participants were re-invited for a follow-up visit on an average of 8.8 months postpartum (Additional file1: Figure S1).
Anthropometrics and derived traits
indoor clothing. Using a non-expandable measuring tape, waist and hip circumferences were measured to the nearest 1 cm in an erect position midway between the iliac crest and the lower costal margin and at the level of the pubic symphysis, respectively. Body composition was assessed (postpartum only) using bioelectric impedance analysis (TANITA BC-420MA, USA). Pre-pregnancy weight was reported by the participants according to the weight noted in their pregnancy health records. Twenty-four women did not recall their weight before pregnancy or did not bring their pregnancy health record at the first visit. Body mass index (BMI) was calculated by div-iding the weight in kilograms by the square of height in meters. Normal weight was defined as BMI < 25 kg/m2, overweight as BMI≥25 kg/m2 and < 30 kg/m2 and obesity as BMI≥30 kg/m2 [13]. Weight gain during pregnancy was calculated as the difference in measured weight obtained at the first visit and self-reported pre-pregnancy weight.
Blood pressure was recorded by an automatic sphyg-momanometer (A&D Medical, Japan) as the mean of du-plicate measurements in a sitting position after a 10-min rest. Gestational hypertension was defined as develop-ment of either a systolic blood pressure ≥140 mmHg, a diastolic blood pressure ≥90 mmHg or both after 20 weeks of gestation [14].
Questionnaires, medical records and derived traits
Participants completed a questionnaire on health and lifestyle, including information on smoking and alco-hol consumption, stool consistency on the Bristol stool scale and bowel habits and social and educa-tional attainment. Physical activity was recorded using a validated instrument by questionnaire [15]. At both visits, dietary habits were recorded using a validated food frequency questionnaire (FFQ) [16]. Intensity-weighted activity levels were calculated as metabolic equivalent of task (MET) hours per week [17]. Partici-pants were asked to bring their medication and diet-ary supplements at each visit, and exact daily dosages were recorded. Information about gestational age at previous birth, delivery method and antepartum, intrapartum or postpartum antibiotic treatment was obtained from the hospital birth records.
Biochemistry and derived traits
At both visits, the women were examined in the morn-ing followmorn-ing a 10-h overnight fast.
Venous blood was collected in the fasting state for hormonal and metabolic biomarkers. A standard 2-h OGTT with 75 g of glucose dissolved in 200 ml of water and sampling of venous blood at 0, 30, 60 and 120 min was conducted.
Plasma glucose was analysed by the glucose oxidase method using a colorimetric slide test on a Vitros 5600 system (Ortho Clinical Diagnostics, Raritan, NJ USA; co-efficient of variation (CV) 6.1%) at the Department of Clinical Biochemistry Herlev University Hospital during pregnancy and at the Department of Clinical Biochemis-try Rigshospitalet, Glostrup postpartum. Plasma insulin was measured on a Roche cobas e411 system using an enzyme-linked chemiluminescent immunoassay (Roche Diagnostics GmbH, Mannheim, Germany; CV 2.8%). High-sensitivity C-reactive protein (hsCRP) was mea-sured on a Roche cobas c701 system using a particle-enhanced turbidimetric immunoassay (Roche Diagnos-tics GmbH, Mannheim, Germany) with an intra-assay CV of 0.7–2.3%.
Homeostasis model assessment of insulin resistance (HOMA-IR), insulinogenic index and disposition index were calculated according to Matsuda et al. (mmatsuda. diabetes-smc.jp/MIndex.html).
GDM was diagnosed according to the International Asso-ciation of the Diabetes and Pregnancy Study Group (IADPSG) criteria: one or more elevated values—fasting plasma glucose≥5.1 mmol/L and/or 1-h plasma glucose≥ 10.0 mmol/L and/or 2-h plasma glucose≥8.5 mmol/L [18].
Descriptive analyses
Statistical analyses were performed using R Studio ver-sion 1.0.136 (http://www.r-project.org/). Two-tailed Stu-dent’s t test and the χ2 test were used to test the differences in phenotypical characteristics. Variables were log transformed to improve normality and homoscedasticity where appropriate. A Wilcoxon signed-rank test was applied for paired non-normally distributed data. Linear mixed models were used to compare dietary intake during pregnancy and postpartum.
Microbiome analyses
DNA extraction, library preparation, sequencing and initial preparation of data
Faecal samples were collected at home by the partici-pants within 48 h of the OGTT, following a standardised procedure including antiseptic handling, collection in sterile tubes and immediate freezing at −18 °C. The samples were transferred to the laboratory on dry ice within 48 h of collection and stored at −80 °C until DNA extraction. Two hundred nine women provided faecal samples at baseline, 122 of whom also provided a faecal sample postpartum.
for 5 min using a TissueLyser instrument (Qiagen). Suf-ficient amounts of DNA could not be extracted from four faecal samples due to too little material.
Variable regions V1-V2 of the 16S rRNA gene were amplified using the 27F/338R primer pair [20]. The nor-malisation of PCR product was performed using the SequalPrep Normalization Plate Kit (Life Technologies). Pooling and sequencing were done on the Illumina MiSeq platform using a dual-indexing strategy [21] with MiSeq Reagent Kits v2. Demultiplexing was based on zero mismatches in the barcode sequence. The raw se-quencing data was trimmed using sickle [22] in paired-end mode, using default quality values and a minimum read length of 100 bp after trimming. Forward and re-verse read were merged using vsearch (v1.9, https:// github.com/torognes/vsearch), setting minimal and max-imal overlap to 280 and 350 bp, respectively. Further quality control included filtering based on a maximum expected error of 1 (vsearch v1.9) and a read quality below 30 in maximum 5% of the sequence, followed by reference-based chimera detection using vsearch. Qual-ity controlled reads were annotated using UTAX [23], and sequences that could not be assigned to bacteria and sequences assigned to chloroplasts were removed. Picking of operational taxonomic units (OTUs) was per-formed using vsearch based on the non-rarefied dataset and an identity cut-off of 97%, excluding only singleton sequences prior to clustering. OTU picking was followed by a second step identifying chimeras, this time using a de novo approach. The reads of each sample were mapped to these OTU sequences, and 10,000 randomly chosen sequences were used to construct the OTU abundance table. Additionally, OTU sequences under-went taxonomic annotation using the ribosomal data-base project (RDP) classifier [24] and training set 16 provided on the RDP website (https://rdp.cme.msu.edu). The cut-off for annotation was set to a classification score of 0.8, assigning each OTU to the lowest taxo-nomic level exceeding this threshold in the classification. This classification was used to construct a taxonomic abundance table based on the OTU abundance table, collapsing OTUs assigned to the same taxon into one taxonomic bin. The final dataset of the third trimester pregnant women consisted of 209 samples (157 from normoglycaemic women, 50 from women with GDM and 2 from women with uncertain diabetes status due to missing information about fasting plasma glucose level) and 122 postpartum samples (79 and 43 from normogly-caemic and diabetic women, respectively).
Data analyses
Alpha diversity metrics (richness and Shannon’s index) were calculated using the phyloseq R package based on rarefied OTU counts. Pielou’s evenness index was
calculated as Shannon’s index/ln (richness). The cross-sectional difference in alpha diversity between groups during pregnancy and postpartum was assessed using Student’s t test. Change in alpha diversity from preg-nancy to postpartum in women with available samples from both time points was assessed using a mixed linear regression with a random effect of the subject, for only women with available samples at both time points. To test for differential change in alpha diversity metrics from pregnancy to postpartum in women with and with-out GDM, an ANOVA model was fitted with a two-way interaction between GDM status and time (factor with four levels) as the independent variable and the contrast Postpartum|Diabetic − Postpartum|Normoglycaemic − Pregnant|Diabetic + Pregnant|Normoglycaemic was tested using a post hoc t test. Models were fitted using restricted maximum likelihood, and assumptions were checked visually by inspection of residual plots (homo-scedasticity) and normal probability plots (Gaussian dis-tribution). Association between alpha diversity metrics and glycaemic traits (fasting and 2 h plasma glucose levels, insulin sensitivity and disposition index) was tested using linear regression with and without adjust-ment for pre-pregnancy BMI.
Analyses of community structure were performed using the vegan R packages. The cross-sectional differ-ence in community structure between women with and without GDM and between women with GDM diag-nosed by either fasting or stimulated hyperglycaemia or a combination of the two was assessed by permutational analysis of variance (PERMANOVA) of weighted Uni-Frac distances, as implemented in the adonis function. The association of glycaemic traits with community structure was also assessed using PERMANOVA of weighted UniFrac distances. Principal coordinate ordin-ation was performed using the capscalefunction of the vegan package, specifying an unconstrained model. Vec-tors of glycaemic traits were fitted onto the ordination using the envfit function. For longitudinal analyses of community structure, PERMANOVA models were fitted with permutations constrained within each individual. Differential change in community structure from preg-nancy to postpartum in women with and without GDM was assessed by contrasting the levels of the interaction between GDM status and time as described above.
mixed linear model ANOVA, as described for alpha di-versity metrics. For the longitudinal analyses, rarefied (10,000 sequences per sample) OTU abundances were added a pseudo count equal to the lowest non-zero abundance of each OTU and log transformed. Only the results significant at a 10% false discovery rate (ad
modumBenjamini-Hochberg) are reported.
At deeper taxonomic levels (biomarkers from phylum to genus level), we performed linear discriminant ana-lysis (LDA). Here, we applied LEfSe [26] with default pa-rameters (alpha value for Wilcoxon tests was set at 0.05, the logarithmic LDA score threshold set at 2.0) to iden-tify taxonomic biomarkers that characterise the differ-ences between women with and without GDM and between pregnant women of different weight categories (normal weight, overweight and obese).
To test the association of individual OTUs with weight gain during pregnancy, a negative binomial Wald test as implemented in the DESeq2 package was applied. Weight gain was adjusted for small variation in gesta-tional age by linear regression and discretiszed by a ter-tile split. A negative binomial model was then specified with weight gain tertiles as the explanatory variable and pre-pregnancy BMI as a covariate (due to a strong in-verse relationship between pre-pregnancy BMI and weight gain). Finally, the log2 fold difference in
abun-dance between the upper and lower weight gain tertile was tested using a post hoc Wald test to circumvent the assumption of constant fold change for each unit change of the independent variable. The association of individ-ual OTUs with glycaemic traits was tested using the same approach, contrasting the upper and lower tertiles of each trait, with and without adjustment for BMI.
The associations between deeper order taxa (phylum to genus level) and weight gain or glycaemic traits were tested using Spearman correlation of rarefied (10,000 reads) read counts with and without prior adjustment of the trait for pre-pregnancy BMI by linear regression. For weight gain, additional adjustment for gestational age by linear regression was performed prior to Spearman cor-relation analysis.
Results
Description of the study cohort
GDM was diagnosed in 50 of 213 women due to fasting (n= 25) or oral glucose-stimulated hyperglycaemia (n= 10) or a combination of the two (n= 15). As expected, markers of glucose and insulin homeostasis were higher in the GDM group compared with the group of normo-glycaemic women (Table 1). Similarly, the Matsuda index of insulin sensitivity was lower, and the HOMA index of insulin resistance is higher in GDM (Table 1). Women with GDM had indications of diminished beta
cell function as shown by lower insulinogenic index and disposition index. The women diagnosed with GDM had higher blood pressure (systolic 118 vs. 111 mmHg,P= 0. 0004; diastolic 71 vs. 67 mmHg, P= 0.001) and pre-pregnancy BMI (29.3 vs. 27.1 kg/m2, P= 0.02) whereas the two groups were comparable in age and height (Table1; Additional file2: Table S1).
More than 80% of women in either group took multi-vitamin supplements, and 2–3% took probiotic supple-ments (Additional file2: Table S1). The two groups were comparable in terms of overall dietary intake based on the distribution of macronutrients, Bristol stool scale score and bowel movement frequency (Table 1; Additional file2: Table S1; Additional file1: Figure S2).
The primary indication for referral to OGTT was BMI≥27 kg/m2 in both cohorts (50% in the GDM cohort and 46% in the normoglycaemic cohort). Overall, BMI≥27 kg/m2 as the indication for OGTT accounted for 46.9%, family history of type 2 diabetes accounted for 20.9% and a combination of risk factors for 18.5%. Glucosuria, polycystic ovarian syndrome and previous child with birth weight≥4500 g were indications in 1.9, 7.6 and 4.3% of the cases, respectively (Additional file2: Table S2).
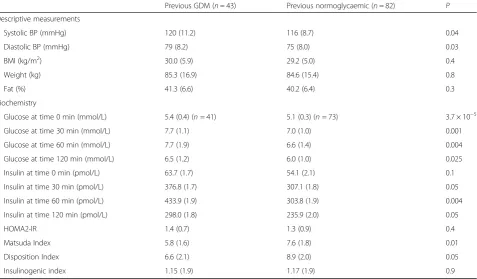
On an average of 8.8 months postpartum, 125 women were re-examined, 43 women with GDM and 82 women with normal glucose regulation during the preceding pregnancy (Table 2; Additional file 2: Table S3). Plasma glucose concentrations during OGTT were significantly higher in women with previous GDM. The group of women with previous GDM showed signs of insulin re-sistance featured by increased plasma insulin levels dur-ing the OGTT and decreased Matsuda index of insulin sensitivity and a relatively reduced insulin secretion by a decreased disposition index (Table 2). The two groups were comparable in markers of lipid metabolism, inflam-mation, dietary intake, breastfeeding, Bristol stool scale and bowel movements (Table2; Additional file2: Table S3; Additional file1: Figure S3). About 33–35% of the women took oral anticonceptives or had an intrauterine hormonal contraception at the time of follow-up (Table 2). Overall, dietary intake was significantly higher during pregnancy compared with postpartum using mixed models analyses (P< 0.05 in all tests) (Additional file2: Table S4). No differ-ences were shown in age, BMI or parity between the women participating in the postpartum examinations com-pared with the women who dropped out of the study.
Similar diversity and community structure in women with gestational diabetes and normal glucose regulation
third trimester of pregnancy (Additional file1: Figure S4). When regressing alpha diversity measures against gly-caemic traits, we found a nominally significant association (P= 0.02) between the number of observed OTUs and beta cell function represented by the disposition index, but the association was insignificant at a 10% false discov-ery rate (FDR) (Q= 0.2) (Additional file1: Figure S5).
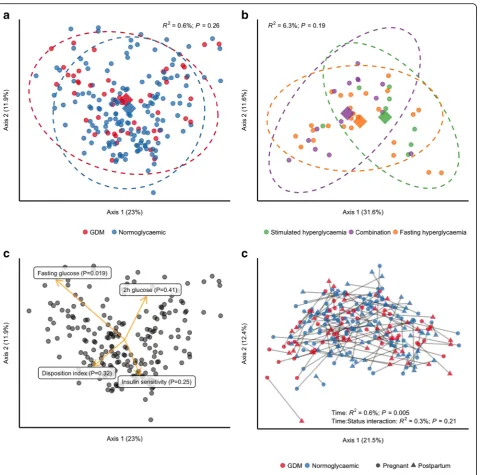
We also tested if GDM was associated with the overall community structure and found no difference in un-weighted UniFrac distances (R2= 0.6%;P= 0.26) between women with GDM and women with normal glucose regulation (Fig. 1a). As fasting hyperglycaemia and stimulated hyperglycaemia reflect two different pathophysiological processes [27], we also tested whether community structure differed in women with GDM diagnosed by either fasting or stimulated hyperglycaemia or a combination of the two, but we did
not see any such association (Fig. 1b). However, when testing the association between fasting and stimulated glucose concentrations during pregnancy, we found a weak, nominally significant association between fasting plasma glucose levels and unweighted UniFrac distances (R2= 1.0%; P= 0.037; Fig. 1c), but no association with stimulated 2-h plasma glucose level, insulin sensitivity or disposition index.
Taxonomic biomarkers of gestational diabetes
Compositionally, the gut microbiota of the total group of pregnant women was dominated by members of the two major bacterial phyla Firmicutes and Bacteroidetes, which on average accounted for ~ 90% of all reads (Additional file1: Figures S6 and S7). At the genus level, the composition followed a typical westernised pattern
Table 1Clinical variables of GDM and normoglycaemic women in the third trimester pregnancy
GDM (n= 50) Normoglycaemic (n= 161) P
Descriptive measurements
Age (years) 34.4 (4.4) 33.3 (4.6) 0.1
Gestational week at examination 28.7 (1.4) 28.4 (1.1) 0.1
Systolic BP (mmHg) 118 (11.2) 111 (10.6) 0.001
Diastolic BP (mmHg) 71 (8.1) 67 (8.5) 0.001
Height (cm) 168.6 (6.6) 169.7 (5.6) 0.2
Weight (kg) 91.8 (14.1) 87.3 (14.6) 0.06
Pre-pregnancy weight (kg) (n= 190) 83.5 (16.0) (n= 43) 78.48 (15.2) (n= 145) 0.06
Pre-pregnancy BMI kg/m2(n= 189) 29.3 (5.6) (n= 43) 27.1 (4.8) (n= 144) 0.02
Weight gain (kg) 7.4 (4.7) 8.8 (7.5) 0.3
Normal and excessive weight gain (n) 3 excessive (13.0%) 20 normal (87.0%)
17 excessive (16.2%) 88 normal (83.8%)
1
Biochemistry
Glucose at time 0 min (mmol/L) 5.2 (0.4) 4.6 (0.2) 5.8 × 10⁻³¹
Glucose at time 30 min (mmol/L) 8.1 (1.0) 6.9 (0.9) 2.7 × 10⁻¹²
Glucose at time 60 min (mmol/L) 8.9 (1.3) 7.1 (1.2) 1.9 × 10⁻¹⁵
Glucose at time 120 min (mmol/L) 7.9 (1.4) 6.2 (1.0) 5.0 × 10⁻¹⁷
Insulin at time 0 min (pmol/L) 112.1 (40.6) 82.7 (39.6) 3.3 × 10⁻⁵
Insulin at time 30 min (pmol/L) 519.7 (1.6) 504.3 (1.7) 0.7
Insulin at time 60 min (pmol/L) 698.0 (1.8) 583.9 (1.7) 0.058
Insulin at time 120 min (pmol/L) 750.5 (1.8) 482.2 (1.7) 6.3 × 10⁻⁶
HbA1c (mmol/mol) 34.0 (3.1) 33.0 (2.8) 0.02
HOMA-IR 2.1 (0.8) 1.5 (0.7) 1.3 × 10⁻⁶
Matsuda index 3.5 (1.5) 5.3 (1.6) 3.0 × 10⁻⁸
Disposition index 4.1 (1.6) 7.8 (1.6) 9.2 × 10⁻¹²
Insulinogenic index 1.2 (1.6) 1.5 (1.6) 0.004
hsCRP (mg/L) 4.4 (1.9) 3.8 (2.2) 0.2
Data presented as mean (SD). For continuous variables,Pwas calculated by two-tailedttest, and for categorical variables,Pwas calculated by chi-square test or Fisher’s exact test
with Bacteroides as the predominant genus in women with gestational diabetes and normal glucose regulation alike (> 10% of all reads) and Faecalibacterium, Prevo-tella and unclassified Lachnospiraceae each accounting for > 5% of all reads on average, albeit as expected with substantial inter-individual variation (Additional file 1: Figure S8).
Using linear discriminant analyses, we identified phylum Actinobacteria and several subordinate taxa as taxonomic biomarkers of GDM (Fig. 2a, b): genus
Collinsella and the parent family Coriobacteriaceae
and parent order Coriobacteriales; genus Rothia and the parent family Micrococcaceae and parent order
Actinomycetales; and genus Actinomyces, also of order
Actinomycetales. Within the phylum Proteobacteria,
the genus Desulfovibrio was a biomarker of GDM. Within Firmicutes, the genus Leuconostoc and parent family Leuconostocaceae, genus Granulicatella and genus Mogibacterium were biomarkers of GDM, whereas the genera Marvinbryantia, Acetivibrio and
Anaerosporobacter were markers of normal glucose
regulation.
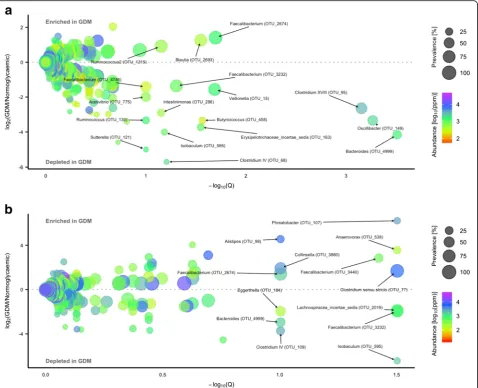
Using a negative binomial Wald test, we identified 17 species-level OTUs, predominantly within Firmicutes
(15 out of 17), which in the third trimester were differ-entially abundant in women with GDM and women with
normal glucose regulation at a false discovery rate of 10%. Three OTUs assigned to Blautia (OTU_2693),
Ruminococcus (of family Lachnospiraceae; OTU_1215)
and Faecalibacterium (OTU_ 2674) were enriched in
women with gestational diabetes. In contrast, 14 OTUs assigned to Acetivibrio (OTU_775), Intestinimonas
(OTU_286), Erysipelotrichaceae incertae sedis (OTU_ 163),Isobaculum(OTU_595),Butyricicoccus(OTU_458) , Clostridium IV (Ruminococcaceae; OTU_68), Clostrid-ium XVIII (Erysipelotrichaceae; OTU_95), Oscillibacter
(OTU_149), Ruminococcus (Ruminococcaceae; OTU_ 130), Bacteroides (OTU_4999), Veillonella (OTU_15) andSuterella(OTU_121) and two assigned to
Faecalibac-terium (OTU_3232 and OTU_4746) were depleted in
women with GDM (Fig.3a; Additional file2: Table S5).
Association of microbial composition with glycaemic traits and inflammatory marker
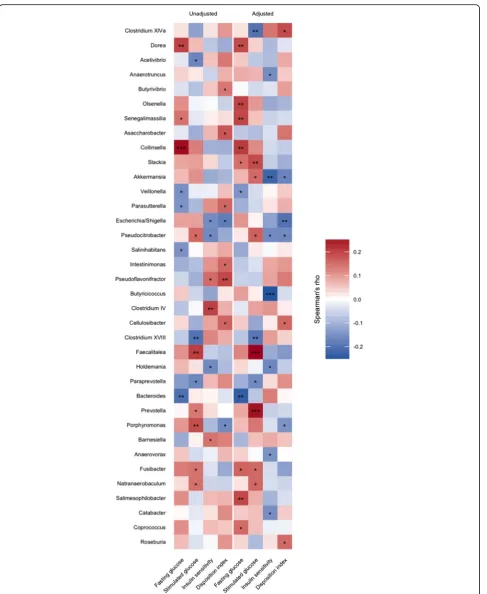
We used Spearman correlation to identify deeper level taxa associated with glycaemic traits in pregnant women regardless of diabetes status and found that genus Col-linsella and all parent taxa within Actinobacteria were positively correlated with fasting plasma glucose, but the association was abolished when adjusting for pre-pregnancy BMI (Fig. 4). BMI adjustment did, however, reveal a negative association between Butyricicoccusand
Table 2Clinical variables of GDM and normoglycaemic women at postpartum approximately 8 months after delivery
Previous GDM (n= 43) Previous normoglycaemic (n= 82) P
Descriptive measurements
Systolic BP (mmHg) 120 (11.2) 116 (8.7) 0.04
Diastolic BP (mmHg) 79 (8.2) 75 (8.0) 0.03
BMI (kg/m2) 30.0 (5.9) 29.2 (5.0) 0.4
Weight (kg) 85.3 (16.9) 84.6 (15.4) 0.8
Fat (%) 41.3 (6.6) 40.2 (6.4) 0.3
Biochemistry
Glucose at time 0 min (mmol/L) 5.4 (0.4) (n= 41) 5.1 (0.3) (n= 73) 3.7 × 10⁻⁵
Glucose at time 30 min (mmol/L) 7.7 (1.1) 7.0 (1.0) 0.001
Glucose at time 60 min (mmol/L) 7.7 (1.9) 6.6 (1.4) 0.004
Glucose at time 120 min (mmol/L) 6.5 (1.2) 6.0 (1.0) 0.025
Insulin at time 0 min (pmol/L) 63.7 (1.7) 54.1 (2.1) 0.1
Insulin at time 30 min (pmol/L) 376.8 (1.7) 307.1 (1.8) 0.05
Insulin at time 60 min (pmol/L) 433.9 (1.9) 303.8 (1.9) 0.004
Insulin at time 120 min (pmol/L) 298.0 (1.8) 235.9 (2.0) 0.05
HOMA2-IR 1.4 (0.7) 1.3 (0.9) 0.4
Matsuda Index 5.8 (1.6) 7.6 (1.8) 0.01
Disposition Index 6.6 (2.1) 8.9 (2.0) 0.05
Insulinogenic index 1.15 (1.9) 1.17 (1.9) 0.9
Data presented as mean (SD) and range. For continuous variables,Pwas calculated by two-tailedttest, and for categorical variables,Pwas calculated by chi-square test or Fisher’s exact test. Two women from the GDM group only had fasting blood samples taken at the follow-up visit. Eleven samples of fasting glucose were coagulated and rejected by the department investigating glucose
insulin sensitivity (r=−0.12; Q= 0.08) and positive cor-relations between stimulated 2-h plasma glucose level and Prevotella (r= 0.25; Q= 0.03) and Faecalitalea (r
= 0.26; Q= 0.03). Also, associated with lower insulin sensitivity after adjustment for BMI were order
Verrucomicrobiales and all parent taxa within
Fig. 1Community structure in women with and without gestational diabetes. For all analyses, samples were rarefied to an equal sequencing depth of 10,000 reads prior to principal coordinate (PCo) ordination based on weighted UniFrac distances.aSamples from pregnant women in the third trimester with (n= 50) or without (n= 157) gestational diabetes. Points are individual samples, and diamonds represent the average ordination scores and ellipses the 95% confidence intervals of a multivariate normal distribution of either group.R2and
Pare from the permutational multivariate analysis of variance (PERMANOVA) as implemented in theadonisfunction of the vegan R package.bCommunity structure in pregnant women with gestational diabetes diagnosed by fasting hyperglycaemia (n= 25) or stimulated hyperglycaemia (2 h after an oral glucose challenge;n= 8), respectively, or by both (n= 15). Configuration is similar to panela.cThe association between glycaemic traits and community structure during pregnancy regardless of GDM status as determined by PERMANOVA. Vectors representing direction and magnitude of each trait were fitted onto the first and second PCo axes using theenvfitfunction of the vegan R package.dChange in community structure from pregnancy to postpartum. Only samples from women examined at both time points are included (n= 43 andn= 79 for women with and without GDM, respectively).R2and
Verrucomicrobia. Akkermansia, the dominant genus within Verrucomicrobiales, was nominally associated with lower insulin sensitivity (r=−0.22; P= 0.003) ad-justed for BMI, but the association was not significant at a 10% FDR (Q= 0.154).
In order to identify species-level OTUs associated with glycaemic traits, we divided the samples into tertiles ac-cording to the fasting plasma glucose level, stimulated 20-h plasma glucose level, insulin sensitivity index
(Matsuda) and disposition index (as a measure of insulin sensitivity adjusted beta cell function) and contrasted the upper and lower tertiles of each trait. We identified 50 significant associations (FDR 10%) between 42 unique OTUs and the 4 glycaemic traits (Additional file 2: Table S6; Additional file1: Figure S9). Nineteen were associated with stimulated 2-h plasma glucose level, 13 with insulin sensitivity and disposition index, respectively, and 5 were associated with a fasting plasma glucose level. Four OTUs
assigned to the genus Blautia (OTU_2383, OTU_3654, OTU_140, OTU_2684) were associated with higher stim-ulated 2-h plasma glucose level. One of the four Blautia
phylotypes (OTU_2383) was also associated with a higher fasting plasma glucose level and lower insulin sensitivity and disposition index, a pattern that was shared by the other threeBlautiaOTUs (OTU_3654, OTU_140, OTU_ 2684). One Blautia phylotype (OTU_486) exhibited the exact opposite pattern, being associated with lower fasting and stimulated 2-h plasma glucose levels and higher insu-lin sensitivity. Three Escherichia/Shigella phylotypes (OTU_680, OTU_361, OTU_3) were associated with higher disposition index and exhibited an identical pattern
for the remaining traits (lower insulin sensitivity and higher fasting and stimulated 2-h plasma glucose levels).
Due to the strong association between pre-pregnancy obesity and microbial composition, we repeated the tests adjusting for pre-pregnancy BMI. Only ten associations between nine unique OTUs and the four glycaemic traits remained significant after the adjustment (Additional file2: Table S6; Additional file 1: Figure S10). Notably, none of the 19 OTUs associated with stimulated 2-h plasma glu-cose level withstood the adjustment. Similarly, for insulin sensitivity, only 3 out of 13 associations remained; all three OTUs were associated with higher insulin sensitivity. Adjusting for pre-pregnancy BMI did, however, reveal
several associations not previously detected, most of which involvingClostridialesspecies (12 of 17) and fasting plasma glucose level (10 of 17), including one
Christense-nella OTU (OTU_63) which was associated with higher
fasting plasma glucose concentration. The strongest asso-ciation, however, was between a Clostridium IV OTU (OTU_68) and lower 2-h plasma glucose level (log2 fold
difference =−25.45;Q= 1.1 × 10⁻²⁶).
As the late pregnancy is defined as a pro-inflammatory state [1,28], we wanted to investigate if differential taxa correlated with plasma levels of high-sensitive C-reactive protein (hsCRP) in pregnancy and postpartum, regard-less of metabolic status. We used Spearman correlation to identify associations with higher order taxa; however, none of the findings withstood the adjustment for mul-tiple testing (Additional file 2: Table S7). As with the maternal glycaemic traits, we divided the levels of plasma hsCRP into tertiles and contrasted the upper ter-tile to the lower in order to identify species-level OTUs that associated with plasma hsCRP during pregnancy and postpartum (Additional file 2: Table S8). Interest-ingly, Bacteroides (OTU_4999) both during pregnancy and postpartum is associated with higher levels of plasma hsCRP, whereasAlistipes (OTU_98) and
Anaero-vorax (OTU_538) are associated with lower levels of
plasma hsCRP at both time points.
Partial confounding effect of BMI
Overweight and obesity are known risk factors for GDM [29], and increased BMI has been associated with gut microbiota disruption in both pregnant [30, 31] and non-pregnant women [32]. In light of this and the over-representation of obesity among women with gestational diabetes (46.5 vs. 27.0% of women with normal glucose regulation (Additional file 1: Figure S11) in our cohort, we looked for microbial biomarkers of excess body weight in order to assess the potential confounding ef-fect of BMI.
Comparing pregnant women with pre-pregnancy BMI within the overweight range (25–29.9 kg/m2) to women with normal (< 25 kg/m2) pre-pregnancy BMI, we
identi-fied Parabacteroides and Porphyromonas as biomarkers
of overweight (Additional file 1: Figure S12), whereas
Akkermansiaand all parent taxa withinVerrucomicrobia
were markers of normal weight, as were the genera
Eggerthella andSporobacter, as well as genera Ethanoli-genensandClostridium XVIII(Erysipelotrichaceae).
Comparing pregnant women with pre-pregnancy obes-ity (BMI ≥ 30 kg/m2) to women with normal (< 25 kg/ m2) pre-pregnancy BMI identified the genera
Porphyro-monas, Acidaminococcus and Ruminococcus (
Lachnos-piraceae) as markers of obesity and the genera
Ethanoligenens, Sporobacter, and Eggerthella, as well as an unclassified Erysipelotrichaceae genus, as markers of
normal weight. Notably, there was no overlap between the taxonomic biomarkers of GDM and the markers of overweight and obesity.
Disregarding the weight categories by correlating ppregnancy BMI with taxa abundances confirmed the re-sults, showing that genus Acetivibrio (r=−0.16; P= 0. 03) and genus Leuconostoc (r= 0.15; P= 0.04) were the only GDM discriminant taxa nominally associated with pre-pregnancy BMI (Additional file2: Table S9).
At OTU level, we primarily found that OTUs are dif-ferentially abundant comparing women with pre-pregnancy normal weight to women that were obese pre-pregnancy. Ten OTUs were enriched in the obese women, and 12 OTUs were depleted compared to pre-pregnancy lean women. Only three OTUs showed differ-ential abundance between pre-pregnancy lean women and pre-pregnancy overweight women (Additional file2: Table S10; Additional file1: Figure S13).
At OTU level, adjusting for ppregnancy BMI re-duced the number of differentially abundant OTUs to five, two of which were enriched in women with GDM and three of which were depleted (Additional file 2: Table S11; Additional file 1: Figure S14). Of those enriched in women with GDM in the full cohort, only one assigned toFaecalibacterium(OTU_2674) remained after the adjustment, whereas two depleted in women with GDM, both assigned toVeillonella(OTU_1626 and OTU_15), remained. One OTU assigned to Anaerotrun-cus (OTU_674) was enriched in women with GDM fol-lowing adjustment for pre-pregnancy BMI, and another OTU assigned to Clostridium (sensu stricto) (OTU_ 1712) was depleted, neither of which were among the OTUs differentially abundant in the full cohort. They were, however, differentially abundant in the subcohort of women with known pre-pregnancy BMI (43 with GDM and 143 with normal glucose regulation) in which the adjusted analyses were conducted (Additional file2: Table S11; Additional file1: Figure S14A).
Adjusting for BMI did not affect the comparison of alpha diversity measures between women with GDM and with normal glucose regulation (P= 0.40, 0.81 and 0. 86 for observed OTUs, Shannon’s diversity and Pielou’s evenness, respectively). Besides abolishing the nominal association between disposition index and observed OTUs, and revealing a nominally significant association between observed OTUs and post-load 2-h glucose level, adjusting for pre-pregnancy BMI had only a minor effect on the relationship between glycaemic traits and alpha diversity measures (Additional file1: Figure S15).
Third trimester gut microbiota associated with weight gain during pregnancy
cohort, women gained on average 8.7 ± 3.8 kg (mean ± SD) leading up to the first visit during the third trimester, with no difference between women with GDM and women with normal glucose regulation (1.08 kg; 95%CI −0.14–2.29) when adjusting for pre-pregnancy BMI and gestational age. Disregarding diabetes status, we identified 11 OTUs, mostly Clostridiales (7 of 11) species, associated with gestational weight gain. Seven OTUs were associated with lower weight gain, including
aChristensenellaOTU (OTU_63) and anAlistipes OTU
(OTU_128). Four OTUs were associated with higher weight gain, including an Eisenbergiella OTU (OTU_ 258) and a Lactobacillus OTU (OTU_80) (Add-itional file 2: Table S12). Nine higher order taxa, pre-dominantly Firmicutes (8 of 9), where associated with gestational weight gain at a nominal significance thresh-old. Among these, the genera Coprococcus, Roseburia,
ButyricicoccusandClostridium(sensu stricto) were posi-tively correlated, andFusibacter,Holdemaniaand an un-classified Erysipelotrichaceae genus were inversely correlated (Additional file 2: Table S13), yet none with-stood correction for multiple testing.
Changes in diversity, community structure and composition from pregnancy to postpartum
At an average of 8.8 months postpartum, 125 women were re-examined of which 43 women with previous GDM and 79 women with normal glucose regulation
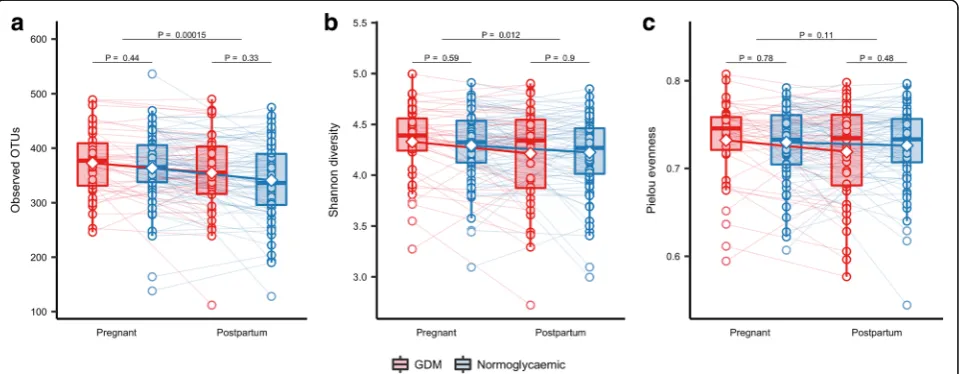
pregnancies volunteered stool samples. Similar to the third trimester, we did not see any difference in alpha di-versity (observed OTUs, Shannon’s diversity and Pielou’s evenness) between women with preceding GDM and preceding normal pregnancy (Fig. 5). However, when studying the changes from pregnancy to postpartum using linear mixed regression modelling and accounting for the repeated nature of measurements performed on the same individual over time, we found a statistically significant reduction in the number of observed OTUs (P= 0.0002) and Shannon’s diversity (P= 0.012) irre-spective of diabetes status (Fig. 5). Still, there was no change in Pielou’s evenness index (P= 0.11). Similarly, for beta diversity, we found a small significant change in community structure as represented by weighted Uni-Frac distances (R2= 0.6%; P= 0.005) and unweighted UniFrac distances (R2= 0.5%; P= 0.001), irrespective of diabetes status. Principal coordinate ordination showed that the variation over time did not reflect a uniform structural shift, but individual changes in community structure (Fig. 1d), changes which were independent of diabetes status.
Applying linear discriminant analyses, we identified the genera Collinsella and Olsenella and all parent taxa within phylum Actinobacteriaas biomarkers of previous GDM. Genus Clostridium sensu stricto and the parent family Clostridiaceae_1, as well as the genera Hafnia,
Howardella and Dehalobacter, were also biomarkers of
previous GDM, whereas Fusobacterium and the parent
family Fusobacteriaceae and genus Ruminococcus2
(Ruminococcus of family Lachospiraceae) were markers of a previous normoglycaemic pregnancy (Fig.2c, d).
Postpartum, we identified 13 OTUs, which were differ-entially abundant in women with preceding GDM and women with a normal glucose regulation pregnancy. Seven OTUs were enriched in women with previous GDM, including two Faecalibacterium OTUs, one of which (OTU_2674) was also enriched in women with GDM during pregnancy. Six OTUs were depleted post-partum in women with preceding GDM compared with women with a previous normal glucose regulation preg-nancy, including aFaecalibacterium(OTU_3232), a
Bac-teroides (OTU_4999), and an Isobaculum OTU (OTU_
595), which were also depleted in women with GDM during pregnancy (Fig.3b).
Using linear mixed regression model, we identified six OTUs which exhibited a differential change from
antepartum to postpartum in women with preceding GDM and normal pregnancy at a 10% FDR. Compared with abundances during pregnancy, four OTUs assigned
to Bavariicoccus (OTU_431), Clostridium sensu stricto
(OTU_77), Bacteroides (OTU_138) and Veillonella
(OTU_1626), respectively, were enriched postpartum in women with gestational diabetes but less abundant postpartum in women with normal glucose regulation. Contrastingly, two OTUs assigned to Ruminococcus
(OTU_152) (Lachnospiraceae) and Oscillibacter
(OTU_371) were depleted postpartum in women with GDM but enriched in women with a preceding nor-mal pregnancy (Fig. 6; Additional file 2: Table S14). Seven higher order taxa, including the genera Rumi-nococcus (Lachnospiraceae), Romboutsia, Clostridium
(sensu stricto), Alloprevotella,Veillonella, Hydrogenoa-naerobacterium and Coprobacillus, exhibited differen-tial change at a nominal significance threshold, but
none withstood the correction for multiple testing (Additional file 2: Table S15).
Discussion
Our study of women with GDM and normoglycaemic pregnant women demonstrated that GDM diagnosed in late pregnancy is associated with an aberrant gut micro-bial composition at the time of diagnosis. About 8 months postpartum, the gut microbiota of previous GDM women is still different from women who had a normal pregnancy.
Interestingly, we found that OTU richness was higher during late pregnancy compared with postpartum. Late normal pregnancy is characterised by increased insulin resistance and increased circulating levels of pro-inflammatory cytokines [1]. A reduced richness of intes-tinal microbiota has previously been associated with ele-vated pro-inflammatory markers and insulin resistance [34]. Our findings of higher alpha diversity in late preg-nancy compared with postpartum could be influenced by the difference in diet during pregnancy compared with postpartum, as changes in nutrient composition and caloric intake are known to affect gut microbiota in humans [35, 36]. Expectedly, total energy intake was lower in postpartum regardless of GDM status, but we did not observe any major difference in the composition of relative macronutrients intake between late pregnancy and postpartum. During a short-term intervention based on high-protein, energy-restricted diet, Cotillard and colleagues observed an increase in gene richness, al-though only in individuals with low gene count at base-line [37]. Their findings suggested an antecorrelation between energy intake and microbial richness, opposite to the direction of effect observed in the present study, when considering changes from late pregnancy to post-partum. Similarly, results from a population-based Finish study showed a positive correlation between OTU rich-ness and HbA1c levels [38], also opposite to the direc-tion of effect observed in the present study. Although an effect of changes in diet and host metabolism cannot be ruled out, these results suggest the involvement of other factors in determining the change in microbial richness. One such factor could be the host immune system, which undergoes complex changes in the postpartum period [39].
So far, comparisons of intestinal microbiota during pregnancy and postpartum have not shown any differ-ences in the abundance of taxa [8]. During a period of 3–16 months postpartum, it has been reported that 42 women with previous GDM had a relative lower abun-dance ofFirmicutes, but this study did not have samples during pregnancy to compare with [40]. Firmicuteshas also been seen in low abundance in cohorts of type 2 diabetes patients [6,41].
Our findings suggest that gut microbiota of women with GDM have similarities with the microbiota re-ported in patients with type 2 diabetes and associated intermediary metabolic traits. For instance, the genus
Desulfovibriois enriched in patients with type 2 diabetes [6,7]. Furthermore, the genusCollinsellahas been asso-ciated with increased fasting levels of insulin and HOMA-IR in normoglycaemic pregnancies and is enriched in non-pregnant patients with type 2 diabetes [42, 43]. Collinsellahas also been shown to decrease in abundance concurrent with a diet-induced weight loss in overweight individuals [44]. In infants, an increase in the abundance ofCollinsellafrom birth to 6 months of age was associated with an increase in adiposity at 18 months of age [45].
Collinsellawas also enriched in abundance of the gut microbiota postpartum in women with previous GDM, making the taxon a potential candidate in the search for bacteria that might contribute to later development of type 2 diabetes. Similarly, species ofBacteriodes,
Faecali-bacterium and Isobaculum were depleted in both third
trimester and postpartum in women with GDM, and like
Collinsella, these species could contribute to the long-term risk of type 2 diabetes in women with GDM.
At OTU level, reduced abundance ofFaecalibacterium
has previously been reported in the third trimester of healthy pregnant women [8]. In non-pregnant adults with metabolic syndrome and type 2 diabetes, F. praus-nitzii is reported to be depleted as well [42, 46]. In the present study, we found Faecalibacterium OTUs both enriched and depleted in pregnant women with GDM. After adjustmen for pre-pregnancy BMI, we found an enrichment of one species assigned to Faecalibacterium
in our GDM cohort. Furthermore, during pregnancy species ofFaecalibacterium presented divergent associa-tions with hsCRP, suggesting that different strains of
Faecalibacterium are involved. An issue which can only be addressed by applying shot-gun sequencing-based metagenomics.
Blautia has been shown to be present with enriched
abundance in glucose-intolerant individuals [47] and to be associated with metabolites reflecting an unhealthy metabolic state in individuals with a high BMI [38]. These findings are much in line with our results showing increased abundances associated with GDM, suggesting that enriched Blautia abundance goes together with a non-favourable metabolic profile. However, during preg-nancy we found two species of Blautia associated with lower levels of plasma hsCRP, pointing to the occurrence of various subspecies of Blautiawith opposite function-ality related to host metabolism.
enriched in type 2 diabetic patients [42], and
Ruminococ-cus gnavus has been reported to be enriched in people
with dysmetabolism and low microbial gene count [34]. Unexpectedly, we found that at the postpartum stage, the relative abundance of Ruminococcus2 species de-creased in the GDM group compared with the normo-glycaemic group.
Investigating the relationships of metabolic traits and microbial taxa across groups led us to a surprising dis-covery ofAkkermansia being associated with lower esti-mates of whole-body insulin sensitivity. Akkermansia
has previously been reported to associate with improved metabolic health and to be inversely correlated to fasting plasma glucose and positively with insulin sensitivity [48–50]. In rodents, probiotics supplementation with
Akkermansia improved glucose tolerance and insulin
sensitivity [51]. Our results suggest that Akkermansia
might have another impact on host physiology during pregnancy than otherwise described or that we find an-other subspecies ofAkkermansia. The applied 16S rRNA gene amplicon sequencing methods does, however, not make it possible to investigate this finding at a deeper taxonomic resolution.
Christensenellais known to be highly heritable and to associate with low BMI [52]. Low abundance of Chris-tensenella has been linked to a pre-diabetic health state and has also been associated with increased levels of acetate [38], a short chain fatty acid with an uncertain involvement in host metabolism and appetite regulation [53,54]. In a rodent model, germ-free transplantation of
Christensenella indicated a protective effect against
weight gain [52]. We found that an OTU assigned to
Christensenella was associated with higher fasting
plasma glucose concentration, but the same Christense-nellaOTU was associated with lower weight gain during pregnancy. At the postpartum stage, a species of
Chris-tensenella was associated with lower levels of plasma
hsCRP. All together, the findings suggest similarities be-tween the features of Christensenella in pregnant and non-pregnant adults, but also different direction of asso-ciation between abundance of Christensenella and host metabolic and inflammation phenotypes, indicating that
the Christensenella species found in our study by 16S
rRNA gene amplicon sequencing might not reflect the entire spectrum of taxa in the Christensenellaceae
family.
When testing the association between different species and glucose metabolism, only a few OTUs were associ-ated with different glycaemic traits. However, the four glycaemic traits used in our study represent different as-pects of glucose metabolism [27], and physiologically there is no imperative requirement of overlap in features associated with different aspects of glucose metabolism. The fact that we only see a moderate overlap in OTUs
associated with different glycaemic traits is not surpris-ing, and might even be expected, given the different physiological features they represent.
Gut microbial communities are known to be affected by diet and weight in non-pregnant hosts [32, 37, 55]. The intestinal microbiota during pregnancy is associated with pre-pregnancy BMI as well as weight gain [30,31]. When adjusting for pre-pregnancy BMI, we similarly demonstrated relationships between body composition and gut microbiota also during pregnancy. Our results confirm previous findings with enrichment of
Bacter-oides species in overweight pregnant women [31] and
Akkermansia enriched in normal weight pregnant
women [30,31]. There was no overlap in taxonomic bio-markers of GDM with bio-markers of overweight or obesity even though overweight is a risk factor for the develop-ment of GDM [29]. In our study, species assigned to
Christensenella and Alistipes were associated with low weight gain and Eisenbergiella and Lactobacillus were associated with higher weight gain during pregnancy. This finding is concurrent with the findings in non-pregnant individuals as strains of Eisenbergiella and
Lactobacillus reuteri have previously been associated
with obesity [56,57]. Of the taxa differentially abundant in women with and without GDM, only two were signifi-cantly correlated with pre-pregnancy BMI and only weakly so, indicating that the observed compositional differences were not strongly confounded by pre-pregnancy BMI.
To our knowledge, this is the first study investigating the gut microbiota composition at the time of GDM diagnosis. A few studies with few participants have ex-amined gut microbiota either weeks before or after GDM diagnosis [8, 58]. Uniquely, for the present proto-col, we could compare gut microbiota in the third tri-mester with postpartum samples allowing identification of taxa that exhibited differential abundance at the two time points according to maternal metabolic status dur-ing pregnancy. Another strength of the present protocol is that the gut microbiota of study participants was not confounded by antidiabetic drugs, a challenge recently demonstrated in microbiota studies of patients with type 2 diabetes [59]. A limitation of our study was that we did not have faecal samples before pregnancy. Also, our suggestion of subspecies occurrence with divergent func-tionalities calls for future shotgun-based sequencing studies of the intestinal microbiome in GDM.
Conclusion
with type 2 diabetes and associated intermediary meta-bolic dysfunctions. Outside pregnancy, at an average of 8.8 months after delivery, we still saw an aberrant intes-tinal microbiota of women with previous GDM. Pro-spective studies are warranted to explore whether such microbiota disruption conveys an increased risk of de-veloping type 2 diabetes.
Additional files
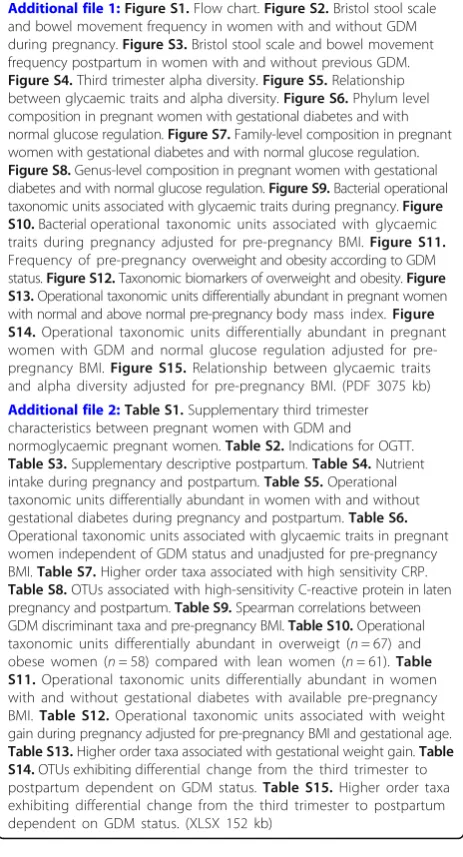
Additional file 1:Figure S1.Flow chart.Figure S2.Bristol stool scale and bowel movement frequency in women with and without GDM during pregnancy.Figure S3.Bristol stool scale and bowel movement frequency postpartum in women with and without previous GDM. Figure S4.Third trimester alpha diversity.Figure S5.Relationship between glycaemic traits and alpha diversity.Figure S6.Phylum level composition in pregnant women with gestational diabetes and with normal glucose regulation.Figure S7.Family-level composition in pregnant women with gestational diabetes and with normal glucose regulation. Figure S8.Genus-level composition in pregnant women with gestational diabetes and with normal glucose regulation.Figure S9.Bacterial operational taxonomic units associated with glycaemic traits during pregnancy.Figure S10.Bacterial operational taxonomic units associated with glycaemic traits during pregnancy adjusted for pre-pregnancy BMI.Figure S11. Frequency of pre-pregnancy overweight and obesity according to GDM status.Figure S12.Taxonomic biomarkers of overweight and obesity.Figure S13.Operational taxonomic units differentially abundant in pregnant women with normal and above normal pre-pregnancy body mass index.Figure S14.Operational taxonomic units differentially abundant in pregnant women with GDM and normal glucose regulation adjusted for pre-pregnancy BMI.Figure S15.Relationship between glycaemic traits and alpha diversity adjusted for pre-pregnancy BMI. (PDF 3075 kb)
Additional file 2:Table S1.Supplementary third trimester characteristics between pregnant women with GDM and normoglycaemic pregnant women.Table S2.Indications for OGTT. Table S3.Supplementary descriptive postpartum.Table S4.Nutrient intake during pregnancy and postpartum.Table S5.Operational taxonomic units differentially abundant in women with and without gestational diabetes during pregnancy and postpartum.Table S6. Operational taxonomic units associated with glycaemic traits in pregnant women independent of GDM status and unadjusted for pre-pregnancy BMI.Table S7.Higher order taxa associated with high sensitivity CRP. Table S8.OTUs associated with high-sensitivity C-reactive protein in laten pregnancy and postpartum.Table S9.Spearman correlations between GDM discriminant taxa and pre-pregnancy BMI.Table S10.Operational taxonomic units differentially abundant in overweigt (n= 67) and obese women (n= 58) compared with lean women (n= 61).Table S11.Operational taxonomic units differentially abundant in women with and without gestational diabetes with available pre-pregnancy BMI.Table S12.Operational taxonomic units associated with weight gain during pregnancy adjusted for pre-pregnancy BMI and gestational age. Table S13.Higher order taxa associated with gestational weight gain.Table S14.OTUs exhibiting differential change from the third trimester to postpartum dependent on GDM status.Table S15.Higher order taxa exhibiting differential change from the third trimester to postpartum dependent on GDM status. (XLSX 152 kb)
Abbreviations
BMI:Body mass index; DNA: Deoxyribonucleic acid; GDM: Gestational diabetes mellitus; HOMA-IR: Homeostatic model of insulin resistance; hsCRP: High-sensitive C-reactive protein; IADPSG: International Association of the Diabetes and Pregnancy Study Group; LEfSe: Linear discriminant analysis effect size; OGTT: Oral glucose tolerance test; OTU: Operational taxonomic unit; rRNA: Ribosomal RNA gene
Acknowledgements
The authors would like to thank N. B. Søndertoft, A. Forman, T. Lorentzen, M. Nielsen and G. Klavsen for the technical assistance and K. Kaadtmann, P. Sandbeck, T. Bryrup and G. Lademann for the managerial assistance. The authors thank the Department of Foetal Medicine, Herlev Hospital, for providing the ultrasound machine and T. Andersen for the managerial assistance and J. Lykke for managerial assistance at Hvidovre Hospital. The Novo Nordisk Foundation Center for Basic Metabolic Research is an independent Research Centre at the University of Copenhagen partially funded by an unrestricted donation from the Novo Nordisk Foundation (http://metabol.ku.dk/).
Funding
The project has received financial support from Novo Nordisk Foundation Center of Metabolic Research, Section of Metabolic Genetics, Maersk Foundation, Augustinus Foundation and Aase and Ejnar Danielsens Foundation. None of the funding sources influenced the study design, data collection, data management, data analyses or reporting.
Availability of data and materials
The datasets generated and/or analysed during the current study is available from the corresponding author on reasonable request.
Authors’contributions
MKWC conceived and conducted the study and performed the analyses, interpretation of results and drafting of the manuscript. THH performed the analyses, interpretations of the result and drafting of the manuscript. TN and KHA assisted with the interpretation of the results and drafting of the manuscript. JL and PD conceived the study and assisted in drafting the manuscript. FAH handled the faecal sample in regard to amplification and sequencing. MCR performed the sequencing and quality control of data. AF, HV, NRJ, CR, OBC and TH assisted in drafting the manuscript. OP conceived the study concept and assisted with the interpretation of the results and drafting of the manuscript. All authors have read and approved the final manuscript.
Ethics approval and consent to participate
The study was approved by the Ethical Committees of the Capital Region of Denmark (Protocol #H-4-2013-10) and conducted in accordance with the principles of the Declaration of Helsinki II. Written informed consent was obtained from all participants.
Competing interests
The authors declare that they have no competing interests.
Publisher’s Note
Springer Nature remains neutral with regard to jurisdictional claims in published maps and institutional affiliations.
Author details
Hospital, Blegdamsvej 9, 2100 Copenhagen Ø, Denmark.12Department of Obstetrics and Gynaecology, Aalborg University Hospital, Reberbansgade, 9000 Aalborg, Denmark.13Department of Obstetrics and Gynaecology, Herlev University Hospital, Herlev Ringvej 75, 2730 Herlev, Denmark.
Received: 23 September 2017 Accepted: 26 March 2018
References
1. Mor G, Cardenas I. The immune system in pregnancy: a unique complexity. Am J Reprod Immunol N Y N 1989. 2010;63:425–33.
2. Lain KY, Catalano P. Metabolic changes in pregnancy. Clinical Obstet Gynecol n.d. 2007:938–48.
3. Damm P, Houshmand-Oeregaard A, Kelstrup L, Lauenborg J, Mathiesen ER, Clausen TD. Gestational diabetes mellitus and long-term consequences for mother and offspring: a view from Denmark. Diabetologia. 2016;59:1396–9. 4. Lowe WL, Scholtens DM, Sandler V, Hayes MG. Genetics of gestational
diabetes mellitus and maternal metabolism. Curr Diab Rep. 2016;16:15. 5. Lauenborg J, Hansen T, Jensen DM, Vestergaard H, Mølsted-Pedersen L,
Hornnes P, et al. Increasing incidence of diabetes after gestational diabetes. Diabetes Care. 2004;27:1194.
6. Qin J, Li Y, Cai Z, Li S, Zhu J, Zhang F. A metagenome-wide association study of gut microbiota in type 2 diabetes. Nature. 2012;490:55-60. 7. Karlsson FH, Tremaroli V, Nookaew I, Bergstrom G, Behre CJ, Fagerberg B, et
al. Gut metagenome in European women with normal, impaired and diabetic glucose control. Nature. 2013;498:99–103.
8. Koren O, Goodrich JK, Cullender TC, Spor A, Laitinen K, Bäckhed HK, et al. Host remodeling of the gut microbiome and metabolic changes during pregnancy. Cell. 2012;150:470–80.
9. Liu J, Yang H, Yin Z, Jiang X, Zhong H, Qiu D, et al. Remodeling of the gut microbiota and structural shifts in preeclampsia patients in South China. Eur J Clin Microbiol Infect Dis. 2017;36:713–9.
10. Ridaura VK, Faith JJ, Rey FE, Cheng J, Duncan AE, Kau AL, et al. Cultured gut microbiota from twins discordant for obesity modulate adiposity and metabolic phenotypes in mice. Science. 2013;341.https://doi.org/10.1126/ science.1241214.
11. Vrieze A, Van Nood E, Holleman F, Salojärvi J, Kootte RS, Bartelsman JFWM, et al. Transfer of intestinal microbiota from lean donors increases insulin sensitivity in individuals with metabolic syndrome. Gastroenterology. 2012; 143:913–916.e7.
12. Jost T, Lacroix C, Braegger C, Chassard C. Stability of the maternal gut microbiota during late pregnancy and early lactation. Curr Microbiol. 2014; 68:419–27.
13. World Health Organization. Obesity and overweight. 2016. Accessed the 26th of February 2018.
14. Tranquilli AL, Dekker G, Magee L, Roberts J, Sibai BM, Steyn W, et al. The classification, diagnosis and management of the hypertensive disorders of pregnancy: a revised statement from the ISSHP. Pregnancy Hypertens Int J Womens Cardiovasc Health. 2014;4:97–104.
15. Andersen LG, Groenvold M, Jørgensen T, Aadahl M. Construct validity of a revised physical activity scale and testing by cognitive interviewing. Scand J Soc Med. 2010;38:707–14.
16. Toft U, Kristoffersen L, Ladelund S, Bysted A, Jakobsen J, Lau C, et al. Relative validity of a food frequency questionnaire used in the Inter99 study. Eur J Clin Nutr. 2007;62:1038–46.
17. Ainsworth, BE, Haskell, WL, Herrmann, SD, Meckes, N, Bassett, DR, Jr., Tudor-Locke, C, et al. 2011 Compendium of Physical Activities: a second update of codes and MET values. Med Sci Sports Exerc nd;2011:1575–1581. 18. International Association of Diabetes and Pregnancy Study Groups.
Recommendations on the diagnosis and classification of hyperglycemia in pregnancy. Diabetes Care. 2010;33:676.
19. Bäckhed F, Roswall J, Peng Y, Feng Q, Jia H, Kovatcheva-Datchary P, et al. Dynamics and stabilization of the human gut microbiome during the first year of life. Cell Host Microbe. 2015;17:690–703.
20. Caporaso JG, Lauber CL, Walters WA, Berg-Lyons D, Lozupone CA, Turnbaugh PJ, et al. Global patterns of 16S rRNA diversity at a depth of millions of sequences per sample. Proc Natl Acad Sci. 2011;108:4516–22. 21. Kozich JJ, Westcott SL, Baxter NT, Highlander SK, Schloss PD. Development
of a dual-index sequencing strategy and curation pipeline for analyzing amplicon sequence data on the MiSeq Illumina sequencing platform. Appl Environ Microbiol. n.d.;2013:5112–20.
22. Joshi N, Fass J. Sickle: a sliding-window, adaptive, quality-based trimming tool for FastQ files 2011. Available athttps://github.com/najoshi/sickle. Accessed 26th Feb 2018.
23. Edgar RC. UPARSE: highly accurate OTU sequences from microbial amplicon reads. Nat Meth. 2013;10:996–8.
24. Wang Q, Garrity GM, Tiedje JM, Cole JR. Naïve Bayesian classifier for rapid assignment of rrna sequences into the new bacterial taxonomy. Appl Environ Microbiol. 2007;73:5261–7.
25. Love MI, Huber W, Anders S. Moderated estimation of fold change and dispersion for RNA-seq data with DESeq2. Genome Biol. 2014;15:550. 26. Segata N, Izard J, Waldron L, Gevers D, Miropolsky L, Garrett WS, et al.
Metagenomic biomarker discovery and explanation. Genome Biol. 2011;12: R60.
27. Færch K, Vaag A, Holst JJ, Hansen T, Jørgensen T, Borch-Johnsen K. Natural history of insulin sensitivity and insulin secretion in the progression from normal glucose tolerance to impaired fasting glycemia and impaired glucose tolerance: the Inter99 Study. Diabetes Care. 2009;32:439–44. 28. Saito S, Nakashima A, Shima T, Ito M. The1/Th2/th17 and regulatory T-cell
paradigm in pregnancy. Am J Reprod Imunol. n.d.;2010:601–10. 29. Jovanovic L, Pettitt DJ. Gestational diabetes mellitus. JAMA. 2001;286:2516–8. 30. Santacruz A, Collado MC, García-Valdés L, Segura MT, Martín-Lagos JA, Anjos T,
et al. Gut microbiota composition is associated with body weight, weight gain and biochemical parameters in pregnant women. Br J Nutr. 2010;104:83–92. 31. Collado MC, Isolauri E, Laitinen K, Salminen S. Distinct composition of gut microbiota during pregnancy in overweight and normal-weight women. Am J Clin Nutr. 2008;88:894–9.
32. Turnbaugh PJ, Hamady M, Yatsunenko T, Cantarel BL, Duncan A, Ley RE. A core gut microbiome in obese and lean twins. Nature. 2009;457:480-4. 33. MacDonald SC, Bodnar LM, Himes KP, Hutcheon JA. Patterns of gestational
weight gain in early pregnancy and risk of gestational diabetes mellitus. Epidemiology. n.d.;2017:419–27.
34. Chatelier E, Nielsen T, Qin J, Prifti E, Hildebrand F, Falony G. Richness of human gut microbiome correlates with metabolic markers. Nature. 2013; 500:541–6.
35. Jumpertz R, Le DS, Turnbaugh PJ, Trinidad C, Bogardus C, Gordon JI, et al. Energy-balance studies reveal associations between gut microbes, caloric load, and nutrient absorption in humans. Am J Clin Nutr. 2011;94:58–65. 36. Duncan SH, Lobley GE, Holtrop G, Ince J, Johnstone AM, Louis P, et al.
Human colonic microbiota associated with diet, obesity and weight loss. Int J Obes. 2008;32:1720–4.
37. Cotillard A, Kennedy SP, Kong LC, Prifti E, Pons N, Le Chatelier E, et al. Dietary intervention impact on gut microbial gene richness. Nature. 2013; 500:585–8.
38. Org E, Blum Y, Kasela S, Mehrabian M, Kuusisto J, Kangas AJ, et al. Relationships between gut microbiota, plasma metabolites, and metabolic syndrome traits in the METSIM cohort. Genome Biol. 2017;18:70. 39. Watanabe M, Iwatani Y, Kaneda T, Hidaka Y, Mitsuda N, Morimoto Y, et al.
Changes in T, B, and NK lymphocyte subsets during and after normal pregnancy. Am J Reprod Immunol nd. 1997:368–77.
40. Fugmann M, Breier M, Rottenkolber M, Banning F, Ferrari U, Sacco V, et al. The stool microbiota of insulin resistant women with recent gestational diabetes, a high risk group for type 2 diabetes. Sci Rep. 2015;5:13212. 41. Larsen N, Vogensen FK, van den Berg FWJ, Nielsen DS, Andreasen AS,
Pedersen BK, et al. Gut microbiota in human adults with type 2 diabetes differs from non-diabetic adults. PLoS One. 2010;5:e9085.
42. Zhang X, Shen D, Fang Z, Jie Z, Qiu X, Zhang C, et al. Human gut microbiota changes reveal the progression of glucose intolerance. PLoS One. 2013;8:e71108.
43. Lambeth SM, Carson T, Lowe J, Ramaraj T, Leff JW, Luo L, et al. Composition, diversity and abundance of gut microbiome in prediabetes and type 2 diabetes. J Diabetes Obes. 2015;2:1–7.
44. Walker AW, Ince J, Duncan SH, Webster LM, Holtrop G, Ze X, et al. Dominant and diet-responsive groups of bacteria within the human colonic microbiota. ISME J. 2011;5:220–30.
45. Dogra S, Sakwinska O, Soh S-E, Ngom-Bru C, Brück WM, Berger B, et al. Dynamics of infant gut microbiota are influenced by delivery mode and gestational duration and are associated with subsequent adiposity. MBio. 2015;6:1e2419–14.
47. Egshatyan L, Kashtanova D, Popenko A, Tkacheva O, Tyakht A, Alexeev D, et al. Gut microbiota and diet in patients with different glucose tolerance. Endocr Connect. 2016;5:1–9.
48. Hansen CHF, Krych L, Nielsen DS, Vogensen FK, Hansen LH, Sørensen SJ, et al. Early life treatment with vancomycin propagates Akkermansia muciniphila and reduces diabetes incidence in the NOD mouse. Diabetologia. 2012;55:2285–94.
49. Schneeberger M, Everard A, Gómez-Valadés AG, Matamoros S, Ramírez S, Delzenne NM, et al. Akkermansia muciniphila inversely correlates with the onset of inflammation, altered adipose tissue metabolism and metabolic disorders during obesity in mice. Sci Rep. 2015;5:16643.
50. Dao MC, Everard A, Aron-Wisnewsky J, Sokolovska N, Prifti E, Verger EO, et al. Akkermansia muciniphila and improved metabolic health during a dietary intervention in obesity: relationship with gut microbiome richness and ecology. Gut. 2016;65:426.
51. Zhao S, Liu W, Wang J, Shi J, Sun Y, Wang W, et al. Akkermansia muciniphila improves metabolic profiles by reducing inflammation in chow diet-fed mice. J Mol Endocrinol. 2017;58:1–14.
52. Goodrich JK, Waters JL, Poole AC, Sutter JL, Koren O, Blekhman R. Human genetics shape the gut microbiome. Cell. 2014;159:789–99.
53. Perry RJ, Peng L, Barry NA, Cline GW, Zhang D, Cardone RL. Acetate mediates a microbiome-brain-β-cell axis to promote metabolic syndrome. Nature. 2016;534:213–7.
54. Frost G, Sleeth ML, Sahuri-Arisoylu M, Lizarbe B, Cerdan S, Brody L. The short-chain fatty acid acetate reduces appetite via a central homeostatic mechanism. Nat Commun. 2014;5:3611.
55. Ley RE, Bäckhed F, Turnbaugh P, Lozupone CA, Knight RD, Gordon JI. Obesity alters gut microbial ecology. Proc Natl Acad Sci U S A. 2005;102: 11070–5.
56. Togo AH, Khelaifia S, Bittar F, Maraninchi M, Raoult D, Million M. ‘Eisenbergiella massiliensis’, a new species isolated from human stool collected after bariatric surgery. New Microbes New Infect. 2016;13:15–6. 57. Million M, Maraninchi M, Henry M, Armougom F, Richet H, Carrieri P, et al.
Obesity-associated gut microbiota is enriched in Lactobacillus reuteri and depleted in Bifidobacterium animalis and Methanobrevibacter smithii. Int J Obes. 2012;36:817–25.
58. Gomez-Arango LF, Barrett HL, McIntyre HD, Callaway LK, Morrison M, Dekker NM. Connections between the gut microbiome and metabolic hormones in early pregnancy in overweight and obese women. Diabetes. 2016;65:2214. 59. Forslund K, Hildebrand F, Nielsen T, Falony G, Le Chatelier E, Sunagawa S, et
al. Disentangling the effects of type 2 diabetes and metformin on the human gut microbiota. Nature. 2015;528:262–6.
• We accept pre-submission inquiries
• Our selector tool helps you to find the most relevant journal • We provide round the clock customer support
• Convenient online submission • Thorough peer review
• Inclusion in PubMed and all major indexing services • Maximum visibility for your research
Submit your manuscript at www.biomedcentral.com/submit