R E S E A R C H A R T I C L E
Open Access
RNA sequencing identifies novel
non-coding RNA and exon-specific effects
associated with cigarette smoking
Margaret M. Parker
1,2, Robert P. Chase
1, Andrew Lamb
1, Alejandro Reyes
3, Aabida Saferali
1,2, Jeong H. Yun
1,4,
Blanca E. Himes
5, Edwin K. Silverman
1,2,4, Craig P. Hersh
1,2,4and Peter J. Castaldi
1,2,6*Abstract
Background:Cigarette smoking is the leading modifiable risk factor for disease and death worldwide. Previous studies quantifying gene-level expression have documented the effect of smoking on mRNA levels. Using RNA sequencing, it is possible to analyze the impact of smoking on complex regulatory phenomena (e.g. alternative splicing, differential isoform usage) leading to a more detailed understanding of the biology underlying smoking-related disease.
Methods:We used whole-blood RNA sequencing to describe gene and exon-level expression differences between 229 current and 286 former smokers in the COPDGene study. We performed differential gene expression and differential exon usage analyses using the voom/limma and DEXseq R packages. Samples from current and former smokers were compared while controlling for age, gender, race, lifetime smoke exposure, cell counts, and technical covariates.
Results:At an adjustedp-value <0.05, 171 genes were differentially expressed between current and former smokers. Differentially expressed genes included 7 long non-coding RNAs that have not been previously associated with smoking:LINC00599, LINC01362, LINC00824, LINC01624, RP11-563D10.1, RP11-98G13.1, AC004791.2. Secondary analysis of acute smoking (having smoked within 2-h) revealed 5 of the 171 smoking genes demonstrated an acute response above the baseline effect of chronic smoking. Exon-level analyses identified 9 exons from 8 genes with significant differential usage by smoking status, suggesting smoking-induced changes in isoform expression.
Conclusions:Transcriptomic changes at the gene and exon levels from whole blood can refine our understanding of the molecular mechanisms underlying the response to smoking.
Keywords:RNA-seq, Differential expression, Cigarette smoking, Exon usage, Isoforms
Background
Cigarette smoking is the leading modifiable risk factor for disease and death worldwide. In the United States, smoking accounts for more than 438,000 deaths per year [1], and since 1964 more than 20 million Americans have died because of smoking [2]. Cigarette smoking in-creases risk of many diseases including cancer, chronic obstructive pulmonary disease, coronary heart disease,
and stroke [3]. However, research shows smoking cessa-tion can reduce risk of many diseases, in some cases reverting disease risk to the level of non-smokers [4, 5]. This suggests specific molecular changes occur in active smoking (as compared to former smoking) that increase disease risk.
To identify the molecular mechanisms underlying re-sponse to smoke exposure, previous studies have character-ized gene expression changes in a number of human tissues including, peripheral whole blood [6–9], lymphocytes [10], monocytes [11], bronchial epithelial cells [12, 13], alveolar macrophages [14], and lung tissue [15–17]. This includes a recently published meta-analysis of 1421 current, 3955 * Correspondence:[email protected]
1Channing Division of Network Medicine, Brigham and Women’s Hospital,
181 Longwood Ave, Boston, MA, USA
2Harvard Medical School, Boston, MA 02115, USA
Full list of author information is available at the end of the article
former, and 4860 never smokers that identified 1270 differ-entially expressed genes between current and never smokers and 39 differentially expressed genes between former and never smokers in peripheral blood [6]. These results focused on gene level quantification from microarrays. However, alternative splicing and differential isoform usage play a crit-ical role in human biology, but little is known about alterna-tive splicing with respect to cigarette smoking.
RNA sequencing (RNA-seq) facilitates the ability to look at more complex regulatory phenomena such as isoform-switching, alternative promoter usage, and exon inclusion/ exclusion events. Moreover, it can interrogate not only known mRNA transcripts, but additional populations of RNA including long non-coding RNAs (lncRNAs), small RNAs and microRNAs. We hypothesized that: 1) RNA-seq of peripheral blood from smokers could refine our un-derstanding of the molecular mechanisms underlying the response to cigarette smoking; and 2) that some transcripts show an acute response to smoke exposure above and beyond the chronic changes. We sought to an-swer these questions by performing gene-level differential expression and differential exon usage (DEU) analysis in 515 current and former smokers from the COPDGene study [18], a large, well-characterized cohort that included
both Non-Hispanic White and African American
participants.
Methods
Study participants
Our study included 515 participants of the COPDGene study. A complete study protocol for COPDGene had been described elsewhere [18], but briefly, self-identified Non-Hispanic Whites and African Americans between the ages of 45 and 80 years with a minimum of 10 pack-years life-time smoking history (1 pack-year = 1 pack of cigarettes smoked daily for 1 year) were enrolled at 21 centers across the United States. Subjects returned for a second study visit approximately 5 years after initial enrollment, at which point they completed detailed questionnaires, pre- and post- bronchodilator spirometry, volumetric computed tomography of the chest, and provided blood for complete blood counts (CBCs) with differentials and RNA sequen-cing Subjects were cancer-free at time of study enrollment.
Smoking history was ascertained by self-report. Participants defined as current smokers answered yes to the question “Do you smoke cigarettes now (as of one month ago?)”. Participants defined as acute smokers answered yes to the question “Have you smoked a cigarette(s) in the past 2 hours?”. Sequenced subjects in-cluded COPD cases (GOLD spriometric stage 2,3 or 4 [19]) and smokers with normal lung function (GOLD stage 0 or 1) with available chest computed tomography. Institutional review board approval and written informed consent was obtained for all subjects.
RNA extraction
Total RNA was extracted from PAXgene ™ Blood RNA tubes using the Qiagen PreAnalytiX PAXgene Blood miRNA Kit (Qiagen, Valencia, CA). The extraction protocol was performed either manually or with the Qiagen QIAcube extraction robot according to the com-pany’s standard operating procedure. Extracted RNA samples with RIN > 7 and concentration > =25 μg/ul were sequenced.
cDNA library preparation and sequencing
Globin reduction and cDNA library preparation for total RNA was performed with the Illumina TruSeq Stranded Total RNA with Ribo-Zero Globin kit (Illumina, Inc., San Diego, CA). Libraries were QCed by quantification with picogreen, size analysis on an Agilent Bioanalyzer or Tapestation 2200 (Agilent, Santa Clara, CA) and qPCR quantitation against a standard curve. 75 bp paired end reads were generated on a HiSeq 2500 flow cell. Libraries are loaded at an empirically determined concentration in order to generate the optimal number of clusters per lane of the flow cell. Samples were se-quenced to an average depth of 20 million reads.
Read alignment, expression quantification, and sequencing quality control
Reads were trimmed of TruSeq adapters using Skewer with default parameters [20]. Trimmed reads were aligned to the GRCH38 genome using the STAR aligner version 2.4.0 h [21]. Gene and exon level counts were generated using RSubreads [22] with the Ensembl version 81 annotation [23]. Quality control was performed using the FastQC [24] and RNA-SeQC programs [25]. Samples were included for subsequent analysis if they had >10 million total reads, >80% of reads mapped to the reference genome, XIST and Y chromosome expression was consistent with reported gender, <10% of R1 reads in the sense orientation, Pearson correlation > = 0.9 with samples in the same library construction batch, and concordant genotype calls between variants called from RNA sequencing reads and DNA genotyping. The gene count data used for this analysis are available in GEO [26, 27] (accession number GSE9753).
Technical covariates
Gene-level differential expression analyses
We performed differential gene expression analysis using the voom [29] /limma [30, 31] R package. Transcripts that were expressed at > = 1 count per million mapped reads in > = 10 subjects were analyzed. Analyses com-pared current and former smokers controlling for age, gender, race, pack-years of smoking history, monocyte percentage, lymphocyte percentage, eosinophil percent-age, neutrophil percentpercent-age, library construction batch, and significant SVs (n = 27). Differentially expressed genes were defined with as those with an empirical Bayes correctedp-value <0.05.
To assess if differentially expressed genes were associ-ated with acute smoking, we performed differential gene expression in limma [30, 31] comparing current smokers who had smoked within the past 2 h to current smokers who had not (controlling for age, gender, race, pack-years of smoking history, cell count percentages, library construction batch, and significant SVs [n = 14]). Follow-up sensitivity analysis additionally controlled for the average number of cigarettes smoked per day to test if differential expression results could be explained by smoking intensity. Genes were considered significant if their Bonferroni corrected p-value was <0.05 (corrected for the number of differentially expressed genes).
Gene ontology (GO) enrichment analyses
To identify gene sets over or under-represented in differ-entially expressed genes, we performed GO gene ontol-ogy enrichment analyses using PANTHER (accessed through: http://www.geneontology.org) [32–34]. Analysis input included all significantly differentially expressed genes, and queries included gene sets in the “biological processes”ontology (database version released 2017– 01-26). Significant gene sets were defined as those with a Bonferroni correctedpvalue <0.05.
Differential exon usage analyses
We tested for DEU between current and former smokers using the topSplice function within the limma R package [30, 31]. Adjusted p-values less than 0.05 in topSplice were confirmed using the DEXseq R package (alternate version, accessed through github/areyesq89/DEXSeqAlt) [35]. In contrast with the original version, this alternate version uses the statmod GLM fitter and skips the step of sharing information across exons when calculating dispersion estimates, which is not needed for analysis of large sample sizes. Both analyses were performed using exon level counts generated by Rsubreads. TopSplice uses a moderated T-statistic to test for differences be-tween each exon and all other exons for the same gene, while DEXseq tests a full GLM with an exon x condition interaction term (~sample + exon + exon:smoking + exon:covariates) versus a reduced GLM without an exon
x condition interaction term (~sample + exon + exon:-covariates) via a likelihood ratio test. Therefore, both approaches explicitly test for DEU between current and former smokers while accounting for differences in overall gene expression. Exons with a topSplice adjusted
p-value <0.05 and a DEXseq p-value <0.05 were defined as DEU.
Results
Demographics
A total of 229 current and 286 former smokers were in-cluded in our analysis. All subjects had a substantial smoking history (mean pack-years smoked = 45) with current smokers more likely to be younger and African American. As expected, smoking was associated with changes in peripheral blood cell counts with current smokers having significantly lower neutrophil and monocyte percentages and a higher lymphocyte percent-age (Table 1).
Differential gene expression in response to cigarette smoke
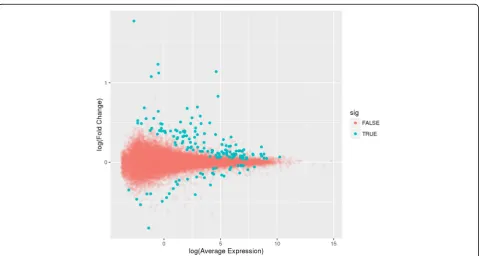
We observed 27,885 expressed genes, including 14,866 protein coding genes, 3277 processed pseudogenes and 2204 lncRNAs (Additional file 1: Figure S1). At an ad-justed p-value <0.05, we identified a total of 171 differ-entially expressed genes between current and former smokers (Additional file 2: Table S1), the majority of which (79.5%) had higher expression in smokers (Fig-ure 1). Effect sizes of differentially expressed genes ranged from −0.83 to 1.78, with 5 of 171 having a log2 fold change greater than 1.0 (SEMA6B, AHRR, GPR15,
CTTNBP2, and LINC00599). Significant results were enriched for genes previously identified by a large micro-array expression study of current versus never smokers [6] (50 of 171 genes overlap,p-value hypergeometric test of up-regulated genes <0.001, p-value hypergeometric test of downregulated genes <0.001), with the direction of effect be-ing consistent in all 50 overlappbe-ing genes (Additional file 3: Table S2). The top 2 differentially expressed genes,GPR15
andLRRN3,have been previously reported in both expres-sion [6, 7] and methylation studies of smoking [36–40].
expression being current smokers (Additional file 5: Figure S3). To test if significant lncRNA findings were represented in previous microarray studies, we cross-referenced our 7 significant findings with the maps from the Illumina Human HT12 versions 3 and 4 microarrays. Probes mapping to LINC00824 andRP11-98G13.1were present on the Illumina Human HT12 version 3 array, but none of the 7 significant findings were present on version 4.
To assess if time since smoking cessation modified our results, we performed differential expression analysis of this quantitative outcome in former smokers with this measurement available (n = 270). Mean time since smoking cessation in former smokers was 17.3 years (sd = 10.86). There was one significantly differentially expressed gene associated with this outcome (GPR15, adjustedp-value = 2.9 × 10⁻⁸).
Gene ontology (GO) enrichment analysis
GO functional enrichment analyses identified 41 bio-logical pathways significantly over-represented and no pathways under-represented in the 171 differentially expressed genes at a Bonferroni corrected p-value <0.05 (Additional file 6: Table S3). The most significant GO gene sets included“immune system process”(GO:0002376, ad-justed p value = 1.96 × 10⁻⁷), “defense response” (GO:0006952, adjusted p value = 6.26 × 10⁻⁷), and “response to external stimulus” (GO:0009605), ad-justed p value = 6.60 × 10⁻⁵).
Transcriptomic response to acute smoking
To assess if the 171 differentially expressed genes were associated with acute smoking, we performed gene-based limma analysis comparing smokers who had smoked at least 1 cigarette within the past 2 h (n= 93) to those who had not (n= 136). Five genes were signifi-cantly differentially expressed (Bonferroni corrected for
Table 1Summary of analyzed COPDGene subjects by former (n= 286) and current (n= 229) smoking status. Values represent mean (SD)
Former Smokers (n = 286)
Current Smokers
(n = 229) P
-value
Race (% NHW) 86% 57% <0.01
Gender (% female) 45% 49% 0.4
Age 69 (8.1) 61 (7.6) <0.01
Pack-Years Smoked
44 (23) 46 (21) 0.5
FEV1percent predicted 73 (29) 79 (24) 0.02
COPD cases 41% 48% <0.01
Neutrophil percentage 61 (11) 58 (11) <0.01
Lymphocyte percentage 28 (11) 31 (9.9) <0.01
Eosinophil percentage 2.6 (2.1) 2.7 (3.0) 0.9
Monocyte percentage 8.5(2.5) 7.6(2.2) <0.01
Basophil percentage 0.59(0.55) 0.59(0.65) 0.9
Fig. 1Mean-Average(MA)-plot of log2 average expression versus log2 fold change between current and former smokers. Log fold change
171 tests), and 29 of 171 had a nominal p-value <0.05 (Additional file 7: Table S4). When considering all expressed transcripts, none were significantly differen-tially expressed with acute smoking at an adjusted
p-value <0.05.
Overall, there was a significant correlation between the fold changes calculated in the current smoking and acute smoking analyses (Pearson = 0.70, p-value <0.001, Figure 2), however some genes had an oppos-ite direction of effect between the 2 analyses (e.g.
SIGLEC1, log2 fold change current smoking = 0.51, log2 fold change acute smoking = − 0.34). Sensitivity analysis controlling for smoking intensity (measured
as the average number of cigarettes smoked per day) yielded similar results (Additional file 7: Table S4). This suggests that some of the 171 smoking genes demonstrate an acute response to smoking exposure above and beyond the baseline effect of chronic smoking, whereas others do not. GO enrichment on the 29 nominally significant genes revealed the top annota-tion as“chemotaxis” (Bonferroni adjustedpvalue = 0.08), suggesting that there may be an effect of acute smoke exposure on cell signaling and migration in chronic smokers.
Differential exon usage
We used complementary methods (limma’s topSplice and DEXseq) to test for differential exon usage (DEU) between current and former smokers. A total of 119,217 exons had expression levels suitable for DEU analysis. Exon-level p-values showed no evidence of systematic inflation (Additional file 8: Figure S4).
In total, 9 exons in 8 genes showed significant DEU (Table 3, Additional files 9, 10, 11, 12, 13, 14, 15: Figures S5-S11). Although all genes with DEU had multiple isoforms (range 4–17), 8 of 9 significant exons were annotated to only one isoform, suggesting that the identified DEU exons tag isoform differences between current and former smokers (Fig. 3). Significant exons were most likely to be the last exon of a transcript (5/9) or the first exon of a transcript (3/9) and one significant DEU exon (in MANIA1) was located in the middle of its associated transcript.
Of the 171 DE genes, only 2 showed significant DEU. Even after relaxing the significance level of the DEU ana-lysis top< 0.05, only 18 of 171 DE genes showed nom-inally significant DEU. Conversely, only 3 of the 9 exons identified in the DEU analysis showed nominal signifi-cance in the gene-based analysis (Table 3). This suggests some of the transcriptomic changes that occur in re-sponse to smoking are independent of differential gene expression and occur at the level of RNA processing. Gene and exon level results can be viewed interactively at https://cdnm.shinyapps.io/Current_smoking_Limma/.
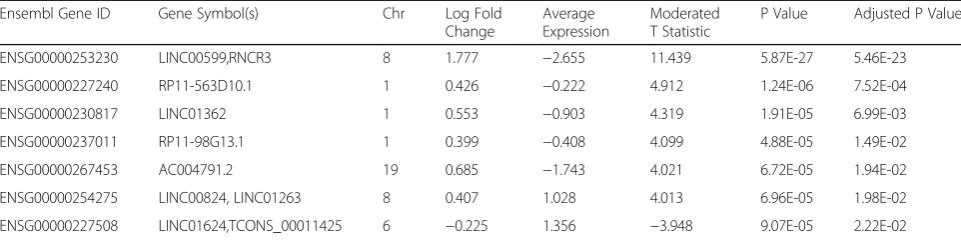
Table 2Differentially expressed long non-coding RNAs (lncRNA) between current and former smokers (adjusted p-value <0.05). Of the 7 differentially expressed lncRNAs, 6 have higher expression in current smokers as compared to former smokers
Ensembl Gene ID Gene Symbol(s) Chr Log Fold
Change
Average Expression
Moderated T Statistic
P Value Adjusted P Value
ENSG00000253230 LINC00599,RNCR3 8 1.777 −2.655 11.439 5.87E-27 5.46E-23
ENSG00000227240 RP11-563D10.1 1 0.426 −0.222 4.912 1.24E-06 7.52E-04
ENSG00000230817 LINC01362 1 0.553 −0.903 4.319 1.91E-05 6.99E-03
ENSG00000237011 RP11-98G13.1 1 0.399 −0.408 4.099 4.88E-05 1.49E-02
ENSG00000267453 AC004791.2 19 0.685 −1.743 4.021 6.72E-05 1.94E-02
ENSG00000254275 LINC00824, LINC01263 8 0.407 1.028 4.013 6.96E-05 1.98E-02
ENSG00000227508 LINC01624,TCONS_00011425 6 −0.225 1.356 −3.948 9.07E-05 2.22E-02
Fig. 2Comparison of effect sizes between differential expression analyses
Discussion
By analyzing RNA-seq data from peripheral blood samples of 515 COPDGene study subjects, we identified 171 differ-entially expressed transcripts between current and former smokers, including 7 novel lncRNAs. Secondary analysis of
2-h smoking in current smokers showed that the majority of these 171 genes demonstrate a consistent, ongoing re-sponse to smoking while a subset of these genes fluctuate in response to acute exposure. Additionally, DEU analysis identified 9 differentially used exons between current and
Table 3Differential exon usage (DEU) between current and former smokers. Significant DEU is defined as an adjustedp-value <0.05 from limma exon-based T statistic and DEXseq p-value <0.05.Gene-based P value is unadjusted from limma differential expression analysis
Ensembl Exon ID Gene Symbol
Limma AdjustedPvalue DEXseqPvalue Gene-basedPvalue Transcripts Containing Exon
Exon Number in Transcript
ENSE00001810132 EPS15 4.00E-02 2.00E-02 8.16E-01 ENST00000478657 first
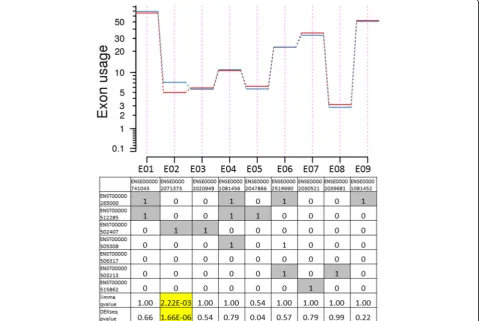
ENSE00002071373 GALNT7 2.22E-03 1.66E-06 1.30E-01 ENST00000502407 first
ENSE00001444573 SASH1a 1.80E-09 2.39E-03 4.22E-21 ENST00000367467 last
ENSE00001400828 AREL1 1.27E-02 1.18E-03 9.98E-01 ENST00000356357 last
ENSE00001444981 UTRN 5.72E-16 8.82E-02 1.75E-01 ENST00000367545 last
ENSE00001635177 MAN1A2 4.00E-03 3.25E-02 9.48E-03 ENST00000356554 second
ENSE00001231507 LRRN3a 3.23E-10 4.69E-04 4.19E-36 ENST00000308478 first
ENSE00001175333 ERAP1 7.87E-12 1.27E-03 4.27E-01 ENST00000296754 first
ENSE00001641703 ERAP1 1.19E-06 3.63E-03 4.27E-01 ENST00000443439 first
a
Differentially expressed gene
Fig. 3Exon usage in theGALNT7gene by smoking status. The top plot shows exon usage for each analyzed exon by smoking status
former smokers, suggesting smoking-induced changes in isoform expression.
Included in the 171 differentially expressed transcripts are 7 lncRNAs. LncRNAs are an abundant class of RNA defined by their length (> 200 base pairs) and the fact that they do not code for a protein [41]. Their function is largely uncharacterized, but they are thought to broadly regulate transcription through multiple mechanisms in-cluding [42, 43]: 1) chromatin remodeling (lncRNAs can affect the recruitment of polycomb repressive complexes that modify histones to cause gene silencing) [44, 45]; 2) transcriptional co-factors (e.g. the most abundant gene in our data [MALAT1] is a lncRNA that acts as a cofactor to increase or decrease expression of proximal genes) [46, 47]; and 3) competition for endogenous RNAs (i.e. lncRNAs can act as a sponge for microRNAs thereby inhi-biting their effect) [48, 49]. For example,LINC00599(the most significant differentially expressed lncRNA between current and former smokers) is hypothesized to regulate transcription by competing for shared microRNAs. Previ-ous research has associated this transcript with atherosclerosis-related vascular dysfunction [50]. Authors identified 3 microRNA binding sites onLINC00599 (hsa-miR-4306, hsa-miR-185-5P, hsa-miR-4644), proposing that increased expression of LINC00599 causes a decreased concentration of these microRNAs with corresponding al-terations in the abundance of their mRNA targets. To test this, we looked for enrichment of our differentially expressed genes in these predicted targets (n= 467 in the StarBase database [51] and n = 373 in the TargetScan database [52]). However, we did not find significant over-lap (hypergeometric p-value for enrichment in Star-Base = 0.15, hypergeometric p-value for enrichment in TargetScan = 0.29.)
We found evidence for differential exon usage in 9 exons from 8 genes. Interestingly, 8 of these 9 were unique to one transcript, suggesting these results may tag isoform differences between current and
former smokers. Even in the case of ERAP1 (the
only gene with more than one differentially used exon), the 2 identified exons were unique to a single transcript (Additional file 11: Figure S7). Of note, 5 genes with significant DEU showed no evidence of differential expression in the gene-based analysis (unadjusted p-value >0.05). This suggests that some transcriptomic changes happen only at the level of RNA processing and do not affect mean gene ex-pression levels. These findings highlight the potential utility of differential exon usage to identify potential isoform-specific effects, particularly with the chal-lenges in accurately inferring isoform abundance from short-read RNA-seq data.
In 8 of the 9 instances of DEU, the involved exon was ei-ther the first or last exon in a transcript. There are a number
of potential explanations for this finding. First and last exons tend to be larger than other exons, so it is possible that these results reflect increased statistical power relative to shorter exons. Alternatively, first and last exons play key roles in the initiation and termination of transcription. A recent analysis of GTEx data identified alternative transcription start and stop sites as the driving factor in differential exon usage across tissues [53]. Activating histone modifications (H3K4me3 and H3K9ac) map to the first exon-intron boundary and are known determinants of transcription quantity, transcription start site, and gene activity [54]. Last exons play an important role in transcription termination, and differential exon usage in the last exon may indicate 3′ UTR shortening or early transcription termination. In addition, mammalian transcription elongation is highly regu-lated and reregu-lated to splicing [55]. Since our total RNA isola-tion methods include nuclear and partially processed RNAs, the concentration of DEU in first and last exons in our data may reflect smoking-related, gene-specific alterations in tran-scription initiation, elongation, or termination.
This study has a number of strengths: to our know-ledge, this is the first large-scale RNA-seq analysis of cigarette smoking, and it is the first study to describe differential exon usage between current and former smokers. RNA-seq allows for the unbiased identification of novel differentially expressed transcripts, and this study identified novel associations with smoking and seven lncRNAs. Additionally, although cigarette smoking was associated with changes in total peripheral cell counts, all subjects had measured blood cell counts (CBCs) at the time of RNA sequencing. This allowed for direct adjustment of cell-specific effects, mitigating against the possibility that results are due to cell type proportion confounding. We also used surrogate variable analysis to adjust for unmeasured confounders, includ-ing unmeasured cell type subpopulations.
providing important validation and functional elucida-tion of these observaelucida-tions. Secondly, our outcomes of interest (current smoking and 2 h smoking) were based on self-report using a validated questionnaire [56] without biochemical confirmation, and may not completely capture the toxic effects of tobacco. Additionally, our samples were sequenced to an aver-age depth of 20 million reads. While this depth pro-vides good resolution for highly expressed transcripts, deeper sequencing would likely reveal differences in lower expressed features, including exons and iso-forms. Finally, we focused on differential exon usage instead of isoform level analysis, because quantifica-tion of isoform abundance from short read data is still a significant challenge. Isoform inference algo-rithms including RSEM [57], kallisto [58], and salmon [59] have made significant improvements in isoform quantification, but performance is not yet at a level where differential isoform expression can be reliably detected [60].
Conclusions
We used RNA-seq in a large study of current and former smokers to identify transcripts that are altered by smoking (via differential expression or differential exon usage). Our results suggest that there is an overall up-regulation of genes expressed in response to smoking, including an up-regulation of lncRNAs. These analyses provide the first exon-level observations of transcrip-tomic alterations induced by cigarette smoking in blood. Additional analysis in pure cell types isolated from current and former smokers is needed to understand the consequences of these changes on transcriptional networks and downstream processes. The gene and exon-level effects observed in this study refine our un-derstanding of the molecular mechanisms underlying the response to cigarette smoking.
Additional files
Additional file 1: Figure S1.Gene annotation of 27,885 observed
genes (Ensembl version 81 annotation). (PNG 19 kb)
Additional file 2: Table S1.Genes differentially expressed (adjusted
p-value <0.05) between current and former smokers (n= 171). Analysis adjusted for age, race, gender, pack-years of smoking history, monocyte percentage, lymphocyte percentage, eosinophil percentage, neutrophil percentage, library construction batch, and surrogate variables. (XLSX 28 kb)
Additional file 3: Table S2.Comparison of log fold changes in 50
differentially expressed genes that overlap Huan et al. 2016. All 50 genes have a consistent direction of effect. (XLSX 11 kb)
Additional file 4: Figure S2.Quantile-quantile (QQ) plots for
differential gene expression analysis between current and former smokers using voom/limma. (PNG 14 kb)
Additional file 5: Figure S3.Normalized counts in current versus
former smokers for lncRNAs that are significantly differentially expressed: A)ENSG00000253230; B)ENSG00000227240; C)ENSG00000230817; D) ENSG00000237011; E)ENSG00000267453; F)ENSG00000254275; G) ENSG00000227508. In 6 of 7 differentially expressed lncRNAs, current smokers have higher expression than former smokers.Y-axis represents log2expression level. (PNG 118 kb)
Additional file 6: Table S3.Significant gene ontology terms
over-represented in genes differentially expressed between current and former smokers.P-values are Bonferroni corrected for multiple comparisons. (XLSX 16 kb)
Additional file 7: Table S4.Differentially expressed genes in current
versus former smokers (adjusted p-value <0.05) that are nominally significant (p< 0.05) in differential expression analysis of current smokers who had smoked within the last 2 h (n= 93) versus those who had not (n= 136). A total of 34 genes (20.5%) showed nominal significance in the acute smoking analysis. Secondary analysis adjusted for smoking intensity (i.e. average number of cigarettes smoked per day) yielded similar results. logFC = log2fold change. AS = acute smoking. CS = current smoking.
* = Adjusted for smoking intensity (average cigarettes per day). Bolded p-values are statistically significant after Bonferroni correction for 171 tests (XLSX 13 kb)
Additional file 8: Figure S4.Quantile-quantile (QQ) plot for differential
exon usage between current and former smokers using the topSplice exon-based T-statistic. (PNG 16 kb)
Additional file 9: Figure S5.Exon-level expression ofEPS15. The top
plot shows mean normalized counts by smoking status on the log scale for each analyzed exon. One exon showed significant differential usage (ENSE00001810132). The bottom table maps tested exons to known transcripts (1 = exon present in that transcript, 0 = exon not present in that transcript). (PNG 92 kb)
Additional file 10: Figure S6.Exon-level expression ofSASH1. The top
plot shows mean normalized counts by smoking status on the log scale for each analyzed exon. One exon showed significant differential usage (ENSE00001444573). The bottom table maps tested exons to known transcripts (1 = exon present in that transcript, 0 = exon not present in that transcript). (PNG 64 kb)
Additional file 11: Figure S7.Exon-level expression ofAREL1. The top
plot shows mean normalized counts by smoking status on the log scale for each analyzed exon. One exon showed significant differential usage (ENSE00001400828). The bottom table maps tested exons to known transcripts (1 = exon present in that transcript, 0 = exon not present in that transcript). (PNG 102 kb)
Additional file 12: Figure S8.Exon-level expression of last 11 exons of
UTRN. The top plot shows mean normalized counts on the log scale for each exon passing filtering by smoking status. There was one exon that showed significant differential usage between current and former smokers (ENSE00001444981). The bottom table maps tested exons to known transcripts (1 = exon present in that transcript, 0 = exon not present in that transcript). (PNG 141 kb)
Additional file 13: Figure S9.Exon-level expression ofMAN1A2.The
top plot shows mean normalized counts by smoking status on the log scale for each analyzed exon. One exon that showed significant differential usage (ENSE00001635177). The bottom table maps tested exons to known transcripts (1 = exon present in that transcript, 0 = exon not present in that transcript). (PNG 51 kb)
Additional file 14: Figure S10.Exon-level expression ofLRRN3.The top
plot shows mean normalized counts by smoking status on the log scale for each analyzed exon. One exon showed significant differential usage between current and former smokers (ENSE00001231507). The bottom table maps tested exons to known transcripts (1 = exon present in that transcript, 0 = exon not present in that transcript). (PNG 46 kb)
Additional file 15: Figure S11.Exon-level expression ofERAP1.The top
plot shows mean normalized counts by smoking status on the log scale for each analyzed exon. Two exons showed significant differential usage between current and former smokers (ENSE00001175333,
transcripts (1 = exon present in that transcript, 0 = exon not present in that transcript). (PNG 71 kb)
Additional file 16:IRB approval and complete list of
acknowledgements. (DOCX 20 kb)
Abbreviations
CBC:Complete blood cell count; DEU: Differential exon usage; lncRNA: Long non-coding RNA; RNA-seq: RNA sequencing
Acknowledgements
We would like to acknowledge the contributions of all COPDGene investigators. A complete list of investigators is available in the supplementary materials.
Funding
This study was supported by NIH grants: R01HL125583, R01HL130512, R01HL124233, R01HL126596, R01HL089897, R01HL089856, R01HG005220 and T32HL007427.
Availability of data and materials
The count data generated and analyzed during the current study are available in the GEO repository (accession number GSE 97531). Raw read data will be available in the dbGap repository.
Authors’contributions
MMP and PJC participated in data acquisition, analysis of data, interpretation of analysis results, manuscript drafting, and manuscript editing for intellectual content. RPC, AL, AR, AS, JY, BEH participated in analysis of data, interpretation of analysis results, and manuscript editing for intellectual content. EKS and CPH participated in study design, interpretation of analysis results, and manuscript editing for intellectual content. All authors have read and approved the manuscript.
Ethics approval and consent to participate
This study was approval by the Institutional Review Boards of all involved universities. For a complete list, see Additional file 16. Written informed consent was obtained for all subjects.
Consent for publication
This manuscript does not contain individual person’s data in any form. Data presented is not identifiable.
Competing interests
PJC reports person fees from GlaxoSmithKline. EKS reports grants and other support from COPD Foundation, grants and personal fees from
GlaxoSmithKline, personal fees from Merck and personal fees and other expense payments from Novartis, outside the submitted work. CPH reports personal fees from CSL Behring, personal fees from Mylan, outside the submitted work. The authors declare that they have no competing interests.
Publisher’s Note
Springer Nature remains neutral with regard to jurisdictional claims in published maps and institutional affiliations.
Author details
1Channing Division of Network Medicine, Brigham and Women’s Hospital,
181 Longwood Ave, Boston, MA, USA.2Harvard Medical School, Boston, MA 02115, USA.3Department of Biostatistics and Computational Biology,
Dana-Farber Cancer Institute, Boston, MA, USA.4Division of Pulmonary and
Critical Care Medicine, Brigham and Women’s Hospital, Boston, MA, USA.
5
Department of Biostatistics, Epidemiology, and Informatics, Perelman School of Medicine, University of Pennsylvania, Philadelphia, PA, USA.6Division of
General Internal Medicine and Primary Care, Brigham and Women’s Hospital, Boston, MA, USA.
Received: 25 April 2017 Accepted: 2 October 2017
References
1. Centers for Disease C, Prevention. Smoking-attributable mortality, years of potential life lost, and productivity losses–United States, 2000-2004. MMWR Morb Mortal Wkly Rep. 2008;57(45):1226–8. doi:10.1001/jama.301.6.593.
2. US Department of Health and Human Services. The Health Consequences of Smoking- 50 years of Progress: A report from the Surgeon General. Atlanta, GA. 2014.
3. Jamal A, Homa DM, O’Connor E, et al. Current cigarette smoking among adults - United States, 2005-2014. MMWR Morb Mortal Wkly Rep. 2015; 64(44):1233–40. doi:10.15585/mmwr.mm6444a2.
4. Samet JM. Health benefits of smoking cessation. Clin Chest Med. 1991; 12(4):669–79.
5. United States Public Health Service Office of the Surgeon General, United States Public Health Service Office on Smoking and Health. The Health Benefits of Smoking Cessation: A Report of the Surgeon General. DHHS Publication No. (CDC) 90–8416. Rockville, MD. 1990.
6. Huan T, Joehanes R, Schurmann C, et al. A Whole-Blood Transcriptome Meta-Analysis Identifies Gene Expression Signatures of Cigarette Smoking. Hum Mol Genet. 2016;Epub ahead. doi:10.1093/hmg/ddw288.
7. Vink JM, Jansen R, Brooks A, et al. Differential gene expression patterns between smokers and non-smokers: Cause or consequence? Addict Biol. 2015. doi:10.1111/adb.12322.
8. Beineke P, Fitch K, Tao H, et al. A whole blood gene expression-based signature for smoking status. BMC Med Genet. 2012;5(1):58. doi:10.1186/1755-8794-5-58. 9. Paul S, Amundson SA. Differential effect of active smoking on gene
expression in male and female smokers. J Carcinog Mutagen. 2014;5(973):1– 22. do:10.4172/2157-2518.1000198.
10. Charlesworth JC, Curran JE, Johnson MP, et al. Transcriptomic epidemiology of smoking: the effect of smoking on gene expression in lymphocytes. BMC Med Genet. 2010;3:29. doi:10.1186/1755-8794-3-29.
11. Zeller T, Wild P, Szymczak S, et al. Genetics and beyond - the transcriptome of human monocytes and disease susceptibility.PLoS One. 2010;5(5). doi:10.1371/journal.pone.0010693.
12. Spira A, Beane J, Shah V, et al. Effects of cigarette smoke on the human airway epithelial cell transcriptome. Proc Natl Acad Sci U S A. 2004;101(27): 10143–8. doi:10.1073/pnas.0401422101.
13. Beane J, Sebastiani P, Liu G, Brody JS, Lenburg ME, Spira A. Reversible and permanent effects of tobacco smoke exposure on airway epithelial gene expression. Genome Biol. 2007;8(9):R201. doi:10.1186/gb-2007-8-9-r201. 14. Heguy A, O’Connor TP, Luettich K, et al. Gene expression profiling of human
alveolar macrophages of phenotypically normal smokers and nonsmokers reveals a previously unrecognized subset of genes modulated by cigarette smoking. J Mol Med. 2006;84(4):318–28. doi:10.1007/s00109-005-0008-2. 15. Landi MT, Dracheva T, Rotunno M, et al. Gene expression signature of
cigarette smoking and its role in lung adenocarcinoma development and survival.PLoS One. 2008;3(2). doi:10.1371/journal.pone.0001651.
16. Staaf J, Jönsson G, Jönsson M, et al. Relation between smoking history and gene expression profiles in lung adenocarcinomas. BMC Med Genet. 2012;5: 22. doi:10.1186/1755-8794-5-22.
17. Boelens MC, Van Den Berg A, Fehrmann RSN, et al. Current smoking-specific gene expression signature in normal bronchial epithelium is enhanced in squamous cell lung cancer. J Pathol. 2009;218(2):182–91. doi:10.1002/path.2520. 18. Regan EA, Hokanson JE, Murphy JR, et al. Genetic epidemiology of
COPD (COPDgene) study design. Epidemiology. 2011;7(1):1–10. doi:10.3109/15412550903499522.Genetic.
19. Vogelmeier CF, Criner GJ, Martinez FJ, et al. Global Strategy for the Diagnosis, Management, and Prevention of Chronic Obstructive Lung Disease 2017 Report: GOLD Executive Summary. Am J Respir Crit Care Med. 2017:1–74. doi:10.1164/rccm.201701-0218PP.
20. Jiang H, Lei R, Ding S-W, Zhu S. Skewer: a fast and accurate adapter trimmer for next-generation sequencing paired-end reads. BMC Bioinformatics. 2014; 15(1):182. doi:10.1186/1471-2105-15-182.
21. Dobin A, Davis CA, Schlesinger F, et al. STAR: Ultrafast universal RNA-seq aligner. Bioinformatics. 2013;29(1):15–21. doi:10.1093/bioinformatics/bts635. 22. Liao Y, Smyth GK, Shi W. The Subread aligner: Fast, accurate and
23. Kersey PJ, Allen JE, Armean I, et al. Ensembl genomes 2016: more genomes, more complexity. Nucleic Acids Res. 2016;44(D1):D574–80. doi:10.1093/nar/gkv1209.
24. Andrews S. Fastqc: A Quality Control Tool For High Throughput Sequence Data. https://www.bioinformatics.babraham.ac.uk/projects/fastqc/. Published 2010. Accessed 1 May 2016.
25. Deluca DS, Levin JZ, Sivachenko A, et al. RNA-SeQC: RNA-seq metrics for quality control and process optimization. Bioinformatics. 2012;28(11):1530–2. doi:10.1093/bioinformatics/bts196.
26. Edgar R, Domrachev M, Lash AE. Gene Expression Omnibus: NCBI gene expression and hybridization array data repository. Nucleic Acids Res. 2002; 30(1):207-10.
27. Barrett T, Wilhite SE, Ledoux P, et al. NCBI GEO: Archive for functional genomics data sets - Update.Nucleic Acids Res. 2013;41(D1). doi:10.1093/nar/gks1193.
28. Leek JT. Svaseq: removing batch effects and other unwanted noise from sequencing data. Nucleic Acids Res. 2014;42(21):e161. doi:10.1093/nar/gku864. 29. Law CW, Chen Y, Shi W, Smyth GK. Voom: precision weights unlock linear
model analysis tools for RNA-seq read counts. Genome Biol. 2014;15:R29. doi:10.1186/gb-2014-15-2-r29.
30. Ritchie ME, Phipson B, Wu D, et al. Limma powers differential expression analyses for RNA-sequencing and microarray studies. Nucleic Acids Res. 2015;43(7):e47. doi:10.1093/nar/gkv007.
31. Smyth GK. Limma: linear models for microarray data. In: Gentleman R, Care V, Dudoit S, Irizarry R, Huber W, editors. Bioinformatics and computational biology solutions using R and bioconductor. New York: Springer; 2005. doi:10.1007/0-387-29362-0_23.
32. Ashburner M, Ball CA, Blake JA, et al. Gene ontology: tool for the unification of biology. The Gene Ontology ConsortiumNat Genet. 2000; 25 doi:10.1038/75556.
33. Gene Ontology Consortium. Gene ontology consortium: going forward. Nucleic Acids Res. 2015;43(Database issue):D1049–56. doi:10.1093/nar/gku1179. 34. Mi H, Huang X, Muruganujan A, et al. PANTHER version 11: expanded annotation
data from Gene Ontology and Reactome pathways, and data analysis tool enhancements.Nucleic Acids Res. 2016:gkw1138. doi:10.1093/nar/gkw1138. 35. Anders S, Reyes A, Huber W. Detecting differential usage of exons from
RNA-seq data. Genome Res. 2012;22(10):2008–17. doi:10.1101/gr.133744.111. 36. Guida F, Sandanger TM, Castagné R, et al. Dynamics of smoking-induced
genome-wide methylation changes with time since smoking cessation, 2015. Hum Mol Genet. 24(8):2349–59. https://doi.org/10.1093/hmg/ddu751. 37. Wan ES, Qiu W, Baccarelli A, et al. Cigarette smoking behaviors and time since quitting are associated with differential DNA methylation across the human genome. Hum Mol Genet. 2012;21(13):3073–82. doi:10.1093/hmg/dds135. 38. Wan ES, Qiu W, Carey VJ, et al. Smoking-associated site-specific differential
methylation in buccal mucosa in the COPDGene study. Am J Respir Cell Mol Biol. 2015;53(2):246–54. doi:10.1165/rcmb.2014-0103OC.
39. Zeilinger S, Kuhnel B, Klopp N, et al. Tobacco Smoking Leads to Extensive Genome-Wide Changes in DNA Methylation.PLoS One. 2013;8(5). doi:10. 1371/journal.pone.0063812.
40. Tsaprouni LG, Yang TP, Bell J, et al. Cigarette smoking reduces DNA methylation levels at multiple genomic loci but the effect is partially reversible upon cessation. Epigenetics. 2014;9(10):1382–96. doi:10.4161/15592294.2014.969637. 41. Ulitsky I, Bartel DP. LincRNAs: genomics, evolution, and mechanisms. Cell.
2013;154(1):26–46. doi:10.1016/j.cell.2013.06.020.
42. Ching T, Masaki J, Weirather J, et al. Non-coding yet non-trivial: a review on the computational genomics of lincRNAs. BioData Min. 2015;8(1):44. doi:10. 1186/s13040-015-0075-z.
43. Hon C, Ramilowski J, Harshbarger J, et al. An atlas of human long non-coding RNAs with accurate 5′ends. Nature. 2017. doi:10.1038/nature21374. 44. Loewen G, Zhuo Y, Zhuang Y, Jayawickramarajah J, Shan B. lincRNA HOTAIR
as a novel promoter of cancer progression. J Can Res Updates. 2014;3(3): 134–40. https://doi.org/10.6000/1929-2279.2014.03.03.3.
45. Khalil AM, Guttman M, Huarte M, et al. Many human large intergenic noncoding RNAs associate with chromatin-modifying complexes and affect gene expression. Proc Natl Acad Sci U S A. 2009;106(28):11667–72. https:// doi.org/10.1073/pnas.0904715106.
46. Wilusz JE, Sunwoo H, Spector DL. Long noncoding RNAs : functional surprises from the RNA world. 2009:1494–1504. doi:https://doi.org/10.1101/gad.1800909. 47. Wang KC, Chang HY. Molecular mechanisms of long noncoding RNAs. Mol
Cell. 2012;43(6):904–14. https://doi.org/10.1016/j.molcel.2011.08.018.Molecular.
48. Salmena L, Poliseno L, Tay Y, Kats L, Pandolfi PP. NIH Public Access. 2012; 146(3):353–8. https://doi.org/10.1016/j.cell.2011.07.014.A.
49. Liu K, Yan Z, Li Y, Sun Z. Linc2GO: a human LincRNA function annotation resource based on ceRNA hypothesis. Bioinformatics. 2013;29(17):2221–2. doi:10.1093/bioinformatics/btt361.
50. Shan K, Jiang Q, Wang X-Q, et al. Role of long non-coding RNA-RNCR3 in atherosclerosis-related vascular dysfunction. Cell Death Dis. 2016;7:e2248. http://dx.doi.org/10.1038/cddis.2016.145
51. Li JH, Liu S, Zhou H, Qu LH, Yang JH. StarBase v2.0: decoding miRNA-ceRNA, miRNA-ncRNA and protein-RNA interaction networks from large-scale CLIP-Seq data. Nucleic Acids Res. 2014;42(D1):92–7. doi:10.1093/nar/gkt1248. 52. Agarwal V, Bell GW, Nam JW, Bartel DP. Predicting effective microRNA target
sites in mammalian mRNAs. elife. 2015;4 doi:10.7554/eLife.05005. 53. Reyes A, Huber W. Transcript Isoform Differences Across Human Tissues Are
Predominantly Driven By Alternative Start And Termination Sites Of Transcription.bioRxiv. 2017:1–23. doi:10.1101/127894.
54. Bieberstein NI, Oesterreich FC, Straube K, Neugebauer KM. First exon length controls active chromatin signatures and transcription. Cell Rep. 2012;2(1): 62–8. doi:10.1016/j.celrep.2012.05.019.
55. Jonkers I, Lis JT. Getting up to speed with transcription elongation by RNA polymerase II. Nat Rev Mol Cell Biol. 2015;16(3):167–77. doi:10.1038/nrm3953. 56. Ferris B. Epidemiology standardization project (American Thoracic Society).
Am Rev Respir Dis. 1978;118(6 Pt 2):1–120.
57. Li B, Dewey CN. RSEM: accurate transcript quantification from RNA-Seq data with or without a reference genome. BMC Bioinformatics. 2011;12(1):323. doi:10.1186/1471-2105-12-323.
58. Bray NL, Pimentel H, Melsted P, Pachter L. Near-optimal probabilistic RNA-seq quantification. Nat Biotechnol. 2016;34(5):525–7. doi:10.1038/nbt.3519. 59. Patro R, Duggal G, Love MI, Irizarry RA, Kingsford C. Salmon provides fast
and bias-aware quantification of transcript expression. Nat Meth. 2017;14(4): 417–9. https://doi.org/10.1038/nmeth.4197
60. Teng M, Love MI, Davis CA, et al. A benchmark for RNA-seq quantification pipelines. Genome Biol. 2016;17(1):74. doi:10.1186/s13059-016-0940-1.
• We accept pre-submission inquiries
• Our selector tool helps you to find the most relevant journal
• We provide round the clock customer support
• Convenient online submission
• Thorough peer review
• Inclusion in PubMed and all major indexing services
• Maximum visibility for your research
Submit your manuscript at www.biomedcentral.com/submit