A refined method of quantifying
deceleration capacity index for heart rate
variability analysis
Hongyun Liu
1,2†, Ping Zhan
2, Jinlong Shi
1,2†, Guojing Wang
1,2, Buqing Wang
1and Weidong Wang
1,2*Introduction
The autonomic nervous system (ANS) plays an essential and important role in main-taining homeostasis for the body’s internal environment via two opposing branches: the sympathetic system and the parasympathetic/vagal system [1, 2]. Autonomic imbalance, characterized by a hyperactive sympathetic system and a hypoactive parasympathetic system, is associated with various pathological conditions [3, 4]. Heart rate variability (HRV), affected by both sympathetic and vagal modulations, is considered a non-inva-sive manifestation of neurocardiac function that reflects ANS dynamics and heart–brain
Abstract
Background: Phase-rectified signal averaging (PRSA) was often applied to assess the cardiac vagal modulation. Despite its broad use, this method suffers from the con-founding effects of anomalous variants of sinus rhythm. This study aimed to improve the original PRSA method in deceleration capacity (DC) quantification.
Methods: The refined deceleration capacity (DCref) was calculated by excluding from non-vagally mediated abnormal variants of sinus rhythms. Holter recordings from 202 healthy subjects and 51 patients with end-stage renal disease (ESRD) have been used for validity. The DCref was compared to original DC (DCorg) by the area under receiver operating characteristic curve.
Results: Experimental results demonstrate that the original and refined DCs calculated from 24-h, 2-h, and 30-min Holter recordings are significantly lower in patients with ESRD than those in the healthy group. In receiver operating characteristic curve analy-sis, the DCref provides better performance than the DCorg in distinguishing between the patients with ESRD and healthy control subjects. Furthermore, the refined PRSA technique enhances the low frequency and attenuates high frequency components for spectral analysis in ESRD patients.
Conclusions: The DCref appears to reduce the influence of non-vagally mediated abnormal variants of sinus rhythm and highlighting the pathological influence. DCref, especially assessed from short-term electrocardiography recordings, may be comple-mentary to existing autonomic function assessment, risk stratification, and efficacy prediction strategies.
Keywords: Phase-rectified signal averaging, Deceleration capacity, Autonomic nervous system, Heart rate variability
Open Access
© The Author(s) 2018. This article is distributed under the terms of the Creative Commons Attribution 4.0 International License (http://creat iveco mmons .org/licen ses/by/4.0/), which permits unrestricted use, distribution, and reproduction in any medium, provided you give appropriate credit to the original author(s) and the source, provide a link to the Creative Commons license, and indicate if changes were made. The Creative Commons Public Domain Dedication waiver (http://creat iveco mmons .org/publi cdoma in/zero/1.0/) applies to the data made available in this article, unless otherwise stated.
RESEARCH
*Correspondence: wang_weidong301@163. com
†Hongyun Liu and Jinlong Shi contributed equally to this work
interactions [2]. Standard time domain, frequency domain and non-linear measures of HRV are emerging as descriptors to provide information on the nervous system organi-zation of homeostatic responses in accordance with the situational requirements, and some metrics are used as dynamical biomarkers of cardiac vagal modulation [5].
Phase-rectified signal averaging (PRSA) was introduced to identify subtle short-term repeated patterns for characterizing the complex non-linear, non-stationary and quasi-periodic signals [6]. When applied to heartbeat time series, the deceleration capacity (DC) of heart rate quantified by PRSA also reflects parasympathetic/vagal control of heart rate [7]. Despite the growing application of DC [8–13], the method is affected by one shortcoming: non-vagally mediated abnormal variants of sinus rhythms in heartbeat interval time series are used to quantify DC, thus confounding the evaluation of cardiac vagal modulation. Previous studies reported that the presence of erratic sinus rhythm, sinus alternans, and their variants, influence values of HRV indices including root-mean-square of successive differences of normal-to-normal interbeat intervals (rMSSD), the percentage of normal-to-normal intervals > 50 ms different from the previous interval (pNN50), and the amount of variance in normal-to-normal intervals at respiratory fre-quencies (HF, 0.15–0.4 Hz) [14–16]. This distorted beat-to-beat variability, which does not provide a normal assessment of cardiac autonomic function, consequently leading to paradoxical interpretation between HRV indices and cardiac health. Furthermore, DC and traditional HRV measures that are believed to reflect cardiac vagal modulation might have relatively little predictive power for outcomes due to the confounding effects of non-vagally mediated abnormal variants of sinus rhythms.
The purpose of this study is to develop and investigate a refined version of PRSA to quantify DC, represented as refined deceleration capacity (DCref), by excluding from
non-vagally mediated abnormal variants of sinus rhythms in heartbeat interval time series to counteract the shortcoming. This approach is expected to be more accurate than original PRSA in assessing cardiac vagal modulation. Experimental data including long-term electrocardiography (ECG) recordings were obtained from healthy and end-stage renal disease (ESRD) subjects. ESRD is characterized by altered cardiac autonomic function, reflecting as vagal modulation damage and sympathetic nerve overactivity [17]. The comparison between original deceleration capacity (DCorg) and DCref
quanti-fied from different ECG-regimens in healthy subjects and patients with ESRD is utilized to demonstrate the performance of the two approaches over real clinical data.
Materials and methods The original PRSA method
time series, is a measure of cardiac vagal modulation [7]. The DC quantification for HRV signal is essentially based on four steps: (1) definition of anchor points according to certain properties of the heartbeat interval time series; (2) definition of surround-ings with certain length around each anchor point; (3) the PRSA signal is obtained by averaging the signals within the segments which are aligned at the anchors; and (4) DC is quantified corresponding to a computation of PRSA signal by Haar wavelet analysis [6, 7].
Definition of deceleration‑related anchors
DC is computed based on heartbeat interval time series RR= {RRi} derived from ECG
recordings. In the simple version of the PRSA algorithm, for computation of DC, heart-beat intervals longer than the preceding interval are identified as deceleration-related anchors ( RRiγ, γ =1,. . .,M , M is the total number of anchor points).
Heartbeat interval time series is almost always interfered by technical and physiologi-cal artifacts due to the computational algorithm, ectopic beats and arrhythmic events which must not be qualified as anchor points. To overcome this problem, heartbeat interval prolongations of more than a certain threshold are excluded. However, heartbeat intervals with high-frequency fluctuations that compete with or even exceed the short-est-term modulatory responsiveness of the vagal system still enters the DC quantifica-tion process, thus distort high-frequency variability not due to cardiac vagal modulaquantifica-tion.
Definition of segments
Segments of heartbeat interval time series with a length of 2L are defined around each anchor point RRiγ,γ =1,. . .,M . Anchor points close to the beginning or the end of the time series, where no full surroundings of length 2L are available, are disregarded. Seg-ments that surround adjacent anchors can overlap. The heartbeat intervals in segment number γ , corresponding to anchor point RRiγ are as following.
Phase rectification and signal averaging
All segments γ,γ =1,. . .,M are aligned and centered at their anchor points RRiγ and the PRSA signal RR(k) is obtained by averaging over all segments.
In this average, non-periodic components cancel out, and only events that have a fixed phase relationship with the anchor points, i.e., all periodicities and quasi-periodicities, ‘survive’ the procedure. RR(k) represents important features of the original heartbeat
interval data containing all quasi-periodicities aligned with phase zero in the center (at k = 0).
(1)
RRi >RRi−1
(2) RRiγ−L,RRiγ−L+1,. . .,RRiγ,. . .,RRiγ+L−2,RRiγ+L−1
(3) RR(k)= 1
M
M
γ=1
Quantification of DC
PRSA signal RR(k) is quantified by Haar wavelet analysis, where the scale of 2 is used to
calculate DC.
RR(0) is defined as the average of the heartbeat intervals at all anchor points, RR(1)
and RR(−1) are the averages of the heartbeat intervals immediately following and
pre-ceding the anchor points, etc.
Refined DC quantification
Evidence suggests that erratic rhythm can be a consequence of high sympathetic activa-tion [18]. It is also speculated that the observed non-vagally mediated HRV also termed as heart rate fragmentation including erratic sinus rhythm, sinus alternans, and their variants is originated from the breakdown of one or more components of the regula-tory network controlling heart rate dynamics [18–20]. Moreover, this fragmentation or anomalous short-term HRV are marked by abrupt changes in the sign of heart rate decel-eration/acceleration can be quantified by statistical analysis of inflection points or zero-crossing points [19]. To address this confounding effects of non-vagally mediated HRV, which may distort DC not due to cardiac vagal modulation, we proposed a refined PRSA technique to quantify DC by excluding inflection points in heartbeat interval time series.
Definition of inflection points
For given ECG recordings, the time series of heartbeat intervals, {RRi} = {tRi−tRi−1} , where tRi represents the time of occurrence of the ith sinus beat, and the time series of the differences between consecutive heartbeat intervals (increments), {RRi} = {RRi−RRi−1} , were derived. The inflection points in the heartbeat interval time series, or equivalently, the zero-crossing points in the increment time series are defined as shown in Fig. 1.
(4)
DCorg=[RR(0)+RR(1)−RR(−1)−RR(−2)]/4
a
b c
A tRi represents an inflection point if Eq. (5) is satisfied, that is, if tRi is an instant of inversion of heart rate deceleration/acceleration sign or of change to or from zero.
Quantification of refined DC
After the identification of deceleration-related anchor points and inflection points are selected according to Eqs. (1) and (5), respectively (Fig. 1). Segments with the length of 2L are identified around each deceleration-related anchor. The refined PRSA signal is obtained by averaging over all segments, which are aligned and centered at deceleration-related anchors. The refined DC (DCref) is quantified according to Eq. (5). Consequently,
omitting the segments centered at inflection points will reduce or eliminate the effects of heart rate fragmentation and improve the performance of the PRSA technique to assess the cardiac vagal tone modulation.
Experimental data and analysis procedure
We employed two long-term (24-h) ECG ambulatory databases which are made avail-able via the University of Rochester Telemetric and Holter ECG Warehouse (THEW) archives (http://thew-proje ct.org/datab ases.htm). In addition to ECG data, automated beat annotations are available after reviewing and adjudicating manually in both data-bases. All human data was obtained retrospectively from completed, Institutional-Review-Board-approved clinical research studies with subject de-identification. These trials complied with the Declaration of Helsinki and all subjects signed informed con-sent documents.
The Healthy database (THEW identification: E-HOL-03-0202-003) comprises 24-h Holter recordings from 202 ostensibly healthy subjects (102 males). Subjects had (1) no overt cardiovascular disease or history of cardiovascular disorders; (2) no reported med-ications, (3) a normal physical examination, (4) a 12-lead ECG showing sinus rhythm with normal waveforms (or a normal echocardiogram and normal ECG exercise test-ing in the presence of any questionable findtest-ings ECG changes). The ECG signals were recorded at a sampling frequency of 200 Hz. Overall, we analyzed data from 191 healthy adult subjects by excluding from 11 subjects with poor ECG quality. The ESRD data-base (THEW identification: E-HOL-03-0202-016) comprises 48-h Holter recordings with a sampling frequency of 1000 Hz from 51 ESRD patients with high risk for cardiac arrhythmias and sudden cardiac death (30 males). ESRD subjects confirmed the history of hypertension or diabetes requiring treatment enrolled in the study. Exclusion criteria included a history of chronic atrial fibrillation, with class I antiarrhythmic, pacemaker, implantable cardioverter defibrillator device, cardiac resynchronization therapy device, female subject of childbearing potential not using medically prescribed contraceptive measures and subject unable to cooperate with the protocol due to dementia, psycho-logical, or other related reason.
For our analysis, all 24-h Holter recordings were analyzed automatically and annotated files were then carefully inspected and corrected by technicians for extracting the RR intervals. Furthermore, any RR-interval that exhibited more than 20% change from the previous RR-interval were excluded, as they were likely to be related to premature beats, artifacts and measurement noise [21]. 2-h and 30-min episodes of heartbeat intervals (5)
without exercise and naps within daytime (between 8 a.m. and 5 p.m.) were extracted from each recording for PRSA analysis. All ECG segments were selected from the same period to reduce confounding effects of the circadian rhythm and physical activity. Measures of DC for long-term (24-h), 2-h and 30-min ECG recordings were calculated based on the original and the proposed PRSA method, respectively.
Statistical analysis
Data were presented as the mean ± standard deviation (SD) for continuous variables. Gauss-ian distribution and homogeneity of varGauss-iance tests were applied to determine the distribution and homoscedasticity of sample data. Because of the non-normal distribution and hetero-geneity of variance of some sample data, a Mann–Whitney U test was applied to compare DCs between groups (healthy vs. ESRD). Correlation analysis was perfomed between DCorg
and DCref using Spearman’s correlation test. In order to compare the ability of DCorg indices
and DCref to differentiate the ESRD patients from the healthy control subjects, receiver
oper-ating characteristic curve (ROC) was constructed from the sensitivity and specificity after leave-one-out cross-validation of the continuous variables to assess the goodness of fit of each model. The area under the ROC curve (AUCs) gave an estimate of the overall discrimi-nate ability. All statistical analyses were performed using SPSS version 20 software package (SPSS, Chicago, Ill, USA). All the p values were adjusted using the false discovery rate (FDR) method and a value of p < 0.05 was considered to indicate statistical significance.
Results
Demographic data and clinical factors of ESRD patients and healthy control subjects are presented in Table 1. Figure 2 shows the deceleration-related PRSA signal and DCs of 24-h, 2-h and 30-min recordings of heartbeat intervals in a patient with ESRD. The
Table 1 Demographic data and clinical factors of all study population
NA not available, BMI body mass index, BP_SYS systolic blood pressure, BP_DIA diastolic blood pressure, LVEF left ventricular ejection fraction, ESRD end-stage renal disease
Variables Healthy (n = 191) ESRD (n = 51)
Male/female 96/95 30/21
Age (year) 38.0 ± 15.5 60.0 ± 11.9
Height (cm) 168.8 ± 10.4 NA
Weight (kg) 69.6 ± 15.2 NA
BMI (kg/cm2) 20.07 ± 4.44 NA
BP_SYS (mmHg) 116 ± 13 139 ± 22
BP_DIA (mmHg) 75 ± 8 76 ± 13
Diabetes Mellitus, n (%) NA 32 (62.7%)
Hypertension, n (%) NA 48 (94.1%)
LVEF (%) NA 59 ± 16
Glucose (mg/dL) NA 121 ± 49
Calcium (mg/dL) NA 8.9 ± 1.6
Phosphate (mg/dL) NA 5.2 ± 1.4
Albumin (g/dL) NA 4.0 ± 0.4
Hemoglobin (g/dL) NA 13.1 ± 12.3
segment length L for both the original and refined PRSA methods is set to 64. Simi-lar patterns of the original and refined PRSA curves were observed for both long-term (24-h) and short-term (2-h and 30-min) ECG recordings. The heartbeat interval oscilla-tions in the refined PRSA curves extracted from different length of ECG recordings are enhanced, especially around the deceleration-related anchor points. Different levels of the heartbeat intervals obtained by the original and refined PRSA methods can also be observed. As the length of the analyzed ECG signal is shortened, the difference between original and refined PRSA signals is also reduced.
The averages of the normalized spectra obtained with the original and refined PRSA signal in the group of 51 patients with ESRD are depicted in Fig. 3. Refined PRSA method clearly enhances the power of low frequency (LF, 0.04–0.15 Hz) and attenuates the power of high frequency (HF, 0.15–0.4 Hz) components for 24-h, 2-h and 30-min ECG recordings, respectively.
DCs calculated based on original and refined PRSA methods with different criteria of anchor point selection for the healthy control subjects and the ESRD group are given in Table 2. For the healthy group, we compared DCs quantified by original and modified PRSA methods. DCref values were significantly higher than DCorg for all 24-h (mean
differ-ence 4.32 ± 1.68, p < 0.001), 2-h (mean difference 4.64 ± 1.97, p < 0.001)and 30-min (mean difference 4.72 ± 2.03, p < 0.001) ECG segments. Furthermore, the Pearson’s correlation
a b
c d
e f
Fig. 2 Representative original and refined PRSA signals of 24-h (a, b), 2-h (c, d) and 30-min (e, f) recordings of heartbeat intervals in one patient with end-stage renal disease (ESRD)
a b c
Fig. 3 The averages of the normalized spectra obtained with the original and refined PRSA signal in the
coefficients between the DCorg and DCref for 24-h, 2-h and 30-min ECG recordings were
0.980, 0.983 and 0.981 (all p < 0.001), respectively.
ESRD patients substantially had significantly lower DCorg and DCref compared to healthy
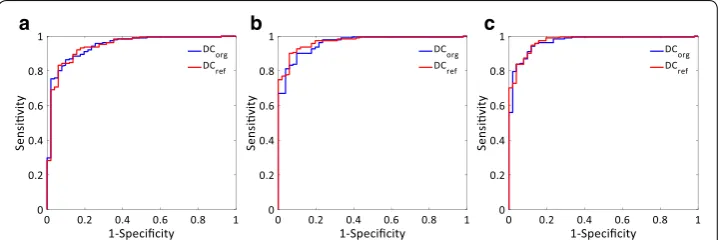
control subjects for the analyzed three lengths of ECG episodes (all p < 0.001). In ROC curve analysis, The areas under the curve (AUC) of DCorg and DCref were 0.945 vs. 0.944,
0.960 vs. 0.969, and 0.967 vs. 0.971 for 24-h, 2-h and 30-min ECG recordings, respectively (Table 2 and Fig. 4). The AUC of DCref from long-term (24-h) ECG recordings was
com-parable to that of DCorg while the AUCs of DCref from short-term (2-h and 30-min) ECG
recordings were slightly higher than those of DCorg. In addition, the maximum of Youden’s
index of long-term (24-h) DCref was higher than that of short-term (2-h and 30-min) DCorg. DCref from 2-h ECG recordings, providing the highest value of Youden’s index, had the best
discrimination power of all calculated DCs. The best cutoff value of DCref from 2-h ECG
episodes for distinguishing ESRD from healthy subjects was 8.26 ms, with a sensitivity of 90.1%, specificity of 94.1%.
Table 2 Measures of original and refined deceleration capacity in healthy and ESRD groups
DCorg original deceleration capacity, DCref refined deceleration capacity, ESRD end-stage renal disease, AUC area under receiver operating characteristic curve
Variables Healthy (n = 191) ESRD (n = 51) p value AUC Youden’s index
24-h
DCorg (msec) 13.43 ± 5.60 4.36 ± 2.60 < 0.001 0.945 ± 0.017 0.766
DCref (msec) 17.77 ± 6.79 6.25 ± 3.59 < 0.001 0.944 ± 0.018 0.774
2-h
DCorg (msec) 11.94 ± 5.28 3.50 ± 1.87 < 0.001 0.960 ± 0.013 0.802
DCref (msec) 16.61 ± 6.94 4.81 ± 2.39 < 0.001 0.969 ± 0.011 0.842
30-min
DCorg (msec) 12.40 ± 5.46 3.25 ± 1.94 < 0.001 0.967 ± 0.012 0.825
DCref (msec) 17.14 ± 7.12 4.53 ± 2.60 < 0.001 0.971 ± 0.011 0.830
a b c
Fig. 4 Analysis of the discrimination power of the healthy and end-stage renal disease (ESRD) groups by
receiver operating characteristic curve (ROC) analysis. The areas under the curve (AUC) of DCorg and DCref were
Discussion
In the present study, a refined method was presented for the quantification of decelera-tion capacity of heart rate. DCs were calculated through proposed refined and original PRSA methods from different length of ECG recordings and were tested their predic-tive value in healthy subjects and patients with ESRD. The present findings demonstrate that the refined PRSA technique better reflects the periodic components in heartbeat intervals and enhances the HF and LF components for spectral analysis. DCref, with
sig-nificantly higher values compared to DCorg, was significantly lower for ESRD group than
that with healthy group. This phenomenon was observed for the analysis of 24-h, as well as 2-h and 30-min ECG recordings. Furthermore, the DCref quantified from different
length of ECG episodes outperformed corresponding DCorg in separating healthy
sub-jects from patients with ESRD. Among them, DCref obtained through 2-h ECG
record-ings have the best discrimination ability.
HRV analysis is a non-invasive, simple and effective method for assessing the sympa-thovagal balance of ANS and is used to predict the risk to many cardiovascular diseases and neurological disorders [4, 5, 22, 23]. The analysis of blood pressure variability (BPV) has also been used to evaluate cardiovascular autonomic regulatory function [24, 25]. However, conventional linear time and frequency analyses are often applied to calculate measures of HRV and BPV, even though the regulation of the ANS on cardiac activity is considered to be a nonlinear physiological activity [26, 27]. Despite the widespread application of HRV, linear approaches to HRV signals may introduce intrinsic compu-tational errors [28–30]. Moreover, since traditional linear HRV analyses cannot accu-rately distinguish the vagal and sympathetic activities of the ANS, the interpretation of the HRV measures is more complex than generally appreciated, and there is potential for incorrect conclusions and for excessive or unfounded extrapolations [5, 21, 23, 27]. Therefore, efficient methods for characterizing the complex non-linear, non-stationary and quasi-periodic ECG signal remain to be established. In 2006, PRSA method has been introduced to make possible an approximate distinction of autonomic control effects on sinus node, by selectively assessing the capacity of heart rate to decelerate and accelerate, representing an indirect integrated quantification of the activities of the autonomic systems. Since the PRSA technique is able to robustly extract and enhance periodic quasi-periodic oscillations masked by noise and artifacts from complex signals, it has been proven to yield stronger prognostic power than the traditional parameters of HRV among post-myocardial infarction patients [7]. The main characteristic of DCref
in the present study is the use of stricter criteria for the selection of the deceleration-related anchor points. This allows a smaller number of legal vagally-mediated anchor points to participate in the quantification, thereby improving the accuracy of cardiac vagal modulation assessment.
presence of these abnormal variants of sinus rhythm limits the utility of original PRSA for HRV analysis since an increase in the overall amount of short-term vari-ability can no longer be solely attributed to enhanced vagal tone modulation. Pan et al. applied sinusoidal signal analysis to anchor point selection to improve the PRSA processing, and proved that the modified DC is superior to the conventional approach in distinguishing chronic heart failure cases [33]. Sacha et al. showed that the lower anchors filtering threshold could decrease the correlation between DC and high-frequency fluctuations [34]. However, the influences of anchors filtering with different thresholds on the prognostic or discriminative power remain to be eluci-dated. Piskorski et al. defined heart rate asymmetry by acceleration and deceleration runs, which was reduced in post-infarction patients with increased risk of mortality [35]. Arsenos et al. also proposed DCsgn and BBDC, which can discriminate more
efficiently healthy young and elderly subjects than the original PRSA method [36]. However, the interpretation of the features of DC and AC were not linked to spe-cific physiological regulatory mechanisms in the process of improving the PRSA technique. Nasario-Junior et al. introduced a DC adaptation from the perspective of synchronization and improved the AUC diagnostic accuracy of DC to assess physi-cal conditioning [37]. According to the physiological origins and mechanisms of HRV, the present study proposed a refined quantitative approach, which excluding from non-vagally mediated inflection points to quantify DC for assessing the car-diac vagal tone modulation. The results of our study showed that the refined PRSA method could enhance the power of LF and attenuate the power of LF components compared with original PRSA technique. This is consistent with our understanding of the refined PRSA method, which allows higher accuracy for detecting the most important frequencies, especially the HF components by addressing the confound-ing effects of heart rate fragmentation. Since HF is usually interpreted as a measure of cardiac vagal tone modulation, the refined PRSA may provide a promising method for accurate assessment of cardiac vagal tone modulation and integrate probe of the cardiac neuroautonomic-electrophysiologic regulatory system.
It has been observed that an imbalance between cardiac vagal and sympathetic modulation occurs and that a sympathetic activation is an early event in the patho-physiology of ESRD [38, 39]. In our study, the significant lower DC values suggest that patients with ESRD were in a lower vagal modulating state compared with healthy subjects. Since there exist reciprocal changes in the interaction of sympa-thetic and parasympasympa-thetic nervous systems, that is the activation of sympasympa-thetic nerve is accompanied by the withdrawal of parasympathetic nerve, and vice versa. The sympathetic activation in ESRD might be a secondary phenomenon. Vagal denervation, which weakened antagonism to sympathetic activity, is most likely to induce the abnormal activation of the sympathetic nerve. The phenomenon that enhanced LF band and attenuated HF band by the proposed refined PRSA technique is consistent with our understanding of antagonistic mechanisms of the sympathetic and parasympathetic nervous system. Furthermore, the proposed DCref in the
pre-sent study was able to improve the classification of healthy subjects from ESRD patients compared to DCorg. In addition to showing the higher AUC values (except
Youden’s index, thus featuring better discrimination power. Most importantly, DCref
from 2-h ECG recordings had the best discrimination power of all calculated DCs. Similar with a recent study [40], our findings also indicate that short-term DCref,
especially from 2-h ECG recordings may be a more useful and better index for auto-nomic bedside risk stratification that as complementary to traditional HRV meas-ures and clinical factors.
Several limitations are present in this study. First, the sample size is small for ESRD group. The ESRD patients enrolled after strictly screening through enrollment exclusion and criteria was most likely to be in a similar autonomic dysfunction, lead-ing to the advantage of DCref is not particularly obvious. Second, only three
ECG-regimes, the 24-h, 2-h and 30-min ECG recordings were used to quantify DCs. More ECG-regimens should be used to determine the optimal ECG length for DCref
quan-tification, which could be performed in everyday clinical practice. Third, the pro-posed DCref was verified by separating healthy subjects from ESRD patients. Since
the original PRSA method was developed as a prognostic tool for risk stratification, particularly mortality in post-myocardial infarction patients. Further studies are warranted to demonstrate advantages of DCref in autonomic risk stratification.
Conclusions
The refined deceleration capacity index (DCref), which excludes from non-vagally
mediated inflection points, provides an accurate assessment of cardiac vagal modula-tion. Furthermore, DCref also provides a better distinction between healthy subjects
and patients with ESRD compared with DCorg. DCref derived from 2-h ECG
record-ings, which have the best discrimination ability, might be complementary to existing autonomic function assessment, risk stratification, and efficacy prediction techniques for clinical use.
Abbreviations
PRSA: phase-rectified signal averaging; DC: deceleration capacity; ESRD: end-stage renal disease; ANS: autonomic nerv-ous system; HRV: heart rate variability; rMSSD: root-mean-square of successive differences of normal-to-normal interbeat intervals; pNN50: the percentage of normal-to-normal intervals > 50 ms different from the previous interval; ECG: electro-cardiography; ROC: receiver operating characteristic curve; AUC : area under ROC curve; LF: low frequency (0.04–0.15 Hz); HF: high frequency (0.15–0.4 Hz).
Authors’ contributions
HYL and JLS: responsible for the design and implementation of research. PZ, GJW and BQW: responsible for ECG data analysis and classification. HYL wrote the main body of the manuscript. WDW supervised the work. All authors read and approved the final manuscript.
Author details
1 Department of Biomedical Engineering, Chinese PLA General Hospital, Room_105, South Ward Building, No. 28 Fuxing Road, Haidian District, Beijing 100853, China. 2 Center of Medical Device R & D and Clinical Evaluation, Chinese PLA General Hospital, Beijing 100853, China.
Acknowledgements
The authors thank THEW for the support to providing all the datasets in this study.
Competing interests
The authors declare that they have no competing interests.
Availability of data and materials
The datasets used and/or analyzed during the current study are available from the corresponding author on reasonable request.
Disclosures Not applicable.
Ethics approval and consent to participate
All human data from Institutional-Review-Board-approved clinical research studies were archived at the University of Rochester Medical Center Telemetric and Holter ECG Warehouse (THEW) and made available for analyses by other investigators.
Funding
This study was supported by National Key Technology R&D Program, Ministry of Science and Technology (2013BAI03, 2013BAI03B03, 2015BAI01B08), Chinese PLA General Hospital (2016-tm-042) and National Natural Science Foundation of China (61372047, 61701540).
Publisher’s Note
Springer Nature remains neutral with regard to jurisdictional claims in published maps and institutional affiliations.
Received: 25 October 2018 Accepted: 13 December 2018
References
1. Cannon WB. The James-Lange theory of emotion: a critical examination and an alternative theory. Am J Psychol. 1987;100:567–86.
2. Riganello F, Garbarino S, Sannita WG. Heart rate variability, homeostasis, and brain function: a tutorial and review of application. J Psychophysiol. 2012;26:178–203.
3. Lown B, Verrier RL. Neural activity and ventricular fibrillation. N Engl J Med. 1976;294:1165–70.
4. Billman GE, Schwartz PJ, Stone HL. Baroreceptor reflex control of heart rate: a predictor of sudden cardiac death. Circulation. 1982;66:874–80.
5. Force Task. Heart rate variability: standards of measurement, physiological interpretation, and clinical use. Circula-tion. 1996;93:1043–65.
6. Bauer A, Kantelhardt JW, Bunde A, Barthel P, Schneider R, Malik M, et al. Phase-rectified signal averaging detects quasi-periodicities in non-stationary data. Phys A. 2006;364:423–34.
7. Bauer A, Kantelhardt JW, Barthel P, Schneider R, Makikallio T, Ulm K, et al. Deceleration capacity of heart rate as a predictor of mortality after myocardial infarction: cohort study. Lancet. 2006;367:1674–81.
8. Kantelhardt JW, Bauer A, Schumann AY, Barthel P, Schneider R, Malik M, et al. Phase-rectified signal averaging for the detection of quasi-periodicities and the prediction of cardiovascular risk. Chaos. 2007;17:015112.
9. Birkhofer A, Geissendoerfer J, Alger P, Mueller A, Rentrop M, Strubel T, et al. The deceleration capacity—a new meas-ure of heart rate variability evaluated in patients with schizophrenia and antipsychotic treatment. Eur Psychiatry. 2013;28:81–6.
10. Bas R, Vallverdú M, Valencia JF, Voss A, de Luna AB, Caminal P. Evaluation of acceleration and deceleration cardiac processes using phase-rectified signal averaging in healthy and idiopathic dilated cardiomyopathy subjects. Med Eng Phys. 2015;37:195–202.
11. Hu W, Jin X, Zhang P, Yu Q, Yin G, Lu Y, et al. Deceleration and acceleration capacities of heart rate associated with heart failure with high discriminating performance. Sci Rep. 2016;6:23617.
12. Duckheim M, Bensch C, Kittlitz L, Götz N, Klee K, Groga-Bada P, et al. Deceleration capacity of heart rate predicts 1-year mortality of patients undergoing transcatheter aortic valve implantation. Clin Cardiol. 2017;40:919–24. 13. Chen Z, Yang Y, Zou C, Zhang Y, Huang X, Li X, et al. Low heart deceleration capacity imply higher atrial
fibrillation-free rate after ablation. Sci Rep. 2018;8:5537.
14. Stein PK. Heart rate variability is confounded by the presence of erratic sinus rhythm. Comput Cardiol. 2002;26:669–72.
15. Stein PK, Domitrovich PP, Hui N, Rautaharju P, Gottdiener J. Sometimes higher heart rate variability is not better heart rate variability: results of graphical and nonlinear analyses. J Cardiovasc Electrophysiol. 2005;16:954–9. 16. Stein PK, Le Q, Domitrovich PP. Development of more erratic heart rate patterns is associated with mortality
post-myocardial infarction. J Electrocardiol. 2008;41:110–5.
17. Vita G, Bellinghieri G, Trusso A, Costantino G, Santoro D, Monteleone F, et al. Uremic autonomic neuropathy studied by spectral analysis of heart rate. Kidney Int. 1999;56:232–7.
18. Tulppo MP, Mäkikallio TH, Seppänen T, Airaksinen KEJ, Huikuri HV. Heart rate dynamics during accentuated sympa-thovagal interaction. Am J Physiol. 1998;274:H810.
19. Costa MD, Davis RB, Goldberger AL. Heart rate fragmentation: a new approach to the analysis of cardiac interbeat interval dynamics. Front Physiol. 2017;8:255.
20. Costa MD, Davis RB, Goldberger AL. Heart rate fragmentation: a symbolic dynamical approach. Front Physiol. 2017;8:827.
21. Clifford GD, McSharry PE, Tarassenko L. Characterizing artifact in the normal human 24-hour RR time series to aid identification and artificial replication of circadian variations in human beat to beat heart rate using a simple thresh-old. Comput Cardiol. 2002;29:129–32.
22. Billman GE, Huikuri HV, Sacha J, Trimmel K. An introduction to heart rate variability: methodological considerations and clinical applications. Front Physiol. 2015;6:55.
• fast, convenient online submission
•
thorough peer review by experienced researchers in your field
• rapid publication on acceptance
• support for research data, including large and complex data types
•
gold Open Access which fosters wider collaboration and increased citations maximum visibility for your research: over 100M website views per year
•
At BMC, research is always in progress.
Learn more biomedcentral.com/submissions
Ready to submit your research? Choose BMC and benefit from:
24. Zhu W, Qiu J, Ma L, Lei H, Cai Z, Zhao H, et al. A new scoring system for evaluating coronary artery disease by using blood pressure variability. Australas Phys Eng Sci Med. 2017;40:751–8.
25. Xu L, Lei H, Qiu J, Ma J, Zhao H, Deng Y, et al. Correlation between beat-to-beat blood pressure variability and arterial stiffness in healthy adults in the cold pressor test. Australas Phys Eng Sci Med. 2015;39:977–85.
26. Costa M, Goldberger AL, Peng CK. Multiscale entropy analysis of complex physiologic time series. Phys Rev Lett. 2002;89:068102.
27. Manor B, Costa MD, Hu K, Newton E, Starobinets O, Kang HG, et al. Physiological complexity and system adaptabil-ity: evidence from postural control dynamics of older adults. J Appl Physiol. 2010;109:1786–91.
28. Goldberger AL, Amaral LAN, Hausdorff JM, Ivanov P, Peng CK, Stanley HE. Fractal dynamics in physiology: alterations with disease and aging. Proc Natl Acad Sci. 2002;99:2466–72.
29. Lombardi F. Chaos theory, heart rate variability, and arrhythmic mortality. Circulation. 2000;101:8–10.
30. Peng CK, Havlin S, Stanley HE, Goldberger AL. Quantification of scaling exponents and crossover phenomena in nonstationary heartbeat time series. Chaos. 1995;5:82–7.
31. Graatsma EM, Mulder EJH, Vasak B, Lobmaier SM, Steinburg SPV, Schneider KT, et al. Average acceleration and decel-eration capacity of fetal heart rate in normal pregnancy and in pregnancies complicated by fetal growth restriction. J Matern Fetal Neonatal Med. 2012;25:2517–22.
32. Buzea CA, Dan GA, Dan AR, Delcea C, Balea MI, Gologanu D, et al. Deceleration and acceleration capacities in risk stratification for arrhythmias in patients with chronic obstructive pulmonary disease. Am J Ther. 2017;24:e44. 33. Pan Q, Gong Y, Gong S, Hu Q, Zhang Z, Yan J, et al. Enhancing the deceleration capacity index of heart rate by
modified-phase-rectified signal averaging. Med Biol Eng Comput. 2010;48:399–405.
34. Sacha J, Sobon J, Sacha K, Muller A, Schmidt G. Short-term deceleration capacity reveals higher reproducibility than spectral heart rate variability indices during self-monitoring at home. Int J Cardiol. 2011;152:271–2.
35. Piskorski J, Guzik P. The structure of heart rate asymmetry: deceleration and acceleration runs. Physiol Meas. 2011;32:1011–23.
36. Arsenos P, Manis G. Deceleration capacity of heart rate: two new methods of computation. Biomed Signal Process Control. 2014;14:158–63.
37. Nasariojunior O, Benchimolbarbosa PR, Nadal J. Refining the deceleration capacity index in phase-rectified signal averaging to assess physical conditioning level. J Electrocardiol. 2014;47:306–10.
38. Converse RLJ, Jacobsen TN, Toto RD, Jost CM, Cosentino F, Fouad-Tarazi F, et al. Sympathetic overactivity in patients with chronic renal failure. N Engl J Med. 1992;327:1912–8.
39. Hausberg M, Kosch M, Harmelink P, Barenbrock M, Hohage H, Kisters K, et al. Sympathetic nerve activity in end-stage renal disease. Circulation. 2002;106:1974–9.