EZ Entropy: a software application
for the entropy analysis of physiological
time‑series
Peng Li
*Background
It is a contemporary challenge to identify characteristics from physiological signals or time-series that are relevant to aging or disease progression. Efforts have been made in using moments, either lower-ordered or higher-ordered, frequency-domain analysis and time-frequency analysis to mine the data. But results based upon these traditional approaches so far are not quite satisfactory. One of the possible reasons might be that those that could be captured by these traditional analyses are usually also visually iden-tifiable which is not the case for physiological data. What is relevant to physiology or
Abstract
Background: Entropy analysis has been attracting increasing attentions in the recent two or three decades. It assesses complexity, or irregularity, of time-series which is extraordinarily relevant to physiology and diseases as demonstrated by tremendous studies. However, the complexity can hardly be appreciated by traditional methods including time-, frequency-domain analysis, and time-frequency analysis that are the common built-in options in commercialized measurement and statistical software. To facilitate the entropy analysis of physiological time-series, a new software application, namely EZ Entropy, was developed and introduced in this article.
Results: EZ Entropy was developed in MATLAB® environment. It was programmed in an object-oriented style and was constructed with a graphical user interface. EZ Entropy is easy to operate through its compact graphical interface, thus allowing research-ers without knowledge of programming like clinicians and physiologists to perform such kind of analysis. Besides, it offers various settings to meet different analysis needs including (1) processing single data recording, (2) batch processing multiple data files, (3) sliding window calculations, (4) recall, (5) displaying intermediate data and final results, (6) adjusting input parameters, and (7) exporting calculation results after the run or in real-time during the analysis. The analysis results could be exported, either manually or automatically, to comma-separated ASCII files, thus being compatible to and easily imported into the common statistical analysis software. Code-wise, EZ Entropy is object-oriented, thus being quite easy to maintain and extend.
Conclusions: EZ Entropy is a user-friendly software application to perform the entropy analysis of time-series, as well as to simplify and to speed up this useful analysis. Keywords: Entropy, Software, Program, MATLAB
Open Access
© The Author(s) 2019. This article is distributed under the terms of the Creative Commons Attribution 4.0 International License (http://creat iveco mmons .org/licen ses/by/4.0/), which permits unrestricted use, distribution, and reproduction in any medium, provided you give appropriate credit to the original author(s) and the source, provide a link to the Creative Commons license, and indicate if changes were made. The Creative Commons Public Domain Dedication waiver (http://creat iveco mmons .org/publi cdoma in/zero/1.0/) applies to the data made available in this article, unless otherwise stated.
SOFTWARE
disease may be hiding deep behind the fluctuations of the signal. In the most recent two or three decades, researchers from interdisciplinary fields have proposed the concept of nonlinear dynamical analysis, and from then on lines of evidence have demonstrated the unique power of various nonlinear dynamical characteristics in this regard [1–4].
Amongst the vast number of different nonlinear dynamical methods, entropy analysis has gained broad attention, and, thereby, has witnessed its wide suitability in time-series of limited length, short length, or even extremely short length [5–17]. However, lack of knowledge in programming has been hindering most clinicians, and physiologists etc., from performing such kind of analysis. Although many researchers have published or shared open-source codes either in formal publications [14] or in various online reposi-tories [18–24], neither of them is really user-friendly as it still requires users to have at least some basic coding training in order to apply these codes.
The aim of this current work was to introduce a graphical interface-based soft-ware application, namely EZ Entropy, which was dedicatedly developed for the pur-poses of calculating the entropy of physiological time-series (and certainly other types of physical time-series). EZ Entropy is quite easy to operate with only few clicks to do the calculations of several common entropy measures. And it comes with a couple of differ-ent calculation options so as to adjust input parameters, to batch process multiple sig-nal recordings, to do the calculations through sliding windows, to display intermediate results, and so on. In the section below, I will start with a short review of different entropy measures and in “Implementation” section, this software will be described in details.
Entropy measures: a brief historical review
Entropy came from a field called thermodynamics, a branch of physics. It was initially proposed as a state function of a thermodynamic system which depends only on the current state while is independent of how the state has been achieved. Later on, this macroscopic concept was found to be meaning uncertainty or disorder microscopi-cally measuring the possible number of microscopic states in which the system could be arranged.
Being directly analogous to the microscopic thermodynamic definition, information entropy was defined to quantify the average information content to be expected from an event, or, in other words, the uncertainty or unpredictability of the state of an event. In time-series analysis field, this concept had triggered the idea of assessing the unpre-dictability of the evolution of dynamical systems, specifically the Kolmogorov entropy of time-series (or Kolmogorov–Sinai entropy, a specific case of Kolmogorov entropy with the time delay factor being equal to unity) [25].
proposed a couple of solutions to improve its performance. In the subsections below, I will briefly summarize the algorithms of ApEn and two common refined ApEn metrics, namely sample entropy (SampEn) and fuzzy entropy (FuzzyEn). Besides, I will also introduce sev-eral other entropy-like metrics that were proposed in similar contexts.
ApEn and refined ApEn algorithms
Entropy metrics, in general, quantify the similarity of motifs (which are called vectors in the state space representation) as a proxy to the unpredictability or irregularity of a time-series. For a time-series of N points u=u(i), 1≤i≤N , its m-dimension state space
representa-tion is
where 1≤i≤N−mτ and τ is the time delay parameter, which, together with the
dimension parameter m, determine how well the state space reconstruction of the dynamical system is. In order to quantify whether two vectors, namely, Xm(i) and Xm(j) ,
are similar, the Chebyshev distance between the two vectors is calculated as follows:
The difference between ApEn and its refined algorithms lies basically in the means that is used to assess the overall similarity of each pair of vectors in the state space, which, in turn, leads to different performance.
ApEn
In ApEn, the percentage of the vectors Xm(j) that are within r of Xm(i) is calculated by
Ci(m)(r)= N (m) i (r)
N−mτ , where N (m)
i (r) indicates the number of j’s that meet di,j≤r , and 1≤j≤N−mτ . And then the average of the percentage over 1≤i≤N−mτ after
log-arithmic transform is defined by �(m)(r)= N−m1 τi=N−m1 τlnCi(m)(r) . In a similar way, �(m+1)(r) is defined after increasing the dimension to m+1 . Then, the ApEn value of the time-series u can be calculated by [5]:
SampEn
In SampEn, self-matches are excluded when calculating the percentage of the vectors Xm(j)
that are within r of Xm(i) , i.e., A(m) i (r)=
Ni(m)(r)
N−mτ−1 , where N
(m)
i (r) indicates the number of
j’s that meet di,j ≤r , and 1≤j≤N−mτ,j�=i . The average of the percentage A(m)i (r) over 1≤i≤N−mτ is then defined by �(m)(r)= N−1mτNi=−1mτA(m)i (r) . In a similar way, �(m+1)(r) is defined after increasing the dimension to m+1 . The SampEn value of the time-series u can be calculated by [8]:
FuzzyEn
FuzzyEn is methodologically the same to SampEn except that it replaces the percentage of vectors Xm(j) that are within r of Xm(i) with the average degree of membership which
(1)
Xm(i)= {u(i),u(i+τ ),. . .,u(i+(m−1)τ )},
(2)
d[Xm(i),Xm(j)] = max
0≤k≤m−1(|u(i+k)−u(j+k)|).
(3)
ApEn(m,τ,r)=�(m)(r)−�(m+1)(r).
(4)
SampEn(m,τ,r)= −ln�
(m+1)(r)
offers reliability especially for short-length data. Specifically, for a given fuzzy member-ship function e−ln(2)(x/y)2 , A(im)=
N−mτ
j=1,j�=ie
−ln(2)(di,j/r)2
N−mτ−1 is applied in FuzzyEn [11].
Other entropy‑like metrics
Conditional entropy (CE)
CE evaluates the information carried by a new sampling point given the previous sam-ples by estimating the Shannon entropy of the vectors with length m and vectors with new sampling point added (i.e., with length m+1 ) [7]. CE first coarse-grains the time-series u=u(i), 1≤i≤N with a quantification level of ξ (i.e., coarse-grain resolution
is max(u)−min(u)
ξ ). Instead of using the original time-series, it reconstructs the
coarse-grained time-series into the state space. After the reconstruction, the signal motifs of length m and these of length m+1 are codified in decimal format (i.e., the first element in the motif of length m has a weight of ξ(m−1) and so on), rendering the sequence of
motifs series of integer numbers. The frequency of each possible integer value can then be calculated. CE is defined by the difference between the Shannon entropy of the motif of length m+1 and that of the motif of length m. In [16], Shi et al. have a beautiful sum-mary of the details of CE algorithm with mathematical formulas.
Permutation entropy (PermEn)
PermEn assesses the diversity of ordinal patterns within a time-series. For each sig-nal motif of length m, it defines a permutation vector π by indexing its elements in an ascending order. Then, the frequency of each permutation pattern πj(1≤j≤m!) can be
calculated. The PermEn of the original time-series is defined by the Shannon entropy of permutation patterns [10, 16].
Distribution entropy (DistEn)
Instead of only calculating the probability of similar vectors (i.e., the percentage of the vectors Xm(j) that are within r of Xm(i) ), DistEn takes full advantage of the matrix
di,j, 1≤i,j≤N−mτ defined in SampEn algorithm by estimating the Shannon entropy of all distances. Specifically, the empirical probability density function of the distance matrix di,j except the main diagonal, i.e., i�=j , is first estimated by histogram approach
with a fixed bin number B. If denoting the probability of each bin by {pt,t=1, 2,. . .,B} , DistEn is then calculated by the formula for Shannon entropy [13]:
Parameters for entropy metrics
Common parameters shared by all these entropy metrics include the embedding dimen-sion (or motif length) m and the time delay variable τ . ApEn, SampEn, and FuzzyEn also
share a threshold parameter r. A quantification level ξ is needed in CE, and a bin number B is required in DistEn.
(5)
DistEn(m,τ,B)= − 1
log2(B)
B
t=1
Implementation
The main idea behind EZ Entropy software is to facilitate investigators not in engi-neering field, e.g., physiologists and clinicians, to perform such kind of analysis, so as to help promote the concept of nonlinear dynamical analysis in medicine field. In this section, I will introduce this software from several different aspects including system requirements, graphical user interface, functionality, setting, data import, results dis-play, and results export.
System requirements
EZ Entropy was developed using App Designer in MATLAB® environment. How-ever, with a standalone installation, the MATLAB® environment is not necessary to use EZ Entropy. If a MATLAB® based installation is preferred, MATLAB® R2018a and later releases are recommended. Installing EZ Entropy based on older versions of MATLAB® may cause unknown compilation problems since some new features of App Designer that are required in running this software are only available since early 2018. EZ Entropy will also be compiled as a web-based app and hosted in MATLAB® Web App Server, such that users could easily run it in a web browser.
The graphical user interface
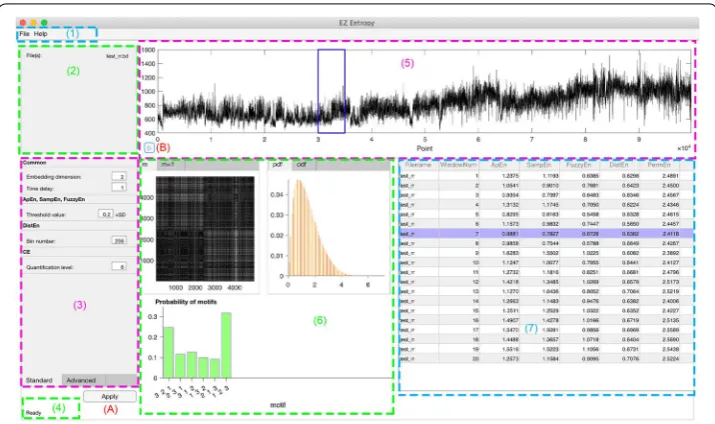
Figure 1 shows the main user interface through which users can interact with the soft-ware. There are mainly seven regions as illustrated in Fig. 1: (1) menu; (2) file info; (3) setting; (4) status; (5) data display; (6) display of intermediate results; and (7) results table. Regions (1) and (3) accept users inputs while regions (2), (4), (5–7) are for out-puts. The button (A) is to execute the analysis after importing data and necessary set-tings. The button (B) is for recall purposes. Note that there are three tab controls [one
in region (3) and two in region (6)] while in Fig. 1 only one tab for each is shown to give an overall view of the software interface. The other tab will be shown later in sub-sections below.
Functionality
Single recording analysis
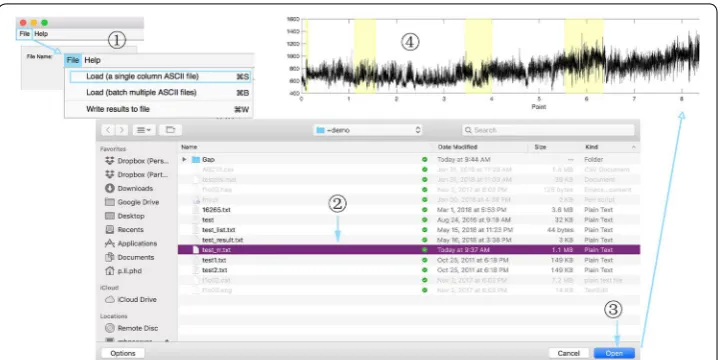
EZ Entropy can easily analyze a single signal recording (saved in a file of a certain format) and calculate the entropy results based on users’ setting with just several clicks. Figure 2 shows how to activate this function. After importing data, users need to define the input parameters and some running options through the Setting region. To perform the analysis on the data imported based on these parameters and options, users just need to simply click the button Apply. The software will do the analysis based on default parameters and options should users skip the settings and go directly click the Apply button.
Batch processing of multiple recordings
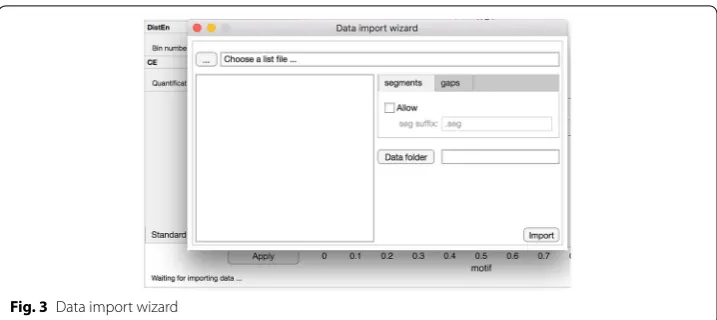
Batch processing can be activated by clicking on the second item of “File” menu, as shown in Fig. 2. The Data import wizard will be popped out (Fig. 3). Click on button “...” and choose the list file which lists the names of all data recordings to be analyzed. These names of recordings will be shown in the list box on the left-hand side of data import wizard. The directory where these data recordings are located needs to be specified by clicking on the “Data folder” button. Two tab controls called “segments” and “gaps” are for two optional analysis configurations which will be detailed in “ Con-sideration of data quality”. After all these, users click on button “Import” to close the wizard and migrate these configurations to the main interface.
Data import
Data format
Only ASCII files with one column specifying the signal recording are accepted in the current release of EZ Entropy.
Import of single recording
As specified in “Single recording analysis”, a single ASCII file can be loaded by clicking on the menu item “Load (a single column ASCII file)” under “File” menu (see Fig. 2).
Import of multiple recordings
Import of multiple recordings can be done with the help of the “Data import wizard” as specified in “Batch processing of multiple recordings” and Fig. 3.
Setting
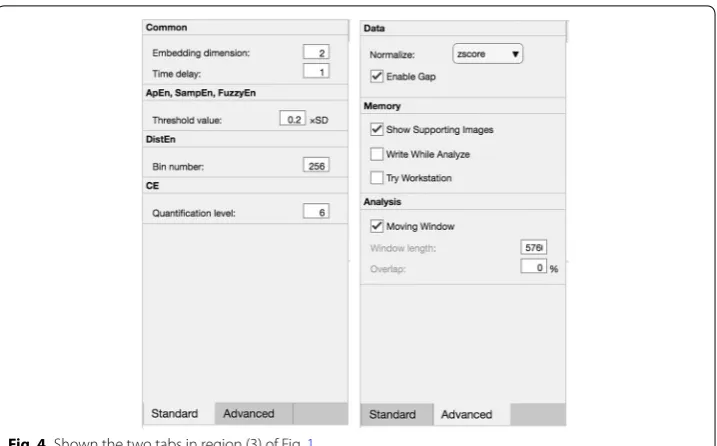
Figure 4 specifies the two tabs, namely “Standard” and “Advanced”, in region (3) of Fig. 1. Tab “Standard” is for defining parameters (for details, see “Parameters for entropy met-rics”) and the “Advanced” tab is for further settings that will affect the calculations of entropy metrics.
Consideration of data quality
This is the first item in the “Advanced” tab that can be further configured. The soft-ware accepts this input only in the context of single recording analysis. Users can select either “zscore” or “min–max” for data normalization. In addition, users could check or un-check the “Enable Gap” check-box. When the “Enable Gap” is checked, the software automatically searches within a sub-folder named “Gap” under the folder where the data recording is located whether there is a file named with the same name as the data recording while with an extension of “.gap”.
When users are batch processing multiple recordings, the consideration of data gaps are defined when importing data with the “Data import wizard”.
The file defining data gaps is also in ASCII format and is with two columns. The first column defines the starting points of data gaps while the second column specifies the
end points of gaps. The number of rows is essentially equal to the number of gaps. The software automatically ignores this configuration if the specific gap file cannot be located. However, if the gap file is successfully loaded, the gaps will be highlighted in yellow background in the data display region [region (5) in Fig. 1; an example is shown in Fig. 2] and will be skipped (i.e., re-defined as not-a-number) when calculat-ing the entropy metrics.
Consideration of running on a workstation or server
The software will stop calculating or seek further configuration about sliding windows when the data recording is too long (e.g., >10, 000 points) as a contemporary self-protective way in case of memory leakage when using a personal computer. However, if users are using workstation or server, or are very confident about the resources of their hardware, they can check the “Try Workstation” check-box to force the software to do the calculation. On the other hand, if users worry too much about the possibil-ity of memory leakage especially when batch processing multiple recordings, they can either un-check the “Show Supporting Images” check-box or check the “Write While Analyze” check-box. The first option will stop the software from displaying interme-diate results using images, and the second option will avoid displaying too many lines in the results table by writing results to hard disk.
Sliding window analysis
The option of moving window is very helpful for the analysis of longer recordings. EZ Entropy offers the option of slide window analysis as a further setting option under the “Advanced” tab. By checking the “Moving Window” check-box, users could
be able to define the window length (in points) and overlap (in percentage) between windows.
This option is acceptable for both single recording analysis and batching multiple recordings options. However, under the context of single recording analysis, an extra bonus offered by this software is that the check of “Moving Window” check-box will enable the recall button [button (B) in Fig. 1], meaning that users could replay the inter-mediate results for each window by clicking on this button. Figure 1 shows an example with recall button enabled. After click on the recall button, the corresponding window is boxed and the corresponding result line is highlighted in purple. All intermediate results corresponding to this window are displayed in region (6) of Fig. 1.
Results display
Intermediate results
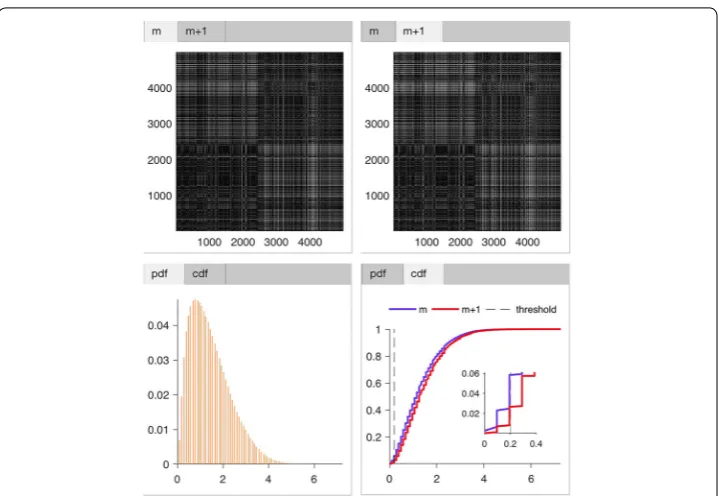
EZ Entropy uniquely offers the option to display intermediate results in image format including the distance map [13], the empirical probability density function (PDF) of distance [13], the cumulative distribution function (CDF) of distance [13], and the probability of signal motifs. The distance map, PDF, and CDF are available for both embedding dimensions m and m+1 , as shown in Fig. 5. These extra outputs may potentially be able to trigger new thoughts and ideas on the development or refine-ment of algorithms. For example, one idea that I am exploring right now is to treat the distance map as an image while using established artificial neural network algo-rithms (e.g., deep convolutional network) to characterize its patterns corresponding to healthy and diseased conditions.
Results table for entropy metrics
The calculation results will be displayed immediately in the UI-table control in region (7) of Fig. 1. By default the results for all files (when performing batch analysis) and all windows (when performing moving window analysis) are shown. However, if the “Write While Analyze” is checked (see “Consideration of running on a workstation or server” section), this results table will only display results for one file and will be refreshed and cleared after results being written to hard disk in order to show results of the next file.
Exporting results
Exporting results manually
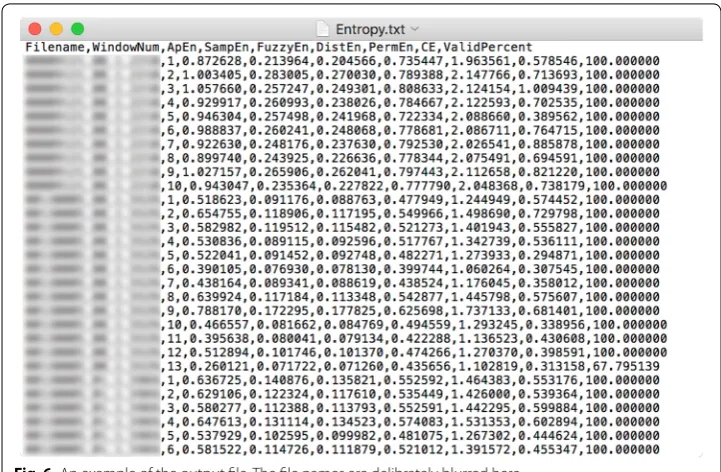
All results that are shown in the results table can be written to a file by clicking on the third menu item—“Write results to file”—of “File” menu, as shown in Fig. 2. The standard “Save As ...” dialog box will pop up and let users define the file name and directory. Results are saved in ASCII files with a header line specifying columns’ names and with multiple columns separated by comma, as shown in Fig. 6.
Exporting results automatically—export while analyze
users determine the file name and directory. Note this option should be set prior to performing the calculation (i.e., clicking on button “Apply”).
Help
There are two items under the “Help” menu—“Documentation” and “About EZ Entropy”. The help document (the user manual in .pdf format) will be opened outside of this software using a PDF reader if installed with clicking on “Documentation”. The “About” dialog will be popped out after clicking “About EZ Entropy”.
Results and discussion Sample run
Two examples runs, specifically, one for an example of analyzing a single data file and one for an example of batch processing multiple files, have been recorded and shown in Additional file 1: Movie S1. In each sample run, these previously mentioned set-tings will be touched, too.
Fig. 5 Display of intermediate results. Shown the distance map of embedding dimension m (upper left),
m+1 (upper right), as well as the probability density function of embedding dimension m and m+1
in different colors (lower left), and the cumulative distribution function of dimension m and m+1 in
Availability of the software
Upon publication, request of EZ Entropy software can be addressed to me (e-mail to [email protected]) and installation package will be sent free of charge for non-commer-cial use to researchers and clinicians, etc. The web-based EZ Entropy App will also be hosted in MATLAB Web App Server upon publication.
Discussion
Entropy analysis of physiological time-series has been a hot topic in biomedical science and engineering fields, being capable of capturing unique, valuable, and additional char-acteristics hidden in the time-series that are not visually identifiable [5–17]. It usually requires at least some basic programming or coding knowledge to perform such kind of analysis as up to now no commercialized software has ever had these functions built in. This causes an obvious barrier to most clinicians and physiologists who are otherwise not trained in programming while on the other hand have plenty of data that may lead to new, useful observations should this novel analysis be performed.
To facilitate this, a software application—EZ Entropy—for the entropy analysis of physiological time-series, and certainly other physical time-series, was introduced. It is an easy-to-operate software application requiring only several clicks to perform the calculation. Besides, it offers different analysis options that are commonly applied when performing these calculations.
Highlights
There are a couple of features, operation-wise and code-wise, that should be highlighted.
• Being built specifically in the context of entropy analysis and thus being extraordi-narily focused
• Being highly interactive
• Offering options for both single file analysis and batch analysis • Offering settings that are straightforward and easy to enable/disable
• Displaying intermediate results using image in order to trigger new methodologi-cal thoughts and ideas
• Exporting results in ASCII format that can be easily opened by almost all statisti-cal software
• Displaying status message that has users notified in real-time about the progres-sion
• Being programmed in complete object-oriented manner thus being quite easy to manage, maintain, and extend.
Features to be added
This is the first release of EZ Entropy software with a few common options/settings. Yet there are plenty of other functions to be added to make this software more profes-sional. Below I listed some features that will be enabled in future versions.
• Entropy analysis for multivariate data [35, 36] • Multiscale analysis [37]
• Tolerance to other input data formats
• Ability of incorporating user-defined entropy metrics.
The ability to incorporate user-defined entropy algorithms as listed above should also be feasible even though it is only prospected at the time of this publication. Such a second development function is considered quite important, too, for even commer-cialized software. In the field of entropy analysis, there are many novel algorithms being developed by biomedical engineers [14, 18–24]. This software application with such a second development capability will significantly help promote the application of new entropy algorithms in physiology and clinical medicine.
It is worth noting that MATLAB provide a “.fig” file in order to export both the user interface and data together to local hard disk. This is kind of equivalent as saving the workspace as a project that is able to be worked on again next time when opening it. It is possible to add an additional menu item to achieve this. However, it might make more sense to save the workspace when batch processing multiple data files. For example, the users may want to occasionally interrupt the work-flow and continue later. To achieve this, the software needs to be able to listen to some event (i.e., inter-rupt) and takes appropriate actions to handle the event. This is unfortunately not sup-ported by MATLAB since it is not a multithreaded programming language. It cannot handle any new event until the current one (e.g., a loop) is finished.
Conclusions
With the rapid developments in new data mining theories and technologies, there might be many new properties hidden in the seemingly simple physiological signals to be detected. These new properties may emerge as valuable features for the evaluation of health status or may complement previously identified features. Either way, researchers in the related fields should be encouraged to be always open-minded to the fresh young blood. Specialized software, for example, the heart rate variability analysis software pre-viously published [38] and the EZ Entropy software introduced here, will certainly fill the needs and potentially play an increasingly important role in the scientific community.
Availability and requirements
Project name: EZ Entropy software implementation
Project home page: N/A
Operating system(s): Platform independent
Programming language: MATLAB
Other requirements: requires MATLAB R2018a and later
releases
License: GNU GPL
Any restrictions to use by non-academics: licence needed.
Additional file
Additional file 1: Movie S1. Demonstration and sample runs of using EZ Entropy.
Authors’ contributions
PL is the sole author of this work and contributed to all aspects from conceptualization of the project to programming and debugging the software, and to drafting and revising the manuscript. The author read and approved the final manuscript.
Acknowledgements
Competing interests
The author declares that he has no competing interests.
Availability of data and materials
Not applicable.
Consent for publication
Not applicable.
Ethics approval and consent to participate
Not applicable.
Funding
This work was supported by the National Natural Science Foundation of China (No. 61601263). The funding source had no involvement in the study design, study implementation, experiments, writing of this report, or the decision to submit the article for publication.
Publisher’s Note
Springer Nature remains neutral with regard to jurisdictional claims in published maps and institutional affiliations.
Received: 26 October 2018 Accepted: 13 March 2019
References
1. Lipsitz LA, Goldberger AL, et al. Loss of complexity and aging. JAMA. 1992;267(13):1806–9.
2. Glass L, Kaplan D. Time series analysis of complex dynamics in physiology and medicine. Med Prog Through Tech-nol. 1993;19:115.
3. Peng C-K, Buldyrev SV, Havlin S, Simons M, Stanley HE, Goldberger AL. Mosaic organization of dna nucleotides. Phys Rev. 1994;49(2):1685.
4. Goldberger AL, Amaral LA, Hausdorff JM, Ivanov PC, Peng C-K, Stanley HE. Fractal dynamics in physiology: altera-tions with disease and aging. Proc Natl Acad Sci. 2002;99(suppl 1):2466–72.
5. Pincus SM. Approximate entropy as a measure of system complexity. Proc Natl Acad Sci. 1991;88(6):2297–301. 6. Pincus SM, Huang W-M. Approximate entropy: statistical properties and applications. Commun Stat Theory
Meth-ods. 1992;21(11):3061–77.
7. Porta A, Baselli G, Liberati D, Montano N, Cogliati C, Gnecchi-Ruscone T, Malliani A, Cerutti S. Measuring regularity by means of a corrected conditional entropy in sympathetic outflow. Biol Cybern. 1998;78(1):71–8.
8. Richman JS, Moorman JR. Physiological time-series analysis using approximate entropy and sample entropy. Am J Physiol Heart Circ Physiol. 2000;278(6):2039–49.
9. Akay M. Approximate entropy and its application in biosignal analysis. Piscataway: IEEE Press; 2001. 10. Bandt C, Pompe B. Permutation entropy: a natural complexity measure for time series. Phys Rev Lett.
2002;88(17):174102.
11. Chen W, Zhuang J, Yu W, Wang Z. Measuring complexity using fuzzyen, apen, and SampEn. Med Eng Phys. 2009;31(1):61–8.
12. Yentes JM, Hunt N, Schmid KK, Kaipust JP, McGrath D, Stergiou N. The appropriate use of approximate entropy and sample entropy with short data sets. Ann Biomed Eng. 2013;41(2):349–65.
13. Li P, Liu C, Li K, Zheng D, Liu C, Hou Y. Assessing the complexity of short-term heartbeat interval series by distribu-tion entropy. Med Biol Eng Comput. 2015;53(1):77–87.
14. Li P, Karmakar C, Yan C, Palaniswami M, Liu C. Classification of 5-s epileptic eeg recordings using distribution entropy and sample entropy. Front Physiol. 2016;7:136.
15. Karmakar C, Udhayakumar RK, Li P, Venkatesh S, Palaniswami M. Stability, consistency and performance of distribu-tion entropy in analysing short length heart rate variability (HRV) signal. Front Physiol. 2017;8:720.
16. Shi B, Zhang Y, Yuan C, Wang S, Li P. Entropy analysis of short-term heartbeat interval time series during regular walk-ing. Entropy. 2017;19(10):568.
17. Li P, Karmakar C, Yearwood J, Venkatesh S, Palaniswami M, Liu C. Detection of epileptic seizure based on entropy analysis of short-term EEG. PLoS ONE. 2018;13(3):0193691.
18. Kaplan D, Staffin P. Software for heart rate variability. https ://www.macal ester .edu/~kapla n/hrv/doc/. Accessed 1 Jan 2019.
19. Lee K. Fast approximate entropy. https ://www.mathw orks.com/matla bcent ral/filee xchan ge/32427 -fast-appro ximat e-entro py. Accessed 1 Jan 2019.
20. Lee K. Sample entropy. https ://www.mathw orks.com/matla bcent ral/filee xchan ge/35784 -sampl e-entro py. Accessed 1 Jan 2019.
21. Sample entropy. https ://www.physi onet.org/physi otool s/sampe n/matla b/1.1-1/sampe n.m. Accessed 1 Jan 2019. 22. Muller A. PETROPY—PERMUTATION ENTROPY. http://tocsy .pik-potsd am.de/petro py.php. Accessed 1 Jan 2019. 23. Unakafova V. Permutation entropy (fast algorithm). https ://www.mathw orks.com/matla bcent ral/filee xchan ge/44161
-permu tatio n-entro py-fast-algor ithm. Accessed 1 Jan 2019.
24. Li P. Detection of epileptic seizure based on entropy analysis of short-term EEG. https ://schol ar.harva rd.edu/pli/ detec tion-epile ptic-seizu re-based -entro py-analy sis-short -term-eeg?admin _panel =1. Accessed 1 Jan 2019. 25. Eckmann J-P, Ruelle D. Ergodic theory of chaos and strange attractors. The theory of chaotic attractors. Berlin:
• fast, convenient online submission
•
thorough peer review by experienced researchers in your field
• rapid publication on acceptance
• support for research data, including large and complex data types
•
gold Open Access which fosters wider collaboration and increased citations maximum visibility for your research: over 100M website views per year
•
At BMC, research is always in progress.
Learn more biomedcentral.com/submissions
Ready to submit your research? Choose BMC and benefit from: 26. Pincus S, Singer BH. Randomness and degrees of irregularity. Proc Natl Acad Sci. 1996;93(5):2083–8.
27. Fleisher LA, Pincus SM, Rosenbaum SH. Approximate entropy of heart rate as a correlate of postoperative ventricular dysfunction. Anesthesiology. 1993;78(4):683–92.
28. Yeragani VK, Pohl R, Mallavarapu M, Balon R. Approximate entropy of symptoms of mood: an effective technique to quantify regularity of mood. Bipolar Disord. 2003;5(4):279–86.
29. Abásolo D, Hornero R, Espino P, Poza J, Sánchez CI, de la Rosa R. Analysis of regularity in the EEG background activity of alzheimer’s disease patients with approximate entropy. Clin Neurophysiol. 2005;116(8):1826–34.
30. Pincus SM. Approximate entropy as a measure of irregularity for psychiatric serial metrics. Bipolar Disord. 2006;8((5p1)):430–40.
31. Papaioannou V, Giannakou M, Maglaveras N, Sofianos E, Giala M. Investigation of heart rate and blood pressure vari-ability, baroreflex sensitivity, and approximate entropy in acute brain injury patients. J Crit Care. 2008;23(3):380–6. 32. Gao L, Smielewski P, Czosnyka M, Ercole A. Cerebrovascular signal complexity six hours after intensive care unit
admission correlates with outcome after severe traumatic brain injury. J Neurotrauma. 2016;33(22):2011–8. 33. Yan R, Gao RX. Approximate entropy as a diagnostic tool for machine health monitoring. Mech Syst Sign Process.
2007;21(2):824–39.
34. Fu L, He Z-Y, Mai R-K, Qian Q-Q. Application of approximate entropy to fault signal analysis in electric power system. Proc CSEE. 2008;28(28):68–73.
35. Ahmed MU, Mandic DP. Multivariate multiscale entropy analysis. IEEE Signal Process Lett. 2012;19(2):91–4. 36. Li P, Li K, Liu C, Zheng D, Li Z-M, Liu C. Detection of coupling in short physiological series by a joint distribution
entropy method. IEEE Trans Biomed Eng. 2016;63(11):2231–42.
37. Costa M, Goldberger AL, Peng C-K. Multiscale entropy analysis of complex physiologic time series. Phys Rev Lett. 2002;89(6):068102.