R E S E A R C H
Open Access
Home-range use patterns and movements
of the Siberian flying squirrel in urban
forests: Effects of habitat composition and
connectivity
Sanna Mäkeläinen
1*, Henrik J de Knegt
2,3, Otso Ovaskainen
2and Ilpo K Hanski
1Abstract
Background:Urbanization causes modification, fragmentation and loss of native habitats. Such landscape changes threaten many arboreal and gliding mammals by limiting their movements through treeless parts of a landscape and by making the landscape surrounding suitable habitat patches more inhospitable. Here, we investigate the effects of landscape structure and habitat availability on the home-range use and movement patterns of the Siberian flying squirrel (Pteromys volans) at different spatial and temporal scales. We followed radio-tagged individuals in a partly urbanized study area in Eastern Finland, and analysed how landscape composition and connectivity affected the length and speed of movement bursts, distances moved during one night, and habitat and nest-site use.
Results:The presence of urban habitat on movement paths increased both movement lengths and speed whereas nightly distances travelled by males decreased with increasing amount of urban habitat within the home range. The probability of switching from the present nest site to another nest site decreased with increasing distance among the nest sites, but whether the nest sites were connected or unconnected by forests did not have a clear effect on nest switching. Flying squirrels preferred to use mature forests for their movements at night.
Conclusions:Our results suggest that the proximity to urban habitats modifies animal movements, possibly because animals try to avoid such habitats by moving faster through them. Urbanization at the scale of an entire home range can restrict their movements. Thus, maintaining a large enough amount of mature forests around inhabited landscape fragments will help protect forest specialists in urban landscapes. The effect of forested connections remains unclear, highlighting the difficulty of measuring and preserving connectivity in a species-specific way.
Keywords:Connectivity, Habitat fragmentation, Home range, Movements, Nest-site use, Siberian flying squirrel, Urbanization
Background
Anthropogenic habitat changes can affect animal popu-lations in several ways; for example by reducing habitat availability, or through impeding both daily and dispersal-related movements, thereby reducing interac-tions among individuals and, consequently, genetic ex-change [1]. One of the key interests when studying animal movements is to find out how organisms respond
to their environment, and changes therein [2]. Given that urbanization is considered to be a major threat for vertebrate species and that the rate of urban expansion is accelerating worldwide [3, 4], more research and con-servation efforts should be targeted at species living in these human-modified environments [5]. The biggest threats of urbanization to wildlife are caused by the modification, fragmentation and loss of native habitats [6, 7]. Urban landscapes are often spatially complex mosaics, leaving remnants of native habitats surrounded by different kinds of new habitat types. They are also characterized as having a highly variable landscape * Correspondence:[email protected]
1Finnish Museum of Natural History LUOMUS, University of Helsinki, P. O. Box
17 (P. Rautatiekatu 13), Helsinki FI-00014, Finland
Full list of author information is available at the end of the article
between native patches, possibly with movement barriers such as wide roads or densely built residential areas [8]. While some species have shown behavioural plasticity and have adapted to inhabit urban areas [9, 10], moving in human-modified landscapes has been considered costly and risky for species that are adapted to live in formerly continuous landscapes [11].
Means to conserve species in modified landscapes have included management of the remaining native habi-tat and preserving movement corridors between habihabi-tat patches to maintain connectivity [12–14]. Measures of functional connectivity, that take into account species-specific movement abilities, have also been considered important [15, 16]. However, the presence of movement corridors and the configuration of the landscape have had varied effects on species [17, 18]. For example, re-sults on corridor use of different taxa are conflicting, partly because the utility of corridors is species-specific and depends on the width and structure of the corridor [19–21]. Recent studies have also indicated that im-provement of the quality of the habitat between suitable patches can in some cases be a more cost-effective con-servation option than, for example, the construction of corridors or management of the remnant habitat patches [17, 22, 23].
The long-term existence of any species within continu-ously changing and expanding urban areas is related to its ability to exploit remaining habitat fragments, its responses to edges, and its willingness to cross gaps and use the landscape matrix between suitable patches [24, 25]. Here, matrix is defined as the inter-spersed landscape area between the patches of suit-able habitat (such as mature forest fragments). Species have been found to be neutral, positive or negative regarding their use of matrix to move be-tween the suitable habitat patches, for example, show-ing no resistance to use matrix, movshow-ing quickly through areas where the crossing distance is smaller than a particular threshold or being reluctant to enter the area between habitat patches [26–28]. Arboreal mammals, generally considered susceptible to changes in their native habitats, can serve as good model or-ganisms to study movement behaviour in human-modified landscapes. Many of them are threatened by urban sprawl, habitat fragmentation and loss due to their strict habitat requirements, limited movement abilities and possible reluctance to move through the matrix [29, 30]. A special group are gliding species, whose movements through fragmented landscapes are constrained by maximum gliding distances [28].
The Siberian flying squirrel (Pteromys volans, here-after flying squirrel) is an arboreal rodent inhabiting the Eurasian boreal forest zone, and its distribution extends from Finland and Estonia through the Asian
continent all the way to Japan and the Korean penin-sula [31]. Within the European Union the flying squirrel is classified as vulnerable, and the population in Finland has been declining due to destruction and fragmentation of suitable habitat caused by forest management [32, 33]. The most suitable breeding habitat for the flying squirrel is spruce-dominated mature boreal forest with a mix of deciduous trees that provides food and nesting cavities [34, 35]. In addition to mature spruce forests, flying squirrels use younger forests for foraging and moving [36]. Flying squirrels are highly dependent on trees and move al-most exclusively by gliding from tree to tree. Gaps wider than few meters are crossed by climbing to the top part of the nearest tree and gliding over the gap. Through gliding they are able to cross relatively nar-row (30–50 m) treeless gaps [37]. Females occupy home ranges of ca 8 ha usually located within one suitable forest patch. Males occupy large home ranges of ca 60 ha that often include several female home ranges and several forest patches, and consequently they need to move longer distances than females [38, 39]. Within their home ranges, flying squirrels have several nests between which they frequently change. These consist of tree cavities, twig nests built by the red squirrel (Sciurus vulgaris) and nest boxes, out of which the females prefer cavities during the breeding season [40]. Flying squirrels are nocturnal, thus move-ments consist of night-time activity periods inter-rupted by daytime resting in a nest. During one night, an individual typically makes several bursts of movements interrupted by staying in a nest or feeding [38].
Despite its preference for mature and relatively undis-turbed forest, flying squirrels have also been found to in-habit forest patches near human settlements [41]. Consequently, the expansion of urban infrastructure and the strict legal protection of the species have created conflicts in many areas across Finland. In addition, re-cent studies have shown that legal protection of the spe-cies is inefficient due to the limited size of the protection areas, which cover only a small part of a home range [42, 43]. As earlier studies have been re-stricted to managed forests outside cities, and because lit-tle is known on the behaviour of the species in urbanized areas, there is an urgent need to increase our understand-ing of its habitat use in relation to urban landscape.
depends on habitat composition within the home range, on the season, on the sex of the individual, and whether it varies among individuals within the sexes. We then in-vestigate how the number of distinct nest sites is related to home-range size and habitat composition within the home range, and how individuals use habitats during movement bursts. Finally, we view home-range move-ments as movemove-ments among the network of nest sites, and examine how the choice of the next nest site, rela-tive to the current position of the individual, depends on the distances between the nest sites and on the habitat composition and connectivity between the nest sites. In particular, we ask if the existence of forested connections influences the order in which the individuals visit the nest sites, and if the observed patterns differ between the sexes. Based on earlier results, we hypothesize that males respond to habitat composition so that they will move longer distances if there is less suitable habitat, whereas we expect females to move mostly within a single forest patch of suitable habitat. We also hypothesize that flying squirrels avoid moving through urban areas. We expect that the movement probability between consecutive nest sites increases with increasing physical and functional proximity, the latter measuring connectivity through forested habitats without gaps wider than 50 m.
Methods
Study area and habitat classification
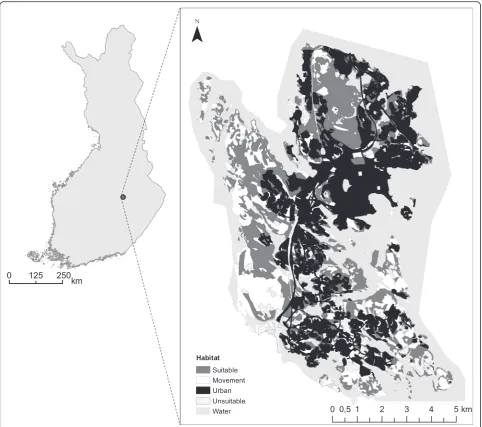
The study was conducted in the city of Kuopio, Eastern Finland (62° 53’N, 27° 41’E) in 2008–2012. The study area of 73 km2is dominated by forests (52 %) and urban habitats (38 %), but also includes clear cut areas and cul-tivated fields (5 %), sapling stands (3 %) and water bodies (3 %). The main tree species occurring in the study area are Norway spruce (Picea abies), Scots pine (Pinus syl-vestris) and silver and downy birch (Betula pendula, B. pubescens). The study area belongs to Northern Savo core area of herb-rich vegetation and about one third of the forests are covered by groves or heaths with rich grass-herb vegetation [44]. With the help of aerial pho-tographs, forest stand information received from the City of Kuopio and an earlier field survey [41], we classified the study area according to habitat suitabil-ity for the flying squirrel (Fig. 1), using ArcGIS 10 (Esri): H1) suitable habitat (spruce-dominated mature forests with deciduous trees such as aspen Populus tremula, and alders Alnus incana and A. glutinosa, i.e., the main breeding habitat of flying squirrel), H2) movement habitat (other forest types with height over 10 m, for example pure birch, pine or spruce forests), H3) urban habitat (old and recently developed resi-dential areas, also resiresi-dential areas with trees of
varying species composition), H4) unsuitable habitats (clear cut areas, fields and sapling stands) and H5) water bodies.
Collection of radio-tracking data
In total 19 adult females and 22 adult males were cap-tured from nest boxes or trapped from nesting cavities and fitted with radio collars that weighed 5 g (Biotrack, U.K.). Radio tracking was conducted from the beginning of March until the end of September in 2008–2012. All individuals were located at least once a week in daytime to find their daily nest sites. Night-time movements of two females were not monitored, but their daytime loca-tions were used in modelling movements between nest sites. In order to explore the movements and corridor use, we followed individuals for 3–5 nights per week in a continuous fashion, mostly for 30–150 min at a time. We tracked the animals by foot and recorded the tree or tree group every time the individual changed its location. The duration of the time the squirrel was not moving (e.g., while foraging or in a nest) was also measured. In early spring and late fall (March and September, respect-ively) the movements were followed mainly at the time of highest activity (early night), but during all the other months we also followed movements in the early morn-ing. The relevant data (including spatial coordinates, times, used tree species and possible visual behavioural observations) of night-time tracking periods and those of daily nest sites were saved in a GPS device (Trimble Juno SB handheld).
Statistical analyses based on generalized linear mixed models
We applied log-normal models to assess factors influen-cing flying squirrel movement patterns as measured by three response variables (Table 1): the lengths and the speeds (length divided by duration) of individual move-ment bursts, and the nightly total movemove-ment distances, i.e. the lengths of the entire movement trajectories dur-ing one night. As explanatory variables for the length and speed of the movement burst, we used the sex of the individual, the month of the year (from March to September; categorical variable), the proportions of the habitat classes H1–H3 within a 25-m buffer along each
for by adding the log-transformed total time of the track-ing period as an explanatory variable. As we had repeated measurements from the same individuals, we included in-dividual as a random effect of the intercept in the models. Unsuitable habitats (H4) and water bodies (H5) are known to be avoided by flying squirrels, and as their proportions within buffered movement bursts and home ranges were small we excluded them from analyses. We checked for collinearity of variables with pairwise correlation coeffi-cients (max. -0.67 between H1 and H3) and with variance inflation factors (max. 7.1) [46]. We used the Akaike’s in-formation criterion- approach (AIC) for selecting the best supported models [47] (but see [48] for a discussion of the limitations of AIC). AIC-values corrected for sample sizes (AICc) were used for model comparison, and all the
models that gave reasonable support (with ΔAICc< 2),
were included in model averaging. Effects of variables were examined with the help of variate weights and 95 % confidence intervals [49, 50].
We applied Poisson regression with the log-link func-tion to examine which factors influence the number of nest sites within the home range, with sex, home-range size and proportions of habitat classes and their interac-tions with sex as explanatory variables. Observation ef-fort was controlled for by including the log-transformed number of days during which the nest site of the individ-ual was monitored as an explanatory variable (Table 1). Sufficiency of sampling was assessed by creating a rarefaction curve using R package vegan [51, 52]. Here, rarefaction describes the change in number of nests with increasing observation effort (Additional file 2). Number of nests had a tendency to level off with our sampling intensity, which suggests we did not miss a high fraction of nest sites.
Realized habitat use versus habitat availability within the home range
We examined flying squirrel habitat preferences by run-ning a compositional analysis, which is suited for study-ing habitat use with data on several individuals when habitat is classified into discrete categories [53, 54] (for alternative methods, see [55, 56]). To quantify habitat
availability regarding the proportions of the habitat types H1–H4 within the home ranges, the study area was ras-terized to a resolution of 25 m, and the proportions of cells belonging to different habitat types within the 100 % MCPs were computed. To quantify habitat usage, we calculated the proportions of habitat types at the re-corded locations. Proportions of used habitats were compared to proportions of available habitats following Aebischer et al. (1993) and by using the R package ade-habitatHS [45]. Significance of habitat selection and ranking were tested with randomization tests and Wilks Lambda (Λ) [57], using the p-value 0.05 as a threshold. To avoid singular cases, we replaced 0-values for habitat use with the value of 0.01. For missing values created by zero habitat availability, we replaced the log-transformed ratio between used and available habitat by the mean value of other individuals [53]. The effect of sex was examined by running the compositional analysis separ-ately for the sexes and by comparing the results. All the above-mentioned statistical analyses were performed with R version 3.0.2 [58].
Movements among the network of daytime nest sites We used a Markov chain model to study the effect of habitat connectivity on the probability of switching between nest sites. We constructed the chronological sequence of daytime nest sites used by each individual, and modeled the transitions between the sites. The Markovian assumption implies that the state of the sys-temz(t), i.e. a vector of lengthn including the probabil-ities of the individual being in each of thennest sites at dayt, depends only on the state of the system in the pre-vious day,z(t−1). The statez(t) evolves as:
zðtþΔtÞ ¼zð Þt PΔt
where Δt is the number of days between the observa-tions, and the element Pij of the transition matrix P is
the probability that the individual will move to nest sitej if it currently is in nest site i. The diagonal terms Pii
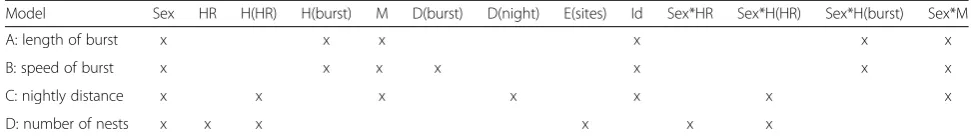
model the probabilities that the individual stays in the same site. We modelled the transition matrix Pthrough Table 1Explanatory variables included in the GLMM analyses (x denotes inclusion of the variable in the model)
Model Sex HR H(HR) H(burst) M D(burst) D(night) E(sites) Id Sex*HR Sex*H(HR) Sex*H(burst) Sex*M
A: length of burst x x x x x x
B: speed of burst x x x x x x x
C: nightly distance x x x x x x x
D: number of nests x x x x x x
Multinomial regression. We denoted the linear predictor related to movement probability from site i to j by Lij,
and modelled the probability of switching from site ito site j as Pij¼eLij=
X
j
eLij; where the denominator is a scaling constant ensuring that X
j
Pij¼1: As predictors for the linear predictor in the transition matrix Pwe in-cluded the identity matrixIto capture the probability of staying in the same site, the distance matrixDspecifying the distance (transformed as log(distance + 1 meter)) be-tween the sites; and the binary connectivity matrix C, specifying whether two sites were connected by habitat (0 = not connected, 1 = connected). Denoting by βI, βD
and βC the regression parameters related to staying in
the same nest, the effect of distance, and the effect of connectivity, the model thus becomes:
L¼ βIIþð1−IÞ βDDþβCC
where the term (1−I) implies that the effects of distance and connectivity are modelled conditional upon the indi-vidual switching to another nesting site. We denote the individual by the subscript l= 1,…,n, where n is the number of individuals. We assumed individual-specific parameters, which we combine to the vector βl= (βI,l, βD,l,βC,l)T. We used a multivariate normal distribution
to model variation among individuals and thus assume
βl~N(μl,Σ). Here the mean response μl (vector of
length 3) is assumed to depend on the sex of the individ-ual, and so μl=α0+α1s, where α0 is the mean response
and α1is the effect of the sex s of the individual (-1 =
females, 1 = males). The matrix Σ (a 3 × 3 variance-covariance matrix) models variation among individuals not captured by the effect of sex.
We defined the twelve different connectivity matrices (C1–C6 and C1g–C6g) among the pairs of nest sites to test what kind of connectivity measure best explains fly-ing squirrel movements. A pair of nest sites was consid-ered to be connected if it was possible to draw a route from one site to the other site so that C1) the route followed a straight line and was entirely located within suitable habitat within the home range; C2) the same as C1, but the route also included movement habitat; C3) and C4): the same as C1) and C2), but the route was not required to be a straight line; C5) and C6): the same as C3) and C4), but the route was not required to be located entirely within the home range. We also consid-ered variants of these six connectivity measures for which two sites were considered connected even if the route included gaps (i.e. areas not classified as suitable habitat or movement habitat) of max 50 m wide, and denote these by C1g–C6g (for example of the routes between nest sites see Additional file 3). To assess the effects of different predictor variables, we parameterized the model with distance only (1 model), connectivity
only (12 models, one for each connectivity measure), and distance and connectivity (12 models, one for each connectivity measure).
We fitted the model within a Bayesian framework be-cause it allowed us to account for joint parameter uncer-tainty in the non-linear model. We assumed uniform priors for the regression parameters α, and an inverse-Wishart prior with mean set to the identity matrix and degrees of freedom to 4. We chose to use the non-informative prior for the regression coefficients due to lack of prior information. The choice of the Inverse-Wishart prior for Sigma was made for computational convenience, as it is the conjugate prior for variance co-variance matrices. To reflect the lack of prior informa-tion, the degrees of freedom parameter was set to the minimal value that makes the distribution proper [59]. We sampled the posterior with a Markov chain Monte Carlo (MCMC) approach. We used a random walk Metropolis–Hastings algorithm with a multivariate nor-mal proposal distribution for the β -parameters. We used 25,000 iterations, of which the first 5000 were con-sidered as burn-in iterations during which we adaptively scaled the proposal distribution to achieve an acceptance ratio of 0.23 (see [60] for more details). As we defined conjugate priors for α and Σ, these parameters were sampled from their full conditionals. We checked for convergence and mixing through inspection of the trace plots and by comparing multiple chains initiated from different initial values. We used the deviance informa-tion criterion (DIC) to compare the models [61].
Results
Effects of small-scale landscape composition on movement patterns
Average proportions of habitat classes within buffered movement bursts were 56.8 (± SE over individuals 6.7 %) and 51.2 (± SE 4.7 %) for suitable habitat, 21.1 (± SE 6.3 %) and 26.2 (± SE 4.6 %) for movement habitat, and 17.3 (± SE 5.1 %) and 14.9 (± SE 3.7 %) for urban habitat, for females and males, respectively. Movement bursts were shorter for females (mean 184.1 ± SE 13.2 m) than for males (mean 453.0 ± SE 26.6 m), and they were longer if their vicinity (radius of 25 m) in-cluded urban habitat (Table 2, model A; Fig. 2a). Lengths of the movement bursts of females increased nearly con-tinuously over months whereas males made the longest movements both in spring time (March-April) and in late summer (in July and August)(Fig. 2b).
(Fig. 2d): the movement speed of females peaked in August whereas males had two peaks of higher activity (March and July). Duration of the burst had no effect on the movement speed.
Effect of home-range habitat composition on nightly moved distance and number of distinct nest sites
Average proportions of habitat types within home ranges were 43.6 (± SE over individuals 7.2 %) and 23.7 (± SE 2.4 %) for suitable habitat, 21.0 (± SE 5.9 %) and 24.8 (± SE 3.4 %) for movement habitat, and 28.6 (± SE 6.4 %) and 30.7 (± SE 4.5 %) for urban habitat, for females and males, respectively. Total distance moved during
nightly tracking periods were affected by the duration of the tracking period, sex and by habitat composition within the individual’s home range (Table 2, model C). As ex-pected, the longer the duration of the nightly tracking period, the longer the total distance moved. The presence of urban habitat within the home range affected distances travelled by both sexes. However, while it increased the distances travelled by females, this was not the case for males (Fig. 2e). Nightly moved distances were the greatest for both sexes in July and August, and the lowest in March (Fig. 2f).
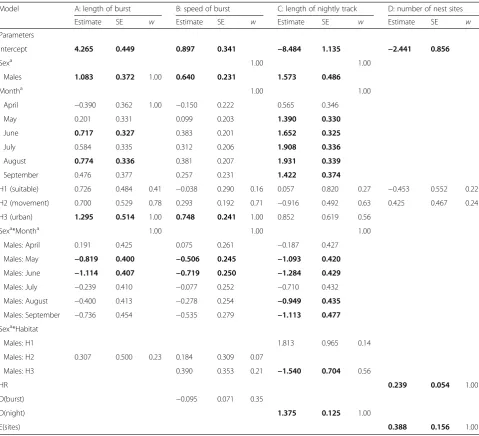
We identified a total of 232 nest sites for all the indi-viduals (note that this number included same nests that Table 2Results of model averaging across the highest ranked (ΔAICc< 2) GLMMs for each response variable (from A to D)
Model A: length of burst B: speed of burst C: length of nightly track D: number of nest sites
Estimate SE w Estimate SE w Estimate SE w Estimate SE w
Parameters
Intercept 4.265 0.449 0.897 0.341 −8.484 1.135 −2.441 0.856
Sexa 1.00 1.00
Males 1.083 0.372 1.00 0.640 0.231 1.573 0.486
Montha 1.00 1.00
April −0.390 0.362 1.00 −0.150 0.222 0.565 0.346
May 0.201 0.331 0.099 0.203 1.390 0.330
June 0.717 0.327 0.383 0.201 1.652 0.325
July 0.584 0.335 0.312 0.206 1.908 0.336
August 0.774 0.336 0.381 0.207 1.931 0.339
September 0.476 0.377 0.257 0.231 1.422 0.374
H1 (suitable) 0.726 0.484 0.41 −0.038 0.290 0.16 0.057 0.820 0.27 −0.453 0.552 0.22
H2 (movement) 0.700 0.529 0.78 0.293 0.192 0.71 −0.916 0.492 0.63 0.425 0.467 0.24
H3 (urban) 1.295 0.514 1.00 0.748 0.241 1.00 0.852 0.619 0.56
Sexa*Montha 1.00 1.00 1.00
Males: April 0.191 0.425 0.075 0.261 −0.187 0.427
Males: May −0.819 0.400 −0.506 0.245 −1.093 0.420
Males: June −1.114 0.407 −0.719 0.250 −1.284 0.429
Males: July −0.239 0.410 −0.077 0.252 −0.710 0.432
Males: August −0.400 0.413 −0.278 0.254 −0.949 0.435
Males: September −0.736 0.454 −0.535 0.279 −1.113 0.477
Sexa*Habitat
Males: H1 1.813 0.965 0.14
Males: H2 0.307 0.500 0.23 0.184 0.309 0.07
Males: H3 0.390 0.353 0.21 −1.540 0.704 0.56
HR 0.239 0.054 1.00
D(burst) −0.095 0.071 0.35
D(night) 1.375 0.125 1.00
E(sites) 0.388 0.156 1.00
Model averaged parameter estimate, associated standard error (SE) and variate weight (w) is provided for each explanatory variable that was chosen among the highest ranked models. Bolded value indicates that 95 % confidence intervals of a parameter estimate does not include zero
a
were used by different individuals). Females had on average 4.2 (± SD 1.6) nest sites and males on average 7.0 (± SD 2.7) nest sites. Of the total nest sites recorded
48 % were cavities, 41 % were twig nests, 8 % were nest boxes and 2 % were nests in buildings. Most of the nest sites were located in mature spruce-dominated forests,
3
4
5
6
7
Log(length of burst)
Suitable Movement Urban 3 4 5 6 7 8 9
3
4
5
6
7
0.5
1.0
1.5
2.0
2.5
Log(speed of burst)
Suitable Movement Urban 3 4 5 6 7 8 9
0.5
1.0
1.5
2.0
2.5
3
4
56
7
Habitat
Log(length of track)
Suitable Movement Urban 3 4 5 6 7 8 9
3
4
56
7
Month
Females Males
a
b
c
d
e
f
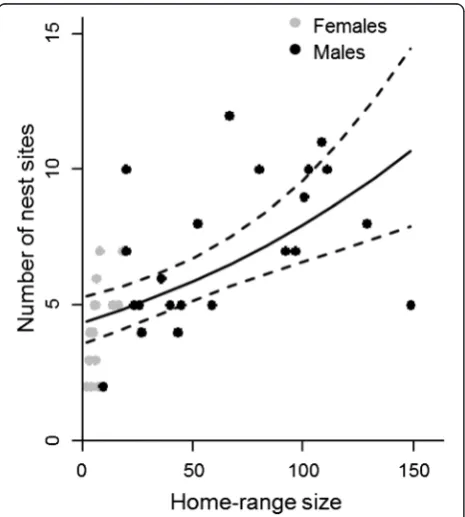
i.e., in the suitable breeding habitat type. Of the remaining nests, 20 % were in movement habitat, 10 % in urban habitat and 3 % in unsuitable habitat. As expected, the number of nests sites was positively associ-ated with observation effort, i.e., the number of days a nest site was recorded for each individual (Table 2, model D). The number of distinct nest sites increased with home-range size similarly for both sexes, even if home-range sizes of males were much greater than those of females (Fig. 3). Neither the proportions of habitats nor their interactions with sex had significant effects on the number of nest sites (Table 2).
Habitat use during movements versus habitat availability within home range
During movement bursts all flying squirrels used suit-able habitat significantly more than other habitat types (Table 3). Other habitat types were used in the following order for females: movement habitat > urban habitat > unsuitable habitat, whereas for males the order was
movement habitat > unsuitable habitat > urban habitat
(Table 3). According to randomization tests of the analysis, habitat selection was significant for the data pooled over all individuals (Λ= 0.297, p= 0.001), and
also separately for females (Λ= 0.240, p= 0.003) and males (Λ= 0.321, p= 0.003).
Effect of distance and connectivity on switching prob-ability between the daily nest sites
We obtained data on nest-site switching for 19 females and 22 males. Distances between nest sites were much shorter for females (maximum ca 600 m) than for males (maximum ca 2000 m). Maximum distance between nest sites connected continuously by a straight line and by suitable habitat (C1) was about 300 m for both sexes.
The model with distance only (DIC = 2214) showed that for both sexes, the switching probability decreased with distance (Fig. 4a). The best supported models with connectivity only (DIC = 2212 for model C5g, ΔDIC≥3 for other connectivity measures) showed that the switch-ing probability is higher among connected sites for males, but is not influenced by connectivity for females (Fig. 4b). As connected nests were on average closer to each other than unconnected nests, in particular for males, this result is consistent with the negative influ-ence of distance. The best supported models with both distance and connectivity included (DIC = 2209 for model C5g,ΔDIC = 1 for model C2g,ΔDIC≥3 for other models) also showed that distance has a negative influ-ence, but they gave contradictory results for the effect of connectivity. Both connectivity measures had a negative Fig. 3The number of distinct nest sites increases as a function of
home-range size. The curves show the prediction of the Poisson regression model. The dashed lines denote 95 % confidence intervals. Dots represent the observed number of nests for females (n= 17) and males (n= 22). The explanatory variable that is not varied (number of days the nest sites were recorded) was set to its mean value
Table 3Ranking matrices of habitats used during movements versus habitats available within the home range
Habitat type Suitable Movement Unsuitable Urban Rank
1) All (N= 39)
Suitable 0.000 1.603a 3.829a 3.252a 1
Movement −1.603 0.000 2.113a 1.580a 2
Unsuitable −3.829 −2.113 0.000 0.090 3
Urban −3.252 −1.580 −0.090 0.000 4
2) Females (n= 17)
Suitable 0.000 0.630a 3.181a 2.002a 1
Movement −0.630 0.000 2.629a 1.464a 2
Unsuitable −3.181 −2.629 0.000 −0.445 4
Urban −2.002 −1.464 0.445 0.000 3
3) Males (n= 22)
Suitable 0.000 1.418a 3.483a 3.594a 1
Movement −1.418 0.000 2.166 2.434a 2
Unsuitable −3.483 −2.166 0.000 0.666 3
Urban −3.594 −2.434 −0.666 0.000 4
effect on switching probability for females, but C5g (i.e., nest sites are connected by suitable forests, also routes outside home-range boundaries and gaps allowed) in-creased and C2g (i.e., connected by forested habitat by a straight line, but gaps allowed) decreased switching probability for males (Fig. 4c and d, respectively). Thus, there was no clear evidence for connectivity influencing the switching probabilities after accounting for the effect of the distance.
Discussion
We found that flying squirrels responded to increasing amounts of urban habitat along their movement paths by moving faster and longer distances. In general, vari-ous movement patterns of forest-dwelling rodents have been observed in the landscape matrix: animals can move faster and more directly, slower and more tortu-ously, or movements can be interrupted by short stops [62–64]. The observed faster movements as a response to urban habitat suggest that movement mode was likely straight or nearly straight and individuals headed for specific locations. When urban habitat does not pro-vide important resources for the species, it is more efficient to move quickly through the less suitable landscape [65]. Animals may also try to minimize time spent in unsuitable areas, for example, when the habitat is considered more risky [66]. Since predator pressure can alter space use and habitat selection of individuals [67], and it is yet unknown how flying
squirrels perceive the predation risk in modified habi-tats or how large the mortality risk while moving is, this subject requires more investigation. Isolation and increased distances between suitable patches in frag-mented and less-forested landscapes have increased dispersal distances of the flying squirrel and the white-tailed deer (Odocoileus virginianus) [68, 69]. Hence, our results on longer movement paths over urbanized landscape matrix could be related fragmen-tation of the suitable forests by urban land use when individuals need to move further to reach suitable foraging patches. However, there was some heterogen-eity within the urban habitat class, such as areas with trees, and thus, more fine-scale habitat features could also have directed the flying squirrel movements.
may spend several days in one part of the home range before crossing through the matrix to reach another core area due to costs of moving through matrix. In contrast, the availability of suitable habitat had less influence on the nightly moved distances of female flying squirrels, whose home ranges are smaller and often confined within one suitable forest patch [36]. In our case, home ranges of females included more mature spruce-dominated forests that are suitable for breeding than home ranges of males (44 % vs. 24 %). Thus, females have most probably chosen forest patches that are big enough for breeding and raising the young, and as they are territorial they virtually never move outside the home-range they are occupying.
Modification of forests by human land use may affect the availability of nest sites and spacing behaviour of a species. Observations of flying squirrels showed that the number of distinct nest sites was greater in large home ranges. Flying squirrels can use twig nests or buildings, but good nesting cavities are important, especially for breeding females, and lack of cavities could hinder their breeding and rearing of young, lowering overall survival of the young. In addition, individuals with greater amount of nests might benefit by being able to switch to alternative nest when ectoparasite load or predation pressure on the current nest changes [71, 72]. Thus, the availability of nest sites may influence the space use of the species affecting both the shape and size of the home range. For other forest-dwelling animals, the number of nests has either decreased or increased with human disturbance, or nests have become con-centrated in less fragmented areas [73–75]. For in-stance, the northern goshawk (Accipiter gentilis) also seems to suffer from forest harvesting that reduces the area of mature forests and number of alternative nest sites [76]. We found no significant effect of the habitat composition within a home range on the number of nest sites, but its potential association with the availability of nest types should be further investigated.
Our results indicate that extensive space-use by gliding squirrels, especially males, also leads them to utilize un-suitable areas, such as sparsely forested habitat types. We observed differences in habitat preferences between the sexes, as males were using more unsuitable habitats than females. This might be because animals need to oc-casionally cross such habitats in order to reach another part of their home range. There might also be some fine-scale habitat features such as single large trees on clear cut areas or sapling stands that can be used by moving individuals. The use of urban habitats could in-dicate that individual home ranges are located at the edge of forests, for example near old residential areas at low-contrast edges that could provide suitable habitat
and food resources due to increased productivity at the edges [25, 77]. Therefore, we acknowledge that the effects on differential urban habitat types on the move-ment responses of this species should still be clarified.
Temporal variation in the availability and quality of food resources as well as breeding activities may affect the seasonal patterns in movements. For example, red squirrels exploit larger areas if food is scarce [78], but restrict their movements and only defend high-quality core areas if food is abundant [79]. Our results showed that flying squirrel movements varied with month and were sex-dependent. Forests at our study site are herb-rich and contain plenty of deciduous trees where flying squirrels can forage upon food items that can be accessed almost year-round (e.g., catkins in spring and leaves in summer), although there is seasonal variation in availability of the different food types. Thus, long distances moved by males during early spring are most likely caused by the mating season during which they search for females [38]. Although leaf food is available since mid-May, females move little because they have to stay close to nest to take care of the juveniles, while the peak in movements at the end of summer could be re-lated to individuals preparing for the winter by spending the reasonably short nights for foraging [38]. Therefore, it is unlikely that food availability has a major influence on flying squirrel movement patterns at our study area where food is not a limiting factor.
In line with our hypothesis, switching probability was high between nest sites that located close to each other. Moving to a nearby nest could also be easier because structurally connected nest sites are more often closer to each other than unconnected ones. After accounting for the effect of distance, our models gave contradictory re-sults on the effect of connectivity depending on the measure used. Connectivity had a different influence on males: when nests were connected allowing routes out-side home-range boundaries, switching probability for males became higher, but when connection was a straight line switching to nest was smaller. We attribute this inconsistency to the difficulty of measuring connect-ivity in a way that is relevant to the animals [80], or to confounding factors that were not measured such as dif-ferential preferences for the different nest types. For example, cavities might be preferred over twig nests, or some nest sites may provide more shelter than others [73, 75]. Additionally, large-scale habitat selection may influence lower-level patterns, for instance, female flying squirrels may have already selected their territories to be in a continuously forested area large enough, and because of this their nest sites lie within one forest fragment [81].
forest dependent species, although it has not been re-lated to nest-site switching. For instance, the probability of returning home has been greater in connected land-scapes for northern flying squirrels and ringtail possums (Hemibelideus lemuroides), and presence of gaps has in-creased returning time for forest birds [82–84]. In our case, we conclude that the presence of continuous forest corridors is not a necessary condition for flying squir-rels changing their nest sites. Indeed, male flying squirrels regularly cross gaps up to 50 meters in for-est cover [37, 85]. Hence, it is important to further investigate if management of the interspersed matrix could be used to increase connectivity and secure movements between separate habitat patches [22].
Conclusions
On the one hand, our findings show that flying squirrels are able to inhabit urban areas and to change their be-haviour according to habitat type and landscape struc-ture. Since the flying squirrel population decline is ongoing in forested areas in Finland, protecting the spe-cies in urban environments becomes increasingly im-portant and is an interesting possibility. On the other hand, our results highlight the importance of mature forests. We propose that for conserving the species in urbanized areas, enough suitable mature forest for breeding should be maintained at the home-range scale, whereas connectivity between nearby forest patches should be ensured by providing suitable habitat for movements.
Our results indicate that landscape composition can affect the movements of a forest-dwelling species differ-ently on a small scale compared to the larger home-range scale. Faster movements through urbanized habi-tats indicates that these habihabi-tats are less favoured. In-creasing amount of urban habitat within home range decreased distances moved by males, suggesting that movements of the more mobile sex could also be ham-pered by urbanization of the landscape. The importance of forested connections remains unclear and it seems that measuring and maintaining connectivity in a species-specific way is difficult in human-modified landscapes.
Habitat selection and home-range establishment of in-dividuals can ultimately influence their survival and life-time reproductive success, which can have consequences at the whole population level [86, 87]. Since destruction of native habitats is ongoing, protection of many species has to be done in modified landscapes in the future. In order to estimate how well this can succeed for gliding and arboreal squirrels, we propose that the link of habitat use to cost and risks of moving in fragmented landscapes should be studied next.
Ethics approval
The procedure of this study was made in accordance with current laws in Finland and under the license from the Centre for Economic Development, Trans-port and the Environment (permit number: POSELY/ 608 /07.01/2010).
Consent for publication Not applicable.
Additional files
Additional file 1:Description of the yearly data collected during field work.Numbers of followed individuals and tracking periods, and means and standard errors (SE) of moved distances, tracking times, home-range sizes (100 % Minimum convex polygons) and number of locations used for home range estimate are shown separately for females and males. (DOCX 14 kb)
Additional file 2:Change in the number of nest sites with the increasing observation effort.Solid curve shows the cumulative number of nest sites with the growing number of observations when observations are added in order they exist in the data. Dashed curve is generated by a rarefaction method, which finds the mean by sampling among all individuals (Colwell et al. 2012). Here, it describes that number of nests found tends to level off with our sampling intensity. Observation effort denotes a number of days nest site was monitored for an individual. (DOCX 37 kb)
Additional file 3:Example of home-range habitat composition, and locations and connectivity of distinct nest sites of a female Siberian flying squirrel.A female home range by 100 % minimum convex polygon (MCP) is delineated by the black dashed line and numbered stars denote for the distinct nest sites. Different connectivity measures (see methods for details) are shown by blue arrowed lines. Individual could move from nest 1 to nest 2 by a straight line, or tortuously inside or outside home-range boundary, but in all cases the track would also comprise of movement habitat (connectivity measures C2, C4 and C6). However, if moving between nest sites 1, 3 and 4, all movements fall within the suitable habitat (connectivity measures C1, C3 and C5). In order to move from nest 6 to 7, female could move directly via suitable forest or taking detour, but it had to cross a gap in tree cover (connectivity measures C1g and C2g). (DOCX 862 kb)
Additional file 4:Results of model selection and comparison by Akaike’s Information Criteria (AIC).For each response variable (from A to D) a list of highest ranked models (withinΔAICc< 2) and their explanatory variables are shown. For every model the difference of AICc (AIC corrected for small sample sizes) from the best approximated model (lowest AIC) and Akaike weight (wi) is provided. (DOCX 13 kb)
Abbreviations
AIC:Akaike’s information criterion; DIC: Deviance information criterion; GLMM: Generalized linear mixed model; MCMC: Markov chain Monte Carlo; MCP: Minimum convex polygon.
Competing interests
All the authors declare that there are no competing interests.
Authors’contributions
Acknowledgements
We are grateful to Pauliina Järvinen, Veijo Mäkeläinen, Mikael Rytkönen, Marko Schrader (MS) and Andrea Santangeli (AS) for their help in radio-tagging and telemetry. We want to thank MS for help in digitizing the landscape data, AS for commenting the statistics and Dominique Potvin for correcting the language. Heidi Björklund and three anonymous reviewers are thanked for their valuable comments on the earlier version of manuscript.
Funding
This work has been funded by Kuopio Naturalists’Society, Maj and Tor Nessling Foundation (grant numbers: 201200476, 201300150 and 201400367), Oskar Öflund’s Foundation, Research Foundation of the University of Helsinki and Societas pro Fauna et Flora Fennica for SM, and by Academy of Finland (Grant no. 250444) for OO.
Author details
1Finnish Museum of Natural History LUOMUS, University of Helsinki, P. O. Box
17 (P. Rautatiekatu 13), Helsinki FI-00014, Finland.2Department of
Biosciences, University of Helsinki, P. O. Box 65 (Viikinkaari 1), FI-00014 Helsinki, Finland.3Current address: Resource Ecology Group, Wageningen
University, Droevendaalsesteeg 3a, Wageningen 6708 PB, The Netherlands.
Received: 21 November 2015 Accepted: 5 February 2016
References
1. Fischer J, Lindenmayer DB. Landscape modification and habitat fragmentation: a synthesis. Glob Ecol Biogeogr. 2007;16:265–80. 2. Nathan R, Getz WM, Revilla E, Holyoak M, Kadmon R, Saltz D, et al. A
movement ecology paradigm for unifying organismal movement research. Proc Natl Acad Sci U S A. 2008;105:19052–9.
3. Czech B, Krausman P, Devers P. Economic associations among causes of species endangerment in the United States. Bioscience. 2000;50:593–601. 4. McDonald RI, Kareiva P, Forman RTT. The implications of current and future
urbanization for global protected areas and biodiversity conservation. Biol Conserv. 2008;141:1695–703.
5. Jokimäki J, Kaisanlahti-Jokimäki M, Suhonen J, Clergeau P, Pautasso M, Fernandez-Juricic E. Merging wildlife community ecology with animal behavioral ecology for a better urban landscape planning. Landsc Urban Plan. 2011;100:383–5.
6. McKinney M. Urbanization, biodiversity, and conservation. Bioscience. 2002; 52:883–90.
7. McKinney M. Effects of urbanization on species richness: A review of plants and animals. Urban Ecosyst. 2008;11:161–76.
8. Luck M, Wu J. A gradient analysis of urban landscape pattern: a case study from the Phoenix metropolitan region, Arizona, USA. Landsc Ecol. 2002;17: 327–39.
9. DeStefano S, DeGraaf R. Exploring the ecology of suburban wildlife. Front Ecol Environ. 2003;1:95–101.
10. Ditchkoff SS, Saalfeld ST, Gibson CJ. Animal behavior in urban ecosystems: Modifications due to human-induced stress. Urban Ecosyst. 2006;9:5–12. 11. Fahrig L. Non-optimal animal movement in human-altered landscapes.
Funct Ecol. 2007;21:1003–15.
12. Soulé M. Land-use planning and wildlife maintenance - guidelines for conserving wildlife in an urban landscape. J Am Plan Assoc. 1991;57:313–23. 13. Beier P, Noss R. Do habitat corridors provide connectivity? Conserv Biol.
1998;12:1241–52.
14. Betts MG, Forbes GJ, Diamond AW. Thresholds in songbird occurrence in relation to landscape structure. Conserv Biol. 2007;21:1046–58. 15. Taylor P, Fahrig L, Henein K, Merriam G. Connectivity is a vital element of
landscape structure. Oikos. 1993;68:571–3.
16. FitzGibbon SI, Putland DA, Goldizen AW. The importance of functional connectivity in the conservation of a ground-dwelling mammal in an urban Australian landscape. Landsc Ecol. 2007;22:1513–25.
17. Prugh LR, Hodges KE, Sinclair ARE, Brashares JS. Effect of habitat area and isolation on fragmented animal populations. Proc Natl Acad Sci U S A. 2008; 105:20770–5.
18. Simberloff D, Farr J, Cox J, Mehlman D. Movement corridors - conservation bargains or poor investments. Conserv Biol. 1992;6:493–504.
19. Andreassen H, Halle S, Ims R. Optimal width of movement corridors for root voles: Not too narrow and not too wide. J Appl Ecol. 1996;33:63–70.
20. Haddad N, Bowne D, Cunningham A, Danielson B, Levey D, Sargent S, et al. Corridor use by diverse taxa. Ecology. 2003;84:609–15.
21. Laurance S, Laurance W. Tropical wildlife corridors: use of linear rainforest remnants by arboreal mammals. Biol Conserv. 1999;91:231–9.
22. Caryl FM, Thomson K, van der Ree R. Permeability of the urban matrix to arboreal gliding mammals: Sugar gliders in Melbourne, Australia. Austral Ecol. 2013;38:609–16.
23. Prevedello JA, Forero-Medina G, Vieira MV. Movement behaviour within and beyond perceptual ranges in three small mammals: effects of matrix type and body mass. J Anim Ecol. 2010;79:1315–23.
24. Ewers R, Didham R. Confounding factors in the detection of species responses to habitat fragmentation. Biol Rev. 2006;81:117–42.
25. Lidicker WZ. Responses of mammals to habitat edges: an overview. Landsc Ecol. 1999;14:333–43.
26. Ricketts TH. The matrix matters: Effective isolation in fragmented landscapes. Am Nat. 2001;158:87–99.
27. Bakker V, Van Vuren D. Gap-crossing decisions by the red squirrel, a forest-dependent small mammal. Conserv Biol. 2004;18:689–97.
28. van der Ree R, Bennett A, Gilmore D. Gap-crossing by gliding marsupials: thresholds for use of isolated woodland patches in an agricultural landscape. Biol Conserv. 2004;115:241–9.
29. Brearley G, Bradley A, Bell S, McAlpine C. Influence of contrasting urban edges on the abundance of arboreal mammals: A study of squirrel gliders (Petaurus norfolcensis) in southeast Queensland, Australia. Biol Conserv. 2010; 143:60–71.
30. Verbeylen G, De Bruyn L, Adriaensen F, Matthysen E. Does matrix resistance influence Red squirrel (Sciurus vulgarisL. 1758) distribution in an urban landscape? Landsc Ecol. 2003;18:791–805.
31. Wilson DE, Reeder DM. Mammal species of the world: a taxonomic and geographic reference. 3rd ed. Baltimore: Johns Hopkins University press; 2005.
32. Rassi P, Hyvärinen E, Juslén A, Mannerkoski I. The 2010 Red List of Finnish Species. Helsinki: Ministry of the Environment & Finnish Environment Institute SYKE; 2010.
33. Hokkanen H, Törmälä T, Vuorinen H. Decline of the flying squirrelPteromys volans L.populations in Finland. Biol Conserv. 1982;23:273–84.
34. Hanski IK. Home ranges and habitat use in the declining flying squirrel
Pteromys volansin managed forests. Wildl Biol. 1998;4:33–46.
35. Reunanen P, Mönkkönen M, Nikula A. Habitat requirements of the Siberian flying squirrel in northern Finland: comparing field survey and remote sensing data. Ann Zool Fenn. 2002;39:7–20.
36. Selonen V, Hanski IK, Stevens PC. Space use of the Siberian flying squirrelPteromys volansin fragmented forest landscapes. Ecography. 2001;24:588–600.
37. Selonen V, Hanski IK. Movements of the flying squirrelPteromys volansin corridors and in matrix habitat. Ecography. 2003;26:641–51.
38. Hanski IK, Stevens PC, Ihalempiä P, Selonen V. Home-range size,
movements, and nest-site use in the Siberian flyng squirrel,Pteromys volans. J Mammal. 2000;81:798–809.
39. Selonen V, Painter JN, Rantala S, Hanski IK. Mating system and reproductive success in the Siberian flying squirrel. J Mammal. 2013;94:1266–73. 40. Hanski IK, Mönkkönen M, Reunanen P, Stevens P. Ecology of the Eurasian
flying squirrel (Pteromys volans) in Finland. In: Goldingay RL, Scheibe J, editors. Biology of gliding mammals. Fürth: Filander Verlag; 2000. p. 67–86. 41. Mäkeläinen S, Schrader M, Hanski IK. Factors explaining the occurrence of
the Siberian flying squirrel in urban forest landscape. Urban Ecosyst. 2015; 18:223–38.
42. Jokinen M, Mäkeläinen S, Ovaskainen O.‘Strict’, yeat ineffective: legal protection of the breeding sites and resting places fails with the Siberian flying squirrel. Anim Conserv. 2015;18:167–75.
43. Santangeli A, Wistbacka R, Hanski IK, Laaksonen T. Ineffective enforced legislation for nature conservation: A case study with Siberian flying squirrel and forestry in a boreal landscape. Biol Conserv. 2013;157:237–44. 44. Ahti T, Hämet-Ahti L, Jalas J. Vegetation zones and their sections in
northwestern Europe. Ann Bot Fenn. 1968;5:169–211.
45. Calenge C. The package adehabitat for the r software: a tool for the analysis of space and habitat use by animals. Ecol Model. 2006;197:516–9. 46. Zuur AF, Ieno EN, Elphick CS. A protocol for data exploration to avoid
common statistical problems. Method Ecol Evol. 2010;1:3–14. 47. Burnham KP, Anderson DR. Model selection and multimodel inference.
48. Hooten MB, Hobbs NT. A guide to Bayesian model selection for ecologists. Ecol Monogr. 2015;85:3–28.
49. Grueber CE, Nakagawa S, Laws RJ, Jamieson IG. Multimodel inference in ecology and evolution: challenges and solutions. J Evol Biol. 2011;24: 699–711.
50. Symonds MRE, Moussalli A. A brief guide to model selection, multimodel inference and model averaging in behavioural ecology using Akaike’s information criterion. Behav Ecol Sociobiol. 2011;65:13–21.
51. Colwell RK, Chao A, Gotelli NJ, Lin SY, Mao CX, Chazdon RL, et al. Models and estimators linking individual-based and sample-based rarefaction, extrapolation and comparison of assemblages. J Plant Ecol. 2012;5:3–21. 52. Oksanen J, Blanchet FG, Kindt R, Legendre P, Minchin PR, O’Hara RB,
Simpson GL, Solymos P, Stevens MHH, Wagner H. vegan: Community Ecology Package. R package version 2.3-2. URL https://github.com/ vegandevs/vegan; 2015
53. Aebischer N, Robertson P, Kenward R. Compositional analysis of habitat use from animal radio-tracking data. Ecology. 1993;74:1313–25.
54. Erickson WP, McDonald TL, Gerow KG, Howlin S, Kern JW. Statistical analyses in resource selection studies with radio-marked animals. In: Millspaugh JJ, Marzluff JM, editors. Radio tracking and animal populations. San Diego: Academic; 2001. p. 209–42.
55. Boyce M, McDonald L. Relating populations to habitats using resource selection functions. Trends Ecol Evol. 1999;14:268–72.
56. Aarts G, MacKenzie M, McConnell B, Fedak M, Matthiopoulos J. Estimating space-use and habitat preference from wildlife telemetry data. Ecography. 2008;31:140–60.
57. Aitchison J. The statistical analysis of compositional data. London: Chapman and Hall; 1986.
58. R Core Team. R: A language and environment for statistical computing. R Foundation for Statistical Computing, Vienna, Austria. URL https://www.R-project.org/; 2013.
59. Gelman A, Carlin JB, Stern HS, Dunson DB, Vehtari A, Rubin DB. Bayesian data analysis. 3rd ed. Boca Raton: CRC; 2014.
60. Ovaskainen O, Rekola H, Meyke E, Arjas E. Bayesian methods for analyzing movements in heterogeneous landscapes from mark-recapture data. Ecology. 2008;89:542–54.
61. Spiegelhalter D, Best N, Carlin B, van der Linde A. Bayesian measures of model complexity and fit. J R Stat Soc Series B Stat Methodol. 2002;64: 583–616.
62. Flaherty EA, Smith WP, Pyare S, Ben-David M. Experimental trials of the Northern flying squirrel (Glaucomys sabrinus) traversing managed rainforest landscapes: perceptual range and fine-scale movements. Can J Zool. 2008; 86:1050–8.
63. Rizkalla CE, Swihart RK. Explaining movement decisions of forest rodents in fragmented landscapes. Biol Conserv. 2007;40:339–48.
64. Smith MJ, Forbes GJ, Betts MG. Landscape configuration influences gap-crossing decisions of northern flying squirrel (Glaucomys sabrinus). Biol Conserv. 2013;168:176–83.
65. Zollner P, Lima S. Search strategies for landscape-level interpatch movements. Ecology. 1999;80:1019–30.
66. Schick RS, Loarie SR, Colchero F, Best BD, Boustany A, Conde DA, et al. Understanding movement data and movement processes: current and emerging directions. Ecol Lett. 2008;11:1338–50.
67. DeCesare NJ, Hebblewhite M, Bradley M, Hervieux D, Neufeld L, Musiani M. Linking habitat selection and predation risk to spatial variation in survival. J Anim Ecol. 2014;83:343–52.
68. Selonen V, Hanski IK. Young flying squirrels (Pteromys volans) dispersing in fragmented forests. Behav Ecol. 2004;15:564–71.
69. Long E, Diefenbach D, Rosenberry C, Wallingford B, Grund M. Forest cover influences dispersal distance of white-tailed deer. J Mammal. 2005;86:623–9. 70. Brearley G, McAlpine C, Bell S, Bradley A. Squirrel glider home ranges near
urban edges in eastern Australia. J Zool. 2011;285:256–65.
71. Roper TJ, Jackson TP, Conradt L, Bennett NC. Burrow use and the influence of ectoparasites in Brants’whistling ratParotomys brantsii. Ethology. 2002;108:557–64.
72. Haukisalmi V, Hanski IK. Contrasting seasonal dynamics in fleas of the Siberian flying squirrel (Pteromys volans) in Finland. Ecol Entomol. 2007;32:333–7.
73. Pyare S, Smith WP, Shanley CS. Den use and selection by northern flying squirrels in fragmented landscapes. J Mammal. 2010;91:886–96.
74. Lehrer EW, Schooley RL. Space use of woodchucks across an urbanization gradient within an agricultural landscape. J Mammal. 2010;91:1342–9. 75. Salsbury C, Dolan R, Pentzer E. The distribution of fox squirrel (Sciurus niger)
leaf nests within forest fragments in central Indiana. Am Midl Nat. 2004;151: 369–77.
76. Saga O, Selas V. Nest reuse by Goshawks after timber harvesting: Importance of distance to logging, remaining mature forest area and tree species composition. For Ecol Manage. 2012;270:66–70.
77. Harper K, Macdonald S, Burton P, Chen J, Brosofske K, Saunders S, et al. Edge influence on forest structure and composition in fragmented landscapes. Conserv Biol. 2005;19:768–82.
78. Lurz P, Garson P, Wauters L. Effects of temporal and spatial variations in food supply on the space and habitat use of red squirrels (Sciurus vulgarisL.). J Zool. 2000;251:167–78.
79. Verbeylen G, Wauters LA, De Bruyn L, Matthysen E. Woodland fragmentation affects space use of Eurasian red squirrels. Acta Oecol. 2009;35:94–103. 80. Belisle M. Measuring landscape connectivity: The challenge of behavioral
landscape ecology. Ecology. 2005;86:1988–95.
81. Johnson DH. The comparison of usage and availability measurements for evaluating resource preference. Ecology. 1980;61:65–71.
82. Smith MJ, Betts MG, Forbes GJ, Kehler DG, Bourgeois MC, Flemming SP. Independent effects of connectivity predict homing success by northern flying squirrel in a forest mosaic. Landsc Ecol. 2011;26:709–21.
83. Wilson RF, Marsh H, Winter J. Importance of canopy connectivity for home range and movements of the rainforest arboreal ringtail possum (Hemibelideus lemuroides). Wildl Res. 2007;34:177–84.
84. Tremblay MA, St Clair CC. Permeability of a heterogeneous urban landscape to the movements of forest songbirds. J Appl Ecol. 2011;48:679–88. 85. Desrochers A, Hanski IK, Selonen V. Siberian flying squirrel responses to
high- and low-contrast forest edges. Landsc Ecol. 2003;18:543–52. 86. Mcloughlin PD, Gaillard J, Boyce MS, Bonenfant C, Messier F, Duncan P, et
al. Lifetime reproductive success and composition of the home range in a large herbivore. Ecology. 2007;88:3192–201.
87. Matthiopoulos J, Fieberg J, Aarts G, Beyer HL, Morales JM, Haydon DT. Establishing the link between habitat selection and animal population dynamics. Ecol Monogr. 2015;85:413–36.
• We accept pre-submission inquiries
• Our selector tool helps you to find the most relevant journal
• We provide round the clock customer support
• Convenient online submission
• Thorough peer review
• Inclusion in PubMed and all major indexing services
• Maximum visibility for your research
Submit your manuscript at www.biomedcentral.com/submit