R E S E A R C H
Open Access
Impact of oleic acid as co-substrate of glucose on
“
short
”
and
“
long-term
”
Crabtree effect in
Saccharomyces cerevisiae
Jillian Marc
†, David Feria-Gervasio
†, Jean-Roch Mouret
†and Stéphane E Guillouet
*Abstract
Background:Optimization of industrial biomass directed processes requires the highest biomass yield as possible. Yet, some useful yeasts likeSaccharomyces cerevisiaeare subject to the Crabtree effect under glucose excess. This phenomenon can occur in large scale tank where heterogeneities in glucose concentrations exist. Therefore yeasts encounter local environments with glucose excess leading to ethanol production to the detriment of biomass formation. We previously demonstrated that oleic acid as a co-substrate in glucose-limited chemostat allowed to delay and modulate the“short-term”Crabtree effect inSaccharomyces cerevisiae. Here we further investigated the effect of oleic acid as a modulator of the Crabtree effect.
Results:The impact of oleic acid as co-substrate on the Crabtree effect was investigated in terms of i) strain specificity, ii) reversibility of the potential effect with aerobic glucose-excess batches and iii) durability and maximal capacities under high ethanol stress with glucose-excess fed-batches. First, the addition of oleic acid resulted in an increase of the critical dilution rate by 8% and the specific carbon uptake rate by 18%. Furthermore, a delay was observed for the onset of ethanol production when a batch was inoculated with cells previously grown in glucose-oleate chemostat. Finally, the culture of adapted cells in a glucose-oleate fed-batch led to a redirection of the carbon flux toward biomass production, with a 73% increase in the biomass yield.
Conclusions:This work demonstrated clearly that the perturbation by oleic acid as co-substrate resulted in a decrease in the“short-term”and“long-term”Crabtree effects. This impact was not strain dependent and reversible. Thus, industrial applications of this biochemical strategy could be envisaged to tackle heterogeneities issues in large scale tanks or to prepare starter yeasts for various applications.
Keywords:Saccharomyces cerevisiae, Ethanolic fermentation, Oleic acid, Crabtree effect, Accelerostat, Batch, Fed-batch
Background
The repression of oxidative pathways by glycolytic activity resulting in simultaneous fermentation and respiration was named “Crabtree effect” [1-3]. The resulting oxido-reductive metabolism is characterized by a byproduct formation (ethanol, glycerol and weak acids), a loss in biomass yield and a limited oxygen specific uptake rate. It is named“long-term”effect when it appears in glucose ex-cess batch and fed-batch or in glucose-limited chemostat
at dilution rates over the critical dilution rate (Dc), involv-ing adaptation of cell metabolism, while it is named “short-term”effect after a glucose pulse in glucose-limited chemostat at dilution rates under Dc[4].
The mostly global accepted theory to explain this mechanism is a limited respiratory capacity in Crabtree-positive cells. This respiratory capacity includes the whole cytosolic and mitochondrial pathways responsible for the respiratory catabolism of pyruvate, including the respiratory chain. It is saturated above a critical thresh-old of glucose uptake rate. Then, the cell directs the ex-cess of glycolytic flux toward fermentative metabolism with apparition of ethanol production [5,6]. This theory was supported by studies using genetic engineering * Correspondence:stephane.guillouet@insa-toulouse.fr
†Equal contributors
Laboratoire d'Ingénierie des Systèmes Biologiques et des Procédés (LISBP), Institut National des Sciences Appliquées (INSA), UMR INSA/CNRS 5504, UMR INSA/INRA 792, 135 Avenue de Rangueil, 31077 Toulouse Cedex 4, France
approach. However, isolated deletion or over-expression of various genes coding for enzymes within the respira-tory capacity did not success to bring out any single lim-iting reaction [7-15].
Modulation of the metabolic transition was successfully reported after engineering global regulation functions. The deletion ofMIG1andMIG2, coding for a positive regulator in glucose repression led to a 5% higher Dc, at 0.274 h-1 [16]. The over-expression of HAP4, coding for a positive regulator of genes involved in respiratory metabolism, led to a 10% higher Dc, at 0.33 h-1[17]. Decreasing intracellu-lar NADH/NAD+ ratio by expressing a heterologous gene coding for a mitochondrial oxidase (AOX1) led also to a 10% higher Dc, at 0.32 h-1 [18]. Furthermore, modulation of“short-term” Crabtree effect was also reported through co-substrate feeding. Feeding oleic acid as a co-substrate of glucose enabled to delay and modulate the “short-term” metabolic transition apparition in cells [19].
The latter approach was carried out by feeding an aer-obic glucose-limited chemostat at D = 0.16 h-1 with oleic acid. After a glucose pulse of 10 g L-1, a delay up to 15 min in the onset of the metabolic shift, a 33% decrease in the ethanol production, and a redirection of the carbon flux toward biomass production were observed. Moreover, spe-cific activities of carnitine-acetyl transferase, isopropyl-malate synthase and citrate synthase were increased. These ones are enzymatic systems involved in the trans-port of acetyl-coA through the mitochondria membrane [20-24]. Nevertheless, explanation of oleate effect on the metabolism remained unclear. First, the presence of this acid as co-substrate of glucose may have induced a “substrate effect” (degradation of the oleic acid through the β-oxidation pathway introducing a supplemental car-bon flux into the central metabolism with potentially allo-steric modifications). Feria-Gervasio et al. [19] conducted a glucose pulse experiment during a glucose-succinate chemostat in order to mimic the substrate effect of the oleic acid, but data obtained suggested that the“substrate effect” was not the major effect responsible for the de-crease in the transition from respiratory to fermentative metabolism. Secondly, oleic acid may have induced a “genetic effect”, acting at the transcriptional and / or translational level via regulatory complex systems. In-deed, this acid is known to induce the transcription of various genes possessing the ORE (Oleate Response Element) sequence on their promoter [23]. This last hy-pothesis was strengthened by the observation of in-creased specific activities of enzymes coded by such genes in presence of oleic acid [19].
These previous efforts led to an overview of the im-pact of oleic acid on the “short-term” Crabtree effect. Nonetheless, the processes used for industrial applica-tions for which Crabtree effect is unwanted, like starter yeasts or heterologous protein production, could led to
“long-term” as well as “short-term” Crabtree effect. Moreover, the range of S. cerevisiae strains used in in-dustry is wide and their behavior could largely differ from CEN.PK 113-7D. Based on these observations, pre-vious work of Feria-Gervasio et al. [19] needed to be completed. Thus in the present work, we further investi-gated the impact of oleic acid including a determination of its specificity using an industrial strain (S. cerevisiae CA10/pCD63), the determination of the critical dilution rate for purely oxidative metabolism (Dc), an investi-gation of the reversibility of the effect and finally a characterization of the durability of the effect under con-ditions resulting in“long-term”Crabtree effect onset.
Results & discussion
We previously demonstrated that oleic acid as a co-substrate in glucose-limited chemostat (D=0.16 h-1) allowed to delay and modulate the transition from respira-tory to oxido-reductive metabolism, so called“short-term” Crabtree effect, inSaccharomyces cerevisiaeCEN.PK 113-7D. As a consequence of the modulation of the transition, ethanol production was decreased and the carbon flow was redirected toward the biomass production [19]. In order to further characterize this effect, the impact of oleic acid was investigated in terms of strain specificity, durabi-lity and reversibidurabi-lity of the effect.
The oleic acid impact was not specific to the CEN.PK 113-7D strain
To evaluate the strain specificity of the impact of oleic acid on the transition from oxidative to oxido-reductive metabolism, glucose pulse experiment was carried out at the steady state of a glucose-limited chemostat with and without oleic acid with the strain CA10/pCD63. Results were compared with those previously obtained with
Thus, the impact of oleic acid on the dynamic profiles of ethanol production and RQ were similar for both strains, however less slightly pronounced forS.cerevisiae CA10/pCD63.
Oleic acid impacted also the critical dilution rate (Dc)
In order to determine the critical dilution rate for S. cerevisiae CEN.PK 113-7D with and without oleic acid as co-substrate (D=0.0073 h-1), accelerostat cul-tures were carried out by increasing the glucose feeding as a function of time. The dilution rate was increased from an initial value of 0.16 h-1to a final value of 0.30 h-1 with a constant acceleration of 0.005 h-2.
The onset of the transition from respiratory to oxido-reductive metabolism, corresponding to the Dc, was characterized by the increase in the ethanol production and the decrease in the biomass yield (Yx/s). This hap-pened at 0.24 h-1 on sole glucose (Figure 2A) but the
presence of oleic acid in the fermentation broth led to an 8% increase at 0.26 h-1(Figure 2B). The difference in Dc was in the same order of magnitude as those found in the literature with mutant strains. A first study delet-ing MIG1andMIG2, coding for a regulator involved in the glucose repression, led to a 5% increase in the Dc de-termined with the same technique [16]. Over-expressing the transcription factor Hap4p led to a 10% increase in Dcestimated in chemostat cultures [17]. Finally, Vemuri
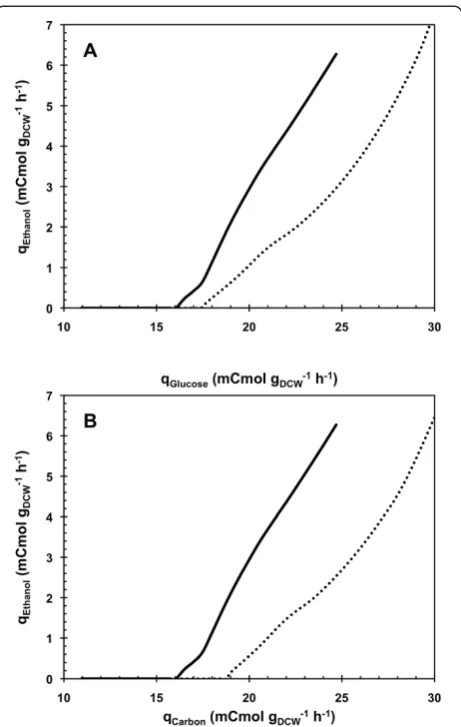
et al. [18] showed a 10% increased in Dcby expressing a heterologuous oxidase during productostat cultures [25]. Under cellular metabolism considerations, this 8% in-crease in Dccorresponded to an 8% higher specific con-sumption rate of glucose for the onset of the metabolic transition, from 16.5 to 17.8 mCmol gDCW-1 h-1 (Figure 3). Previous study of Feria-Gervasio et al. [19] demonstrated that modulation of this transition was not correlated to the electron transport chain capacity. 1
1,5 2 2,5 3 3,5 4 4,5 5
-0,2 0 0,2 0,4 0,6 0,8 1
RQ
Time (h) CA10/pCD63
0 0,5 1 1,5 2 2,5 3
-0,2 0 0,2 0,4 0,6 0,8 1
Ethanol (g L
-1)
Time (h) CA10/pCD63
0,8 1 1,2 1,4 1,6 1,8 2 2,2 2,4 2,6
-0,2 0 0,2 0,4 0,6 0,8 1 1,2
RQ
Time (h) CEN.PK 113-7D
0 0,5 1 1,5 2 2,5 3
-0,2 0 0,2 0,4 0,6 0,8 1 1,2
Ethanol (g L
-1)
Time (h) CEN.PK 113-7D
Figure 1Changes in the ethanol concentration and RQ upon a glucose pulse.Pulse of 10 g L-1of glucose (indicated by thearrow) was
done at the steady state of glucose limited chemostat of strain CA10/pCD63 and CEN.PK 113-7D in absence (open symbols) or in presence (full symbols) of an oleic acid feeding at Dole= 0.0041 h-1(CA10/pCD63) and Dole= 0.0073 h-1(CEN.PK 113-7D). Carbon balances were evaluated
Thereby, both observations suggested that addition of oleic acid resulted in an enhancement of the so-called ”respiratory capacity” (black box model including the metabolic cytosolic and mitochondrial pathways respon-sible for the respiratory catabolism of pyruvate), permit-ting cells to metabolize glucose at higher rates without employing the fermentative way.
In regard to the total carbon (glucose and oleic acid) up-take rate, the Dccorresponds to a 15% higher carbon uptake rate in glucose-oleate A-stat, from 16.5 to 19.0 mCmol gDCW-1h-1(Figure 3), oleic acid carbon accounting for 7%.
Oleic acid effect was at least partially reversible
Batch cultures were performed in order to determine the reversibility of the oleate impact. Pre-grown cells on glucose-oleate carbon source were transferred in glucose batch cultures with or without oleic acid as co-substrate (BGCGO and BGOCGO). Their ethanolic performances
were compared to a control glucose batch with cells precultured on glucose only (BGCG).
Batch cultivations on glucose only showed that cells precultured on glucose + oleic acid as the carbon sources (BGCGO) presented a 1 hour greater delay in the onset of ethanol production than the cells pregrown on glucose only (BGCG) (Figure 4). Biomass-oriented rearrangement of the metabolism was thus conserved even when oleate was removed from the culture broth. However, cells precultured on glucose + oleic acid as the carbon sources and transferred in a batch containing glucose and oleic acid (BGOCGO) presented a 1 hour even greater delay than when growing on glucose alone (BGCGO). As a conse-quence, a constant oleic acid pressure seemed necessary
Figure 2Specific ethanol production rate and biomass yield during A-stat cultivations.Specific ethanol production rate (▲) and biomass yield (■) during A-stat cultivations on glucose in absence(ASGCG;A)or presence(ASGOCGO;B)of oleic acid feeding
at Dole= 0.0073 h-1.Linesrepresented the evolution profile
calculated by carbon and degree of reduction balances.
Figure 3Specific ethanol production rate as a function of the specific consumption rates of glucose and carbon during A-stat cultivations.Specific ethanol production rate is given as a function of the specific consumption rates of glucose(A)and the specific consumption rate of carbon(B)during A-stat cultivations on glucose in absence (ASGCG;solid lines) or presence (ASGOCGO;dotted lines) of
oleic acid feeding at Dole= 0.0073 h-1. The A-stat cultivations of
to conserve for a long period the whole impact on the cell metabolism. Therefore, these observations indicated a par-tial reversibility of the oleic acid effect in cells once oleic acid was removed.
Oleic acid impact was effective for hours during VHEP fermentation under oleate pressure
The impact of oleic acid on the oxido-reductive metab-olism and its durability were further studied during batch conditions. A first glucose-excess aerobic fed-batch cultivation was carried out with glucose as sole carbon source inoculated with cells precultured on glu-cose (FBGCG). A second fed-batch was carried out with cells pregrown on glucose and oleic acid as co-substrate (FBGOCGO) for comparison.
Kinetics of biomass and ethanol produced suggested that the presence of oleic acid in the medium promoted the growth of yeasts to the detriment of ethanol produc-tion and led to a shorter fermentaproduc-tion time (Figure 5). This was confirmed in view of the global yields on glu-cose consumed (Table 1). Biomass yield was increased by 35% as well as its final concentration by 73%. Ethanol yield was meanwhile decreased by 8% and the final titer of ethanol by 7% (116.2 vs 126.8 g L-1), although its yield was not statistically different. The maximal production rates of ethanol and glycerol were decreased by 67% and 39%, respectively (Table 1). This clearly confirmed that oleic acid negatively impacted the fermentative capaci-ties of the cells during aerobic fed-batch cultures. Car-bon metabolism was thus preferentially directed toward
biomass production although no variation was observed for the maximal specific growth rate.
Table 1 showed a greater production of succinate in the cells precultured on glucose + oleic acid (FBGOCGO). Final concentration, global yield and maximal specific rate of production of this organic acid were increased re-spectively by 34%, 67% and 114% when oleate was added in the fermentation broth. Measurements did not reveal any oleate consumption during the fed-batch FBGOCGO experiment. Moreover carbon mass balance was found close to 100% taking into account only glucose as sub-strate, confirming that no oleic acid was consumed. Therefore, a succinate synthesis from the catabolism of oleic acid through the β-oxidation and glyoxylate path-ways cannot be taken into consideration. The cycle of the tricarboxylic acids was then supposed to be the source of succinate excretion under fermentative metab-olism with glucose as sole carbon source, as previously mentioned by Camarasa et al. [26]. Moreover, HCO3 -was known to inhibit numerous enzymes such as TCA cycle succinate dehydrogenase [27]. During our experi-ments, succinate was produced in the first phase of the fed-batches, corresponding to the slightly extended growth phase, corresponding when the highest rates of CO2production occurred (results not shown). Assuming that succinic acid derived from the tricarboxylic acids cycle (TCA), the increased excretion of succinate could be interpreted as a higher activity of the TCA cycle. These observations were strengthened by the increased oxygen consumption observed in presence of oleic acid (data not shown) and previously described by Feria-Gervasioet al. [19] in aerobic chemostat.
Figure 4Concentration of ethanol during aerobic batch cultivations.The batch cultivations ofSaccharomyces cerevisiaeCEN. PK 113-7D were inoculated with cells gathered at the steady state of glucose limited chemostat at D=0.16 h-1(Batch glucose (BGCG);☐) or
with cells gathered at the steady state of glucose limited chemostats at D=0.16 h-1in presence of oleate at Dole=0.0073 h-1
(Batch glucose (BGCGO);■and Batch glucose with oleic acid
(BGOCGO);▲).Linesrepresented the evolution profile calculated by
carbon and degree of reduction balances.
Figure 5Evolution of biomass and ethanol cumulated masses during aerobic fed-batch cultivations.(☐) biomass and (△) ethanol produced bySaccharomyces cerevisiaeCEN.PK 113-7D.Open symbolsrepresent the glucose-excess fed-batch with non-adapted cells (FBGCG),full symbolsrepresent the glucose-oleate-excess
Glycerol production was also decreased in presence of oleic acid. Final concentration and maximal specific rate of production of glycerol were decreased respectively by 15% and 39%. In addition to its role in the stress response, glycerol formation is known to ensure the cytosolic NADH reoxidation when oxido-reductive me-tabolism occurs for anabolic purpose [28]. The decrease in glycerol production was likely the result of the in-crease in the oxygen consumption rate observed in the presence of oleic acid. Similar correlation between gly-cerol formation and oxygen consumption rate were reported in the literature either by modulating the aer-ation regime [29], by reducing the glycerol production through the control of the RQ [30] or by metabolic en-gineering approaches [18,31].
Considering the differences on succinate, pyruvate, gly-cerol productions and on oxygen consumption, we can rea-sonably make the statement that the presence of oleic acid enhanced the global respiratory capacity inS.cerevisiae.
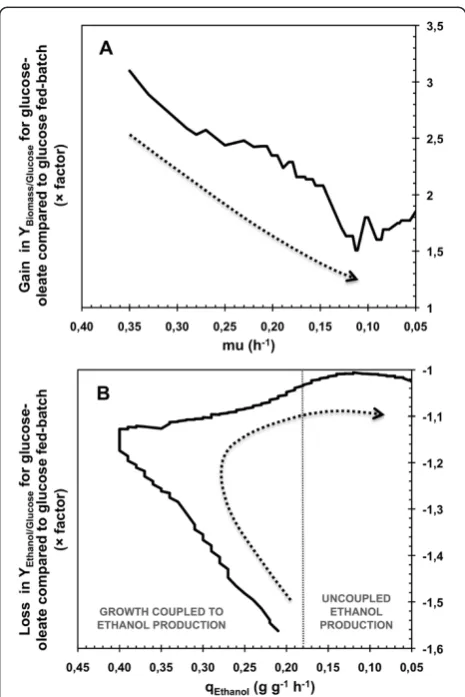
Figure 6 presented the gain on biomass yield and the loss on ethanol yield in glucose-oleate fed-batch compared to glucose fed-batch. In these graphics, the diminution of
μ and qEthanol can be linked to the experiment progress and permitted an overview on the evolution of the oleate impact strength on the cell metabolism. Gain on biomass yield decreased during the major part of growth phase, from an initial factor of 3.2 to a lower of 1.5. Moreover, loss on ethanol yield decreased from a factor of 1.57 at the beginning of the culture to 1.04 at the end of the growth phase, i.e. for qEthanolbelow 0.18 g g-1h-1. When uncoupled ethanol production occurred, i.e. for specific rate of ethanol production below 0.18 g g-1h-1, this factor was between 1 and only 1.04. This clearly revealed a continuous loss of the strength of the oleic acid impact on the cell metabolism with the culture progress. When the growth phase ended, this impact even almost disappeared. Thus, oleic acid impacted cell metabolism mainly when growth happened during VHEP experiments.
Table 1 Final concentrations, global yields and maximal specific rates obtained during aerobic fed-batch cultivations
Biomass Ethanol Glycerol Acetate Succinate Pyruvate Final concentration FBGCG g L
-1
13.2 ± 0.3 126.8 ± 0.6 4.96 ± 0.02 5.28 ± 0.04 0.53 ± 0.01 0.36 ± 0.01
FBGOCGO g L -1
22.9 ± 0.5 116.2 ± 1.1 4.21 ± 0.05 5.1 ± 0.1 0.71 ± 0.03 0.37 ± 0.06
Difference % 73 −8 −15 3 34 3
Yield FBGCG g g-1 0.174 ± 0.005 0.432 ± 0.008 0.0142 ± 0.0012 0.0158 ± 0.0006 0.0027 ± 0.0006 0.0013 ± 0.0003
FBGOCGO g g-1 0.234 ± 0.012 0.40 ± 0.01 0.015 ± 0.002 0.0171 ± 0.0004 0.0045 ± 0.0002 0.0013 ± 0.0002
Difference % 35 −7 6 8 67 0
Maximal specific rate FBGCG g g-1L-1 0.35 ± 0.01 1.31 ± 0.05 0.074 ± 0.008 0.034 ± 0.004 0.007 ± 0.002 0.013 ± 0.004
FBGOCGO g g-1L-1 0.38 ± 0.03 0.43 ± 0.03 0.045 ± 0.008 0.047 ± 0.002 0.015 ± 0.003 0.017 ± 0.004
Difference % 8 −67 −39 38 114 30
Saccharomyces cerevisiaeCEN.PK 113-7D was cultivated under glucose-excess (FBGCG) or glucose-oleate-excess (FBG0CG0) conditions. Representative differences are
in bold.
Implication for scale up biomass production process The understanding and control of biomass production processes present an important interest from an eco-nomical point of view. The main microorganism used for these processes is Saccharomyces because of its utilization in a wide variety of food industries. Van hoek
et al. [32] showed that the quality of commercial baker’s yeast (S.cerevisiae) was determined by many parameters including storage, stability, osmotolerance, freeze-thaw resistance, rehydratation resistance and color.
Under aerobic conditions, the ethanol formation appeared when the residual glucose concentration was higher than 0.1 g L-1for which the specific growth rate exceeded the critical value Dc[4,33-35].
Nevertheless, this particularity is quite undesirable during biomass production since it reduces the biomass yield on the carbon feedstock. For this reason, industrial starter yeast production is performed in aerobic, sugar-limited fed-batch cultures. The optimization of process productivity therefore requires the higher increase as pos-sible of the specific growth rate and / or of the biomass yield. Process optimization has been so far based on strain selection and empirical optimization of the environmental parameters such as pH, temperature, aeration rate and feeding profiles of sugar, nitrogen and phosphorus [36-38]. Moreover, large tanks used for industrial production lead to scale-up difficulties due to the appearance of heterogeneities, in particular for glucose and oxygen concentrations. Mixing time was estimated between 10 seconds and 250 seconds considering the tank size from 12 to 30 m3[39-42]. Mimicking the cell life in bio-reactor was done with complex systems of biobio-reactors presenting different substrate and oxygen conditions. It revealed onsets of metabolic rearrangements in the order of the second [39,43]. The present study and pre-vious work of Feria-Gervasio et al. [19] showed that addition of oleic acid in the fermentation broth permit-ted the yeast to present a delay for the metabolic shift onset after a sudden increase of glucose concentration in the range of few minutes.
Thus, an industrial use of oleic acid in such processes could lead to better manage the heterogeneities issues when the Crabtree effect onset is not desirable. Moreover, we demonstrated that the impact of oleate was not strain dependent but reversible. Therefore, starter yeasts pre-pared with oleate as co-substrate of glucose could be further used in various applications, implementing the Crabtree effect or not.
Conclusions
In this work we demonstrated that adding oleic acid as a co-substrate of glucose allowed to decrease the occur-rence of the “short-term” Crabtree effect as well as the “long-term”one. In both cases, biomass production was
widely enhanced to the detriment of ethanol, and an 8% increase in the critical dilution rate has been reported. Because these biochemical phenomena were shown to be not strain dependent but reversible, industrial appli-cations could be rationally envisaged in various purposes requiring a more efficient control of the Crabtree effect.
Methods Strain and media
The yeast strain S. cerevisiae CEN.PK 113-7D [44] and CA10/pCD63 (provided by Sanofi Aventis industry) were stored in 30% glycerol at -80°C. CA10/pCD63 was auxo-troph for adenine and histidine [45]. The cells were first grown on YPD plates (10 g L-1 yeast extract, 20 g L-1 bactopeptone, 20 g L-1 glucose, 15 g L-1agar) at 30°C. All subsequent pre-cultures and culture experiments were car-ried out at 30°C in mineral medium as described by Feria-Gervasioet al. [19], except for fed-batch technique. When using the CA10/pCD63 strain the mineral medium was supplemented with adenine and histidine in the reservoir medium at 0.2 g L-1. Medium used for fed-batch experi-ment contained per litre: KH2PO4, 6 g; (NH4)2SO4, 12 g; MgSO4, 1 g. A sequential vitamins and trace elements feed-ing strategy based on the growth profile was applied [46] to reach per liter: EDTA, 0.03 g; ZnSO4.7H2O, 0.009 g; MnSO4.H2O, 0.002 g; CoCl2.6H2O, 0.0006 g; CuSO4.5H2O, 0.0006 g; Na2MoSO4.2H2O, 0.008 g; CaCl2.2H2O, 0.009 g; (NH4)2Fe(SO4)6.6H2O, 0.006 g; H3BO3, 0.002 g; D-biotin, 0.00024 g; D-L-pantothenic acid, 0.005 g; nicotinic acid, 0.005 g; myo-inositol, 0.125 g; thiamin, 0.005 g; pyridoxin, 0.005 g; para-aminobenzoic acid, 0.001 g.
Chemostat cultivations withS.cerevisiaeCA10/pCD63 Chemostat cultures with glucose as the sole carbon source and with glucose plus oleate were performed as described by Feria-Gervasioet al. [19]. The dilution rate was set at 0.18 h-1 for S. cerevisiae CA10/pCD63 to maintain the cells under pure oxidative metabolism. The bioreactors were fed with the mineral medium supplemented with glucose at 38 g L−1for glucose chemostat and 39 g L−1for glucose-oleate chemostat. This glucose-oleate chemostat was also fed with a 720 g L−1oleic acid solution at a dilu-tion rate of 0.0041 h-1.
Accelerostat cultivations withS.cerevisiaeCEN.PK 113-7D The accelerostat (A-stat) technique consisted of a computer-controled continuous cultivation procedure with a smooth change of the dilution rate [47]. Acce-lerostat cultures were performed with the CEN.PK 113-7D strain in the same conditions as for chemostat cultures, with a glucose concentration of 37 g L-1for glucose A-stat and 38 g L-1for glucose-oleate A-stat. The A-stats were launched when chemostat steady state cultures were stabi-lized at D0= 0.16 h-1by increasing linearly the dilution rate with a constant acceleration rate of α = 0.005 h-2, where Dtchanged with time as follow:
Dt¼D0þαt
Where: Dtis the dilution rate for the instant “t”; D0 represents the initial dilution rate;αis the constant ac-celeration rate fixed and t the time in hours.
Batch cultivations withS.cerevisiaeCEN.PK 113-7D Batch cultures were performed in a 5 L bioreactor B DCU B.Braun with a working volume of 3 L, managed with the MFCS/win 2.0 software. Temperature was regulated at 30°C and pH at 5.0 by addition of 1 M NaOH. Air flow and stirring rate were adjusted to maintain fully aerobic condition, i.e. a dissolved oxygen concentration above 20% of saturation. Initial glucose concentration was 40 g L-1, supplemented with oleic acid at 30 g L-1for BGOCGO. In-oculation was carried out withS.cerevisiaeCEN.PK 113-7D cells harvested at steady state in a glucose-limited chemostat at D = 0.16 h-1 for BGCG, or in a glucose-limited chemostat at D = 0.16 h-1 with oleate as co-substrate at D = 0.0073 h-1for BGCGOand BGOCGO[19] (Table 2).
VHEP fed-batch cultivations withS.cerevisiaeCEN.PK 113-7D
Fed-batch cultures were performed in a 5 L bioreactor B DCU B.Braun with a working volume of 3 L, managed with the MFCS/win 2.0 software. Temperature was regulated at 30°C and pH at 4.0 by addition of 14% (v/v) NH3solution. Air flow and stirring rate were adjusted to maintain fully aerobic condition, i.e. a dissolved oxygen concentration above 20% of saturation. Initial glucose concentration was 100 g L-1for all experiments, supplemented with oleic acid at 50 g L-1for the glucose-oleate fed-batch. When glucose concentration reached 20 g L-1in the bioreactor, pulses of a 700 g L-1glucose solution was achieved to reach 100 g L-1. At the later phase of cultivation, i.e. when ethanol concen-tration was above 90 g L-1, the targeted glucose fed con-centration was 50 g L-1. For glucose-oleate fed-batch (FBGOCGO), oleic acid feeding strategy was also performed to maintain the 50 g L-1. Inoculation was done from YPD plate ofS.cerevisiaeCEN.PK 113-7D. Three steps of propa-gation were carried out (5 mL, 30 mL and 300 mL) to in-oculate the fed-batch cultures. Each preculture was grown for 10 hours at 30°C, 100 rpm and was used to inoculate the next-step at 10% (v/v) ratio. For glucose-oleate fed-batch cultivation, cells were firstly adapted to oleic acid by a growth phase in the bioreactor on 10 g L-1 trehalose, supplemented with 50 g L-1of oleic acid. This strategy was carried out in order to mimic oxidative chemostat culture on glucose-oleate [48]. When trehalose was fully consumed, glucose was feed to reach 100 g L-1 and the culture was done as described above. Ethanol assessment was done as described by Pagliardini et al. [31] and taken into account for further calculations.
Off-gas analysis
Inlet and outlet gases compositions were analyzed by mass spectrometry. For chemostats and A-stats, analyses
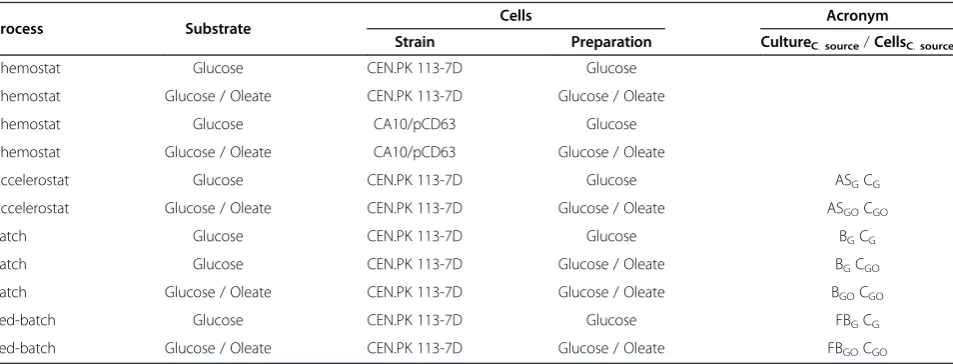
Table 2 Summary of the different experiments carried out in the present study
Process Substrate Cells Acronym Strain Preparation CultureC.source/CellsC.source Chemostat Glucose CEN.PK 113-7D Glucose
Chemostat Glucose / Oleate CEN.PK 113-7D Glucose / Oleate
Chemostat Glucose CA10/pCD63 Glucose
Chemostat Glucose / Oleate CA10/pCD63 Glucose / Oleate
Accelerostat Glucose CEN.PK 113-7D Glucose ASGCG
Accelerostat Glucose / Oleate CEN.PK 113-7D Glucose / Oleate ASGOCGO
Batch Glucose CEN.PK 113-7D Glucose BGCG
Batch Glucose CEN.PK 113-7D Glucose / Oleate BGCGO
Batch Glucose / Oleate CEN.PK 113-7D Glucose / Oleate BGOCGO
Fed-batch Glucose CEN.PK 113-7D Glucose FBGCG
Fed-batch Glucose / Oleate CEN.PK 113-7D Glucose / Oleate FBGOCGO
were performed every 5 min during the steady state, every 45 s during A-stats acceleration and every 5 s dur-ing the pulse dynamic with a PRIMA 600s (VG gas, Manchester, UK). For batches and fed-batches, analyses were performed every 5 min with a Proline Dycor (Ametek Process Instrument, Berwyn, USA). Aeration started 1 hour after inoculation to avoid CO2stripping from the medium and then prevent lag phase. CO2 pro-duction rate and O2 consumption rate were calculated as described by Poilpre et al. [49] for chemostats, A-stats and batches, and considering the liquid and gas volume evolution, the inlet airflow, the temperature and the pressure. The Respiratory Quotient (RQ) was given by the molar ratio between rCO2and rO2.
Determination of biomass
In order to conduct experiments, spectrophotometric measurements at 620 nm were performed with spectro-photometers Hitachi U- 1100 (Hitachi High Technologies America Inc., Schaumburg, USA) or Libra S4 (Biochrom, Cambridge, UK) after a calibration against cell dry weight measurements to evaluate yeast growth. For cell dry weight determination, culture medium was harvested and filtrated on 0.45 μm pore-size polyamide membranes (Sartorius AG, Göttingen, Germany), which were then dried to a constant weight at 60°C under partial vacuum (200 mmHg, i.e. approximately 26.7 kPa). In presence of oleic acid, 500 μl of culture medium were mixed with 500μl of iso-propanol to eliminate oleic acid. The mix-ture was vortexed for 1 min and centrifuged for 3 min at 12.000×g. The pellet was resuspended in 500 μl of water for spectrophotometric measurements. For cell dry weight determination, membranes were washed after filtration with hexane and water to eliminate oleic acid. It was previously checked that iso-propanol and hexane did not damage the cells.
Determination of cell viability
A cell coloration with the methylene blue method [50] was used as previously described to determine cells via-bility [46]. In presence of oleate, cell suspension was pre-pared as described above before staining procedure.
Metabolites analysis
Sampling for metabolite analysis was performed by sam-pling the broth from bioreactors directly through a ster-ile 0.45 μm pore-size polyamide membranes (Sartorius AG, Göttingen, Germany). The permeate was then either directly analyzed (chemostats and A-stats) or frozen at−20°C for further analyses (batches and fed-batches).
In order to conduct experiments, glucose concentra-tion was analyzed by enzymatic method with an YSI analyser model 27 A (YSI Life Science, Yellow Springs, USA). The accurate determination of glucose, ethanol,
glycerol and organic acids from the permeate was performed by high-performance liquid chromatography (HPLC) as described by Alfenoreet al. [46]. For chemo-stats and A-chemo-stats, the concentrations of ethanol and acetic acid were determined by gas chromatography as described by Feria-Gervasioet al. [19].
Oleic acid concentration determination was performed by two methods on the filtered supernatant obtained after iso-propanol washing and centrifugation. On the first hand, supernatant was directly injected in a HPLC using a 250*4.6 mm C18 column (Interchim, Montluçon, France). Column temperature was set at 50°C and a 3% (v/v) acetic acid in methanol solution was used as carrier with a flow rate of 1 ml min-1. Detection was done with a refractometer. On a second hand, supernatant was processed with a 0.2 mol L-1 trimethylsulphonium hy-droxide in methanol solution in order to turn fatty acids into volatile molecule by methylation of their carboxilic function. Then sample was analyzed by gas chromatog-raphy using a 50 m*0.25 mm CP-Select CB for FAME fused silica WCOT (Varian, Palo Alto, USA). Injector temperature was set at 140°C and column temperature was initially set at 50°C, then be increased to 240°C with the following profile: 8°C min-1for 3 min; 13°C min-1for 5 min; 1.5°C min-1for 27 min; 5°C min-1for 12 min and a final isotherm of 10 min. Nitrogen gas was used as car-rier with a flow rate of 50 ml.min-1 and detection was done by a FID set at 250°C.
Competing interests
The authors declare that they have no competing interests.
Authors’contributions
JM, DFG and JRM worked equally on this project and should be considered all three as first authors. JM, DFG, JRM and SG contributed to the cell cultures experiments SG conceived of the study, and participated in its design and coordination and helped to draft the manuscript. All authors read and approved the final manuscript.
Acknowledgment
This work was partly supported by Sanofi Aventis (French), which provided the strain CA10/pCD63 and partly carried out under the project Futurol. Authors thank OSEO Innovation for its participation in the project Futurol funding, and C.O.N.A.C.Y.T. (Mexico) for financial doctoral support of Mr. Feria-Gervasio.
Received: 19 July 2013 Accepted: 4 September 2013 Published: 23 September 2013
References
1. Crabtree HG:Observations on the carbohydrate metabolism of tumours.
Biochem J1929,23:536–545.
2. De Deken RH:The Crabtree effect: a regulatory system in yeast.J Gen Microbiol1966,44:149–156.
3. Fiechter A, Fuhrmann GF, Käppeli O:Regulation of glucose metabolism in growing yeast cells.Adv Microb Physiol1981,22:123–183.
4. Petrik M, Käppeli O, Fiechter A:An expanded concept for the glucose effect in the yeast Saccharomyces uvarum : involvement of short- and long-term regulation.J Gen Microbiol1983,129:43–49.
5. Beck C, von Meyenburg HK:Enzyme pattern and aerobic growth of Saccharomyces cerevisiae under various degrees of glucose limitation.
6. Käppeli O, Sonnleitner B:Regulation od sugar metabolism in Saccharomyces cerevisiae-type yeast: experimental and conceptual considerations.Crit Rev Biotechnol1986,4:299–325.
7. Van Urk H, Schipper D, Breedveld GJ, Mak PR, Scheffers WA, van Dijken JP: Localization and kinetics of pyruvate-metabolizing enzymes in relation to aerobic alcoholic fermentation in Saccharomyces cerevisiae CBS 8066 and Candida utilis CBS 621.Biochim Biophys Acta1989,992:78–86. 8. Verduyn C, Postma E, Scheffers WA, Van Dijken JP:Effect of benzoic acid on
metabolic fluxes in yeasts: a continuous-culture study on the regulation of respiration and alcoholic fermentation.Yeast1992,8:501–517. 9. Flikweert M, van der Zanden L, Janssen WMTM, Yde SH, van Dijken JP,
Pronk J:Pyruvate decarboxylase: an indispensable enzyme for growth of Saccharomyces cerevisiae on glucose.Yeast1996,12:247–257. 10. Meaden PG, Dickinson FM, Mifsud A, Tessier W, Westwater J, Bussey H,
Midgley M:The ALD6 gene of Saccharomyces cerevisiae encodes a cytosolic, Mg(2+)-activated acetaldehyde dehydrogenase.
Yeast1997,13:1319–1327.
11. De Jong-Gubbels P, Van Den Berg MA, Luttik MA, Steensma HY, Van Dijken JP, Pronk JT:Overproduction of acetyl-coenzyme A synthetase isoenzymes in respiring Saccharomyces cerevisiae cells does not reduce acetate production after exposure to glucose excess.FEMS Microbiol Lett 1998,165:15–20.
12. Van Hoek P, Flikweert MT, van der Aart QJ, Steensma HY, van Dijken JP, Pronk JT:Effects of pyruvate decarboxylase overproduction on flux distribution at the pyruvate branch point in Saccharomyces cerevisiae.
Appl Environ Microbiol1998,64:2133–2140.
13. Remize F, Andrieu E, Dequin S:Engineering of the pyruvate
dehydrogenase bypass in Saccharomyces cerevisiae: role of the cytosolic Mg(2+) and mitochondrial K(+) acetaldehyde dehydrogenases Ald6p and Ald4p in acetate formation during alcoholic fermentation.
Appl Environ Microbiol2000,66:3151–3159.
14. Saint-Prix F, Bönquist L, Dequin S:Functional analysis of the ALD gene family of Saccharomyces cerevisiae during anaerobic growth on glucose: the NADP+−dependent Ald6p and Ald5p isoforms play a major role in acetate formation.Microbiology2004,150:2209–2220.
15. De Jong-Gubbels P, Bauer J, Niederberger P, Stückrath I, Kötter P, van Dijken JP, Pronk JT:Physiological characterisation of a pyruvate-carboxylase-negative Saccharomyces cerevisiae mutant in batch and chemostat cultures.
Antonie Van Leeuwenhoek1992,74:253–263.
16. Klein CJ, Rasmussen JJ, Rønnow B, Olsson L, Nielsen J:Investigation of the impact of MIG1 and MIG2 on the physiology of Saccharomyces cerevisiae.J Biotechnol1999,68:197–212.
17. Van Maris AJ, Bakker BM, Brandt M, Boorsma A, Teixeira de Mattos MJ, Grivell LA, Pronk JT, Blom J:Modulating the distribution of fluxes among respiration and fermentation by overexpression of HAP4 in
Saccharomyces cerevisiae.FEMS Yeast Res2001,1:139–149.
18. Vemuri GN, Eiteman MA, McEwen JE, Olsson L, Nielsen J:Increasing NADH oxidation reduces overflow metabolism in Saccharomyces cerevisiae.
Proc Natl Acad Sci USA2007,104:2402–2407.
19. Feria-Gervasio D, Mouret J-R, Gorret N, Goma G, Guillouet SE:Oleic acid delays and modulates the transition from respiratory to fermentative metabolism in Saccharomyces cerevisiae after exposure to glucose excess.Appl Microbiol Biotechnol2008,78:319–331.
20. Van Roermund CWT, Elgersma Y, Singh N, Wanders RJA, Tabak HF:The membrane of peroxisomes in Saccharomyces cerevisiae is impermeable to NAD(H) and acetyl-CoA under in vivo conditions.EMBO J
1995,14:3480–3486.
21. Kal AJ, Van Zonneveld AJ, Benes V, Van Den Berg M, Koerkamp MG, Albermann K, Strack N, Ruijter JM, Richter A, Dujon B, Ansorge W, Tabak HF: Dynamics of gene expression revealed by comparison of serial analysis of gene expression different carbon sources.Mol Biol Cell1999, 10(June):1859–1872.
22. Casalone E, Barberio C, Cavalieri D, Polsinelli M:Identification by functional analysis of the gene encoding a-isopropylmalate synthase II ( LEU9) in Saccharomyces cerevisiae.Yeast2000,16:539–545.
23. Van Roermund CWT, Waterham HR, Ijlst L, Wanders RJA:Fatty acid metabolism in Saccharomyces cerevisiae.Cell Mol Life Sci2003,60:1838–1851.
24. Chen Y, Siewers V, Nielsen J:Profiling of cytosolic and peroxisomal acetyl-CoA metabolism in Saccharomyces cerevisiae.PLoS One2012,7:e42475. 25. Moreira dos Santos M, Raghevendran V, Kötter P, Olsson L, Nielsen J:
Manipulation of malic enzyme in Saccharomyces cerevisiae for
increasing NADPH production capacity aerobically in different cellular compartments.Metab Eng2004,6:352–363.
26. Camarasa C, Grivet J-P, Dequin S:Investigation by 13C-NMR and tricarboxylic acid (TCA) deletion mutant analysis of pathways for succinate formation in Saccharomyces cerevisiae during anaerobic fermentation.Microbiology2003,149:2669–2678.
27. Jones RP, Greenfield PF:Effect of carbon dioxide on yeast growth and fermentation.Enzyme Microb Technol1982,4:210–223.
28. Ansell R, Granath K, Hohmann S, Thevelein JM, Adler L:The two isoenzymes for yeast NAD+−dependent glycerol 3-phosphate dehydrogenase encoded by GPD1 and GPD2 have distinct roles in osmoadaptation and redox regulation.EMBO J1997,16:2179–2187. 29. Alfenore S, Cameleyre X, Benbadis L, Bideaux C, Uribelarrea J-L, Goma G,
Molina-Jouve C, Guillouet SE:Aeration strategy: a need for very high ethanol performance in Saccharomyces cerevisiae fed-batch process.
Appl Microbiol Biotechnol2004,63:537–542.
30. Bideaux C, Alfenore S, Cameleyre X, Molina-jouve C, Uribelarrea J, Guillouet E: Minimization of glycerol production during the high-performance fed-batch ethanolic fermentation process in Saccharomyces cerevisiae, using a metabolic model as a prediction tool.Appl Environ Microbiol2006,72:2134–2140. 31. Pagliardini J, Hubmann G, Bideaux C, Alfenore S, Nevoigt E, Guillouet SE:
Quantitative evaluation of yeast’s requirement for glycerol formation in very high ethanol performance fed-batch process.Microb Cell Fact2010,9:36. 32. Van Hoek PIM, van Dijken JP, Pronk JT:Effect of specific growth rate on
fermentative capacity of baker’s yeast.Appl Environ Microbiol1998,64:4226–4233. 33. Rieger M, Käppeli O, Fiechter A:The role of limited respiration in the
incomplete oxidation of glucose by Saccharomyces cevevisiae.J Gen Microbiol1983,129:653–661.
34. Verduyn C, Zomerdijk TPL, Dijken JP, Scheffers WA:Continuous measurement of ethanol production by aerobic yeast suspensions with an enzyme electrode.Appl Microbiol Biotechnol1984,19:181–185. 35. Van Urk H, Mark PR, Scheffers WA, van Dijken JP:Metabolic responses of
Saccharomyces cerevisiae CBS 8066 and Candida utilis CBS 621 upon transition from glucose limitation to glucose excess.Yeast1988,4:283–291. 36. Chen SL, Chiger M:Production of Baker’s Yeast, Comprehensive Biotechnology,
Vol. 3.Oxford: Pergamon P; 1985:429–455.
37. Kristiansen B:Integrated Design of a Fermentation Plant: The Production of Baker’s Yeast.New-York: Weinheim; 1994.
38. Reed G, Nagodawithana W:Yeast Technology.2nd edition. Michigan University: Van Nostrand Reinhold; 1991. 261–313 and 315–368. 39. Bylund F, Collet E, Enfors S-O, Larsson G:Substrate gradient formation in
the large-scale bioreactor lowers cell yield and increases by-product formation.Bioprocess Eng1998,18:171–180.
40. Bylund F, Guillard F, Enfors S-O, Trägårdh C, Larsson G:Scale down of recombinant protein production: a comparative study of scaling performance.Bioprocess Eng1999,20:377.
41. Vrabel P, van der Lans R, Cui Y, Luyben K:Compartment model approach: Mixing in large scale aerated reactors with multiple impellers.Chem Eng Res Des1999,77:291–302.
42. Enfors SO, Jahic M, Rozkov A, Xu B, Hecker M, Jürgen B, Krüger E, Schweder T, Hamer G, O’Beirne D, Noisommit-Rizzi N, Reuss M, Boone L, Hewitt C, McFarlane C, Nienow A, Kovacs T, Trägårdh C, Fuchs L, Revstedt J, Friberg PC, Hjertager B, Blomsten G, Skogman H, Hjort S, Hoeks F, Lin HY, Neubauer P, van der Lans R, Luyben K,et al:Physiological responses to mixing in large scale bioreactors.J Biotechnol2001,85:175–185.
43. Lara AR, Taymaz-Nikerel H, Mashego MR, Van Gulik WM, Heijnen JJ, Ramírez OT, Van Winden WA:Fast dynamic response of the fermentative metabolism of Escherichia coli to aerobic and anaerobic glucose pulses.Biotechnol Bioeng 2009,104:153–161.
44. Van Dijken J, Bauer J, Brambilla L, Duboc P, Francois J, Gancedo C, Giuseppin M, Heijnen J, Hoare M, Lange H, Madden E, Niederberger P, Nielsen J, Parrou J, Petit T, Porro D, Reuss M, van Riel N, Rizzi M, Steensma H, Verrips C, Vindeløv J, Pronk J: An interlaboratory comparison of physiological and genetic properties of four Saccharomyces cerevisiae strains.Enzyme Microb Technol2000,26:706–714. 45. Duport C, Spagnoli R, Degryse E, Pompon D:Self-sufficient biosynthesis of
pregnenolone and progesterone in engineered yeast.Nat Biotechnol 1998,16:186–189.
47. Paalme T, Kahru A, Elken R, Vanatalu K, Tiisma K, Raivo V:The
computer-controlled continuous culture of Escherichia coli with smooth change of dilution rate ( A-stat ).J Microbiol Methods1995,24:145–153. 48. Mouret JR, Jacobsen JN, Guillouet SE:Kinetic analysis of a
trehalase-overexpressing strain grown on trehalose: a new tool for respiro-fermentative transition studies in Saccharomyces cerevisiae.
Lett Appl Microbiol2006,42:363–368.
49. Poilpre E, Tronquit D, Goma G, Guillou V:On-line estimation of biomass concentration during transient growth on yeast chemostat culture using light reflectance.Biotechnol Lett2002,24:2075–2081.
50. Postgate J:Viable counts and viability.InMethods in Microbiology. Edited by Norris J, Ribbons D. New York: Academic Press; 1967:611–628.
doi:10.1186/1475-2859-12-83
Cite this article as:Marcet al.:Impact of oleic acid as co-substrate of glucose on“short”and“long-term”Crabtree effect inSaccharomyces cerevisiae.Microbial Cell Factories201312:83.
Submit your next manuscript to BioMed Central and take full advantage of:
• Convenient online submission
• Thorough peer review
• No space constraints or color figure charges
• Immediate publication on acceptance
• Inclusion in PubMed, CAS, Scopus and Google Scholar
• Research which is freely available for redistribution