P R O C E E D I N G S
Open Access
Protein surface representation and analysis by
dimension reduction
Heng Yang, Rehman Qureshi, Ahmet Sacan
*From
IEEE International Conference on Bioinformatics and Biomedicine 2011
Atlanta, GA, USA. 12-15 November 2011
Abstract
Background:Protein structures are better conserved than protein sequences, and consequently more functional information is available in structures than in sequences. However, proteins generally interact with other proteins and molecules via their surface regions and a backbone-only analysis of protein structures may miss many of the functional and evolutionary features. Surface information can help better elucidate proteins’functions and their interactions with other proteins. Computational analysis and comparison of protein surfaces is an important challenge to overcome to enable efficient and accurate functional characterization of proteins.
Methods:In this study we present a new method for representation and comparison of protein surface features. Our method is based on mapping the 3-D protein surfaces onto 2-D maps using various dimension reduction methods. We have proposed area and neighbor based metrics in order to evaluate the accuracy of this surface representation. In order to capture functionally relevant information, we encode geometric and biochemical features of the protein, such as hydrophobicity, electrostatic potential, and curvature, into separate color channels in the 2-D map. The resulting images can then be compared using efficient 2-D image registration methods to identify surface regions and features shared by proteins.
Results:We demonstrate the utility of our method and characterize its performance using both synthetic and real data. Among the dimension reduction methods investigated, SNE, LandmarkIsomap, Isomap, and Sammon’s mapping provide the best performance in preserving the area and neighborhood properties of the original 3-D surface. The enriched 2-D representation is shown to be useful in characterizing the functional site of chymotrypsin and able to detect structural similarities in heat shock proteins. A texture mapping using the 2-D representation is also proposed as an interesting application to structure visualization.
Background
The advent of new technologies has resulted in a mas-sive expansion of the protein sequence and structure databases. This enables the characterization of the simi-larities of sequences and structures and identification of the location of functional sites. High throughput sequencing data analysis has opened up new applica-tions and facilitated the study of proteins. The align-ment of protein sequences and structures has been able to investigate convergent and divergent protein
relationships; this has been facilitated by the exponen-tially increasing size of the available data. Traditionally, sequence analysis has been largely based on pairwise and multiple sequence alignments, which are algorithmi-cally based on dynamic programming [1,2]. Heuristic approaches have been proposed to speed up the align-ment against large sequence databases [3,4].
Unlike protein sequences, protein structure analysis has not yet enjoyed a widely accepted comparison or search method. The Protein Databank (PDB) is a reposi-tory of 3-D protein and nucleic acids structures [5]. As of February 2012, there are nearly 80,000 protein struc-tures available in the PDB. The increasing availability of this data brings computational challenges as well as * Correspondence: ahmet.sacan@drexel.edu
Center for Integrated Bioinformatics, School of Biomedical Engineering, Science and Health System, Drexel University, 3120 Market Street, Philadelphia, PA 19104, USA
opportunities. In order to make effective use of this data, there is a growing need for more sensitive and automated comparison, search, and analysis tools for protein structures.
Unlike sequence alignment, structure alignment cap-tures information not detectable in a protein’s sequence due to the nature of protein folding: two amino acids that are far away from each other in a protein sequence may be brought close together when the protein folds. Although three dimensional protein structures are determined by primary sequences, even large sequence variations (due to mutation) usually only cause minor and unimportant structural variations. Thus, evolution-ary relationships are best detected at the structural level. The computation of protein structure alignment is a computationally hard problem, due to the number of possible combinations of residue associations that can be used to generate corresponding translation and rota-tion matrices, and it is usually solved by heuristic approaches [5-9]. Despite active research and the avail-ability of a growing number of methods, there is no widely accepted 3-D residue-based structural alignment
method. Furthermore, most of the existing structural alignment methods focus only on the backbone chain to decrease the computational burden. However, this sim-plification causes the loss of important information con-tained on the surface.
Protein structure uncovers more distant evolutionary relationships than protein sequence. However, we can-not neglect the fact that two different proteins’surface characteristics may converge through evolution and result in similar functions [6]. Two proteins might have different backbones and different overall 3-D structures, and still possess highly similar surface regions, giving them the ability to catalyze chemically equivalent reac-tions on similar substrates [7] (see Figure 1 for an illus-tration). Proteins that meet these conditions are likely experiencing convergent or divergent evolution. In the case of divergent evolution, two protein sequences or structures can mutate over time, but the surface charac-teristics must be conserved in order to maintain the specific function. In the case of convergent evolution, proteins with similar functions but different structures can evolve similar surface characteristics, causing
homologous proteins to share similar active or binding sites [8,9]. The conservation of similar local sites on protein surfaces may not be detected by sequence or structure comparison, but the surface determinants can determine the common functionality, making surface based methods invaluable for protein functional annotation.
In addition to advancing the general body of func-tional knowledge for proteins, protein surfaces can also play a role in rational drug design. The analysis of pro-tein surfaces could identify propro-tein binding pockets so that the requirements for a given pharmaceutical com-pound’s size and binding orientation can be determined [10]. Furthermore, knowledge of the protein conforma-tion can help researchers develop specific pharmaceuti-cals for a given disease. This analysis can also assist in the investigation of protein-protein interactions and give researchers insight into the biological processes of the cell. For example, signal transduction is carried out by a cascade of protein-protein interactions, involving multi-peptide complexes that associate by surface complemen-tarity. Moreover, the ligand binding sites act as a signal trigger that is usually located in the protein surface pockets. Once, the ligand binds to the protein’s active site, it alters the protein’s 3-D structure and thus trig-gers a certain response.
In this paper, we introduce a new method for the ana-lysis and comparison of protein surfaces. We utilize a two dimensional representation that enables efficient computational storage and comparison. The reduced representation is optimized using dimension reduction methods, such that the geometric relationship of the atoms in 3-D is preserved in the 2-D representation. We demonstrate that this reduced representation captures biologically important information by characterizing an enriched 2-D map of a chymotrypsin protein and by comparing enriched image representations of heat shock proteins.
Methods
First, we consider the problem of map generation as an error minimization problem, and utilize dimension reduction methods to perform this mapping. While the accuracy of earlier studies is limited by how close the shape of protein is to a sphere or ellipse, our approach attempts to address more complex shapes, as are pre-sent in almost all proteins. Secondly, we enrich the sur-face map with bio-chemical and geometrical properties, such as electrostatic potential, hydrophobicity and cur-vature, in order to facilitate functional analysis. While other surface features can also be mapped in a similar fashion as the method described here, we leave an exhaustive feature mapping to a future endeavor. Image registration is then applied on these feature-enriched
images. Thirdly, we utilize the 3D-2D mapping to per-form texture-mapping of arbitrary images back on the 3-D surface, to complement the existing graphical visua-lization options.
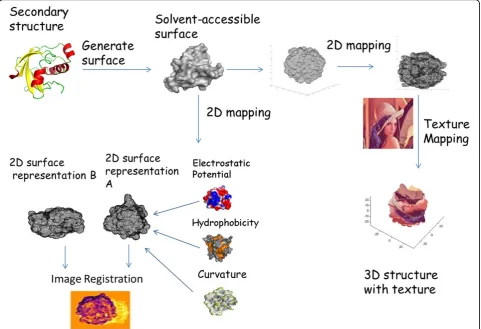
Figure 2 shows a flow chart describing the workflow of the project. The atomic coordinates are extracted from the PDB file, and the solvent excluded surface is calculated [11]. We generated the 3-D surface using the MSMS program developed by Sanner [12], using a probe radius of 1.4 angstroms. The mapping of the 3-D surface points to a 2-D map is done using dimension reduction methods. After generation of this 2-D map, the workflow shows two directions; the first leading to feature-enrichment and comparison of proteins, and the seconds leading to texture-mapping for visualization purposes. In the former, the electrostatic potential, hydrophobicity and surface curvature are calculated and enriched onto the 2-D surface. Image registration is then used to maximally align the two surfaces to find the similarities. In the latter direction, texture mapping is applied to superimpose an arbitrary template image onto the 2-D surface. Each point on the 2-D surface is assigned the pixel value found where the point and pixel overlapped. The color value of each point is assigned back onto the corresponding point in 3-D. Delaunay tri-angulation is applied to the surface points in order to obtain a triangulated mesh for the evaluation of 3-D to 2-D mapping methods. Delaunay triangulation is com-monly used to generate surface meshes from point clouds, the fundamental criterion of it is that the cir-cum-circle of each Delaunay triangle contains no other point in its interior [13].
Generation of the 3-D surface
A number of different representations have been devel-oped to describe the protein surface (See Figure 3). A classic representation is the solvent accessible surface, introduced by Lee and Richards [14]. The accessible sur-face can be determined by simulating a probe “rolling” on the surface. The path traced out by the center of the probe forms the solvent accessible surface.
Connolly developed a numerical algorithm to calculate the 3-D protein contour based on solvent-accessible sur-face method [11]. Later a sursur-face triangulation method was developed by Connolly [15] which is based on sub-dividing the curved faces of an analytical molecular sur-face representation.
surface. In the present study, we utilize this surface representation of the proteins.
Starting from Connolly’s work, numerous methods have been proposed for surface representation, Sanner [17] introduced the idea of r-reduced surface and devel-oped an efficient algorithm to compute the outer com-ponents of the surface. The molecular surface of a heat shock protein using Sanner’s implementation is shown in Figure 4 as a triangulated surface. Staib [18] devel-oped a mathematical surface representation by expan-sions of spherical harmonic functions, which can be used in analyzing surface curvatures, surface interaction, and surface visualization. While we have utilized the sol-vent excluded representation in this study, the approach introduced here can be extended to these other surface representations.
Protein surfaces generated by these methods have found use in a variety of visualization and analysis appli-cations. Almost all popular macromolecular visualization
programs now contain routines for the generation and visualization of different types of surface representations [19,20].
The difficulty of dealing with surfaces is apparent, in comparison to the more widely utilized primary sequence or backbone conformation, which possess numerous alignment methods. Due to the complexity of the surfaces and the lack of established methods for general-purpose analysis, most studies have focused on certain surface features, such as active or functional sites and structural motifs [21]. These sites are identified only around a local spatial proximity or surface patch and involve only a few highly conserved amino acids [22].
Approaches that have attempted to represent and ana-lyze the entire surface have been geared toward extract-ing generic shape parameters that are not amenable to detailed characterization of surfaces. 3-D Spherical har-monics and Zernike descriptors have been used as
feature vectors for protein structure comparison and similarity-based retrieval [23]. Geometric hashing has also been used for translation and rotation invariant comparison of sets of atoms [24]. Poirette [25] has used
the genetic algorithm to compare two protein surfaces by searching for a translation and rotation matrix that brings the two surfaces together, maximizing the surface overlap.
Figure 3Illustration of different protein surface definitions: A van der Waals surface (cyan) is obtained by taking the union of the spherical atom surfaces defined by the van der Waals radius of each atom. Solvent accessible surface (pink) is defined by the path traced by the center of a probe (yellow) that is rolled around the protein. Molecular surface (solvent-excluded surface) is the set of points traced by the inward-facing part of the probe.
Our approach to study the protein surfaces is based on finding an accurate representation of the protein sur-face in 2-D. Representing 3-D sursur-faces in 2-D is an old problem, most known in geography, where some terrain or the entire globe is shown on a map. This process has been coined“molecular cartography” for macromolecu-lar structures [26,27]. These early studies in molecumacromolecu-lar cartography have remained isolated and have not gained a sufficient following. With the current study, we hope to bring the power and appeal of molecular cartography back to the attention of the protein structural analysis community.
The studies by both Fanning et al. [26] and Pawlowski and Godzik [27] have borrowed ideas from cartography studies and have applied similar projections used therein. Fanning et al. [26] have generated a contour map of the surface, in order to preserve some of the topographic features of the irregular protein shapes. They have used Mercator-like projection and Mollweide projection in order to investigate whether topographic features can provide antigenic determinants. Pawlowski and Godzik [27] have used an equal area sinusoidal car-tographic projection (also known as the Mercator equal-area projection) as a simple surface representation to measure the map similarity of proteins.
Our approach is based on the method of representing the surface of a three dimensional object on several pla-nar grids. A dimension reduction method (DRM) is a geometric technique that maps higher dimensional data into a lower dimensional space while preserving some geometrical properties of the higher dimensional data, such as the variance or inter-point distances. There are many different dimension reduction methods, but they generally fall into three categories: linear methods, glo-bal nonlinear methods, and local nonlinear methods.
Principal Components Analysis (PCA) is one of the classic linear dimension reduction methods. It attempts to find a linear mapping between high dimensional and low dimensional data using the principal eigenvectors of the covariance matrix of data [28] PCA is able to reveal the internal structure of the data in a way that best cap-tures the data variance. However, since the principal eigenvectors rely mainly on the data dimensionality, PCA is not appropriate for reducing relatively high dimensional data or data that do not lie on a linear sub-space [29].
Multidimensional Scaling (MDS) is a global nonlinear dimension reduction method. MDS constructs a dissimi-larity matrix in high dimensional data points using Euclidean distance and tries to maintain the minimum distance errors. The stress function of choice is often Kruskal’s stress or Sammon’s stress measures [30]. Other global nonlinear methods that were investigated in this study include Stochastic Neighbor Embedding
(SNE) [31], Isomap [32], and Stochastic Proximity Embedding (SPE) [33]. Like MDS, SNE attempts to pre-serve pairwise distances between data points in low dimensions, but the distance measure and the cost func-tion are different from MDS, MDS measures the Eucli-dean distance between two points, while SNE measures their probability generated by the Gaussian kernel func-tion, and the Kullback-Leilbler divergences are utilized to measure the probability difference. SNE is found to be more advantageous in preserving the local properties of a manifold. T-distributed Stochastic Neighbor Embedding (tSNE) is a variation of SNE; it uses student-t disstudent-tribustudent-tion insstudent-tead of Gaussian as istudent-ts cosstudent-t funcstudent-tion, and is able to avoid the “crowding problem” that often appears in SNE [34]. Isomap uses the geodesic distances among the data points in the original space to address the“Swiss roll”problem [29].
Locally-Linear Embedding (LLE) involves finding the nearest neighbors of each point and then determining weights for each point in order to express the point as a linear combination of its neighbors[35]. The weights are a set describing how much each neighbor contributes to determining the location of the given point. LLE then uses the set of weights to place the point in a lower dimensional space. Thus, in lower dimensional space, any given point is still described by the same weight function. LLE can run more quickly than Isomap when it uses sparse matrix algorithms, but cannot handle non-uniform sample densities as well [29].
Evaluation of dimension reduction
of each point. In 2-D, the connectivity matrix is obtained using the Euclidean distance of the k-nearest neighbors of each point (we used k = 3). These connec-tivity matrices are then represented as linear bit vectors (with only 0 or 1 values) X and Y. The Tanimoto coeffi-cient [36] of two bit vectors X and Y is defined as fol-lows:
T(X, Y) = X ·Y
||X||2+||Y||2−X ·Y
The higher the Tanimoto coefficient, the better the method is at preserving the neighbors of the points.
Feature enrichment with geometric and biochemical properties
Dimension reduction provides a mapping on to the 2-D space, and implicitly captures only the geometric prop-erties of the original surface points. While the area and neighborhood properties of the points are preserved as much as possible under the constraints of the 2-D space, other geometric properties are mostly ignored. Note however, that we can enrich the mapped points with color channels representing additional information. Specifically, we associate a color channel for curvature information, thus capture additional 3-D geometric properties.
Even though geometric features of the protein surface are important functional determinants, the biochemical properties of the surface points are as important in determining binding interactions and enzymatic activity. We have investigated two biochemical features: electro-static potential and hydrophobicity. The electroelectro-static potential plays an important role in indicating molecular interactions and protein folding. We have used the Pois-son-Boltzman formulation to calculate the electrostatic potential at each surface point [37]. The hydrophobicity property has been one of the most used properties in studying protein structure and folding. For globular pro-teins, the hydrophobic side chains are usually buried inside the protein structure while the hydrophilic side chains are exposed to the water. We have utilized the Kyte-Doolittle hydrophobicity scale [38] to calculate the level of hydrophobicity of each surface point.
Image registration
There are many registration methods available, and they can be classified in different ways such as feature-based and intensity-based methods. Feature-based methods use the common features to find the correspondence between two images. These features can be based on points, curves, or surfaces, each with a corresponding distance metric to facilitate the identification of feature associations between two images. The feature-based
methods work well if the images contain salient pat-terns, such as corners or contours. Intensity-based methods rely on pixel intensities and have several differ-ent metrics, such as Normalized Cross Correlation of the pixel intensities, Mutual Information, and the Sum of Squared Differences [39].
Results
In order to evaluate our approach and characterize the performance of different methods and parameter choices, we used both synthetic and real data. The syn-thetic data consisted of an idealized sphere with 162 equi-distant points triangulated into 320 triangles. The real data consisted of 8198 surface points generated from protein 1kaz which were triangulated into 16160 triangles.
Mapping of an idealized spherical surface using PCA and sinusoidal cartography [27] is illustrated in Figure 5. Note that due the inherent property of an enclosed 3-D surface, it is not possible to equally maintain geometric relationship of all the surface points. Notably, the points in 2-D would have different local neighbors than they had in 3-D. In order to alleviate this problem, we sec-tion an enclosed surface and consider each sub-surface separately (See Figure 6). Both PCA and sinusoidal car-tography methods are able to better preserve the local geometric properties of the surface points being mapped.
In order to evaluate the performance of various dimension reduction methods, we mapped a triangu-lated hemisphere with equally distributed points. Table 1 shows the accuracy and time performance of each method. Isomap, SNE, LandmarkIsoMap, and Sammon had better area and neighbor scores than the other methods. Isomap had the best are score and second best neighbor score. Sammon had a slightly better neighbor score than Isomap. Among the top scoring methods, LandmarkIsomap had the best running time, followed by Sammon. Other faster methods did not have satisfac-tory area and neighbor scores. Table 1 also indicates that area score positively correlates with neighbor score, indicating that the failure of maintaining the same area is due to the triangle distortion in which the neighbor points have been moved away from each other. The exception to this was tSNE, which despite having a poor area score, had neighbor score comparable to the top scoring methods.
orthogonal planes of the coordinate system. The section with the positive Y coordinates was chosen for this experiment, and contained 8198 points and 16160 trian-gles. The performance of the dimension reduction methods on this section is summarized in Table 2.
As expected from the more complex structure of the protein, the dimension reduction methods result in lower area and neighbor scores compared to the simpler hemisphere experiment above. 18 of the methods have an area score between 0.66 and 0.70. Among these, SNE, Isomap, and LandmarkIsomap have a neighbor score better than 0.23. The protein surface contained 50 times more points than the hemisphere, which signifi-cantly increased the running time for most of the methods.
A visual inspection of the 2-D surface maps confirmed that the methods SNE, Isomap, LandmarkIsomap, and Sammon produced comparable maps that were superior to those generated by other methods (results not shown). We have used the 2-D maps produced by Sam-mon mapping for the downstream analysis described below. In order to evaluate the ability of our 2-D repre-sentation to capture the biologically important informa-tion, we conducted an experiment on a bacterial chymotrypsin (PDB ID: 2ea3) [41] Chymotrypsin is a serine protease in and has a well-characterized active site containing a catalytic triad. The section of the chy-motrypsin with positive Z coordinates is used here, since that is section containing the active site. Figure 7 shows the surface of the chymotrypsin as a point cloud,
Figure 5Complete enclosed sphere and its 2D mappings: An enclosed spherical surface (left) is mapped using PCA (middle) and using sinusoidal cartography (right). The PCA method causes a collapse of the sphere in 2-D and cannot preserve the neighborhood relationship of the surface points. Sinusoidal cartography avoids this problem to some extent (except for the points at the boundaries of the 2-D map), but is not able to preserve the area information of the 3-D surface polygons.
color coded by the hydrophobic and hydrophilic regions in a gradient from orange to gray, respectively. The active site is highlighted in red. The 2-D surface map-ping resulting from the Sammon method is shown on the right, with the mapped points colored in the same color value that they had in 3-D. It can be observed that the regions with distinct hydrophobicity are preserved in the 2-D map. Additionally, the points on the active site maintain their spatial relationship in the mapping. The active site can be seen to reside in a hydrophobic region, surrounded by hydrophilic atoms.
In order to evaluate whether the 2-D representation of protein surfaces can be used for surface compari-son, we conducted an experiment with two heat shock proteins (PDB IDs: 1bup[42] and 1kaz[40]). These proteins share a high sequence similarity (99% iden-tity) and were chosen to simplify the visual inspection of their surfaces. Each protein is bisected by the x, y or z coordinate planes, resulting in six unique sections for each protein. In the examples below, only the posi-tive Y coordinate sections are shown. Sammon Map-ping is performed on the sections obtained from the two proteins. The proteins were then enriched with
electrostatic potential, hydrophobicity and curvature information. The active site residues are obtained from the Catalytic Site Atlas [43,44] and mapped and highlighted onto the enriched surfaces, shown in Fig-ure 8.
The hydrophobicity map reveals that the active site lies on a blue hydrophobic belt-shaped area. The elec-trostatic potential image shows the active site to lie in a red region of negative charge, and the curvature image shows it to be a concave valley enclosed by a bulged “mountain” structure. These observations conform to the relevant theory and also prove the accuracy of the feature enrichment as a descriptive guide for characteri-zation of the active site.
Once the hydrophobicity, electrostatic potential and curvature models are generated, two (or more) protein surfaces can be compared. Note that the proteins are likely to be in different spatial orientations in the model database, thus an image registration needs to be per-formed to reorient and superpose them before similari-ties can be highlighted. We have left an investigation of automated image registration methods for a future study Table 1 Performance of dimension reduction methods for
mapping a triangulated hemisphere
Methods Area Neighbor Runtime (sec)
PCA 0.28 0.46 0.002
LLE 0.28 0.47 0.03
Laplacian 0.11 0.29 0.02
LLC -0.01 0.02 1.16
AutoEncoderEA 0.01 0.11 2.83
SNE 0.72 0.53 6.81
SymSNE 0.03 0.01 6.75
CFA 0.27 0.12 4.36
GPLVM 0.28 0.46 0.3
NPE 0.28 0.47 0.03
LPP -0.007 0.17 0.004
LLTSA 0.28 0.46 0.029
NCA 0.28 0.09 3.1
MCML 0.28 0.46 0.79
LDA 0.28 0.37 0.005
FactorAnalysis 0.24 0.21 0.004
tSNE 0.16 0.53 0.61
Isomap 0.81 0.53 0.29
LandmarkIsomap 0.69 0.53 0.06
ProbPCA 0.28 0.48 0.11
KernelPCA 0.04 0.23 0.007
MDS 0.28 0.46 0.004
DiffusionMaps 0.3 0.48 0.006
Sammon 0.73 0.54 0.1
Sinusoidalcartography 0.10 0.45 0.003
For each performance criteria, the top comparable scores are shown in bold. knn = 3 was used for the neighbor scoring.
Table 2 Performance of dimension reduction methods for mapping a section of the heat shock protein ATPase domain
Methods Area Neighbor Runtime (sec)
PCA 0.69 0.17 0.002
LLE 0.66 0.13 27.1
Laplacian 0.48 0.22 7.57
LLC 0.19 0.07 13.4
AutoEncoderEA 0.52 0.05 73.2
SNE 0.69 0.24 8824
SymSNE -0.0012 0.002 7733
CFA 0.69 0.08 421.3
GPLVM 0.69 0.17 4477
NPE 0.70 0.13 23.4
LPP 0.69 0.13 20.56
LLTSA 0.69 0.17 13.8
NCA 0.69 0.08 178.8
MCML 0.69 0.16 1337
LDA 0.69 0.14 0.46
FactorAnalysis 0.69 0.16 0.02
tSNE 0.12 0.36 2295
Isomap 0.70 0.23 8396
LandmarkIsomap 0.70 0.23 1739
ProbPCA 0.68 0.01 10.18
KernelPCA 0.03 0.08 679.8
MDS 0.69 0.17 0.002
DiffusionMaps 0.69 0.18 4046
Sammon 0.69 0.18 3294
Sinusoidalcartography 0.10 0.2 0.005
Figure 7Mapping the surface hydrophobicity of chymotrypsin: A half-section of the chymotrypsin protein (PDB ID: 2ea3) in 3-D is shown on the left, as a surface point cloud, color-coded by hydrophobic (orange) and hydrophilic (gray) regions, and active site (red). A 2-D mapping of chymotrypsin half-section using Sammon mapping is shown on the right.
and have resorted to a manual image registration at pre-sent to ensure accuracy.
The claim that our representation can capture struc-tural similarity can best be demonstrated using the 2-D curvature maps of proteins. Figure 9 shows the 2-D cur-vature maps of heat shock proteins 1bup and 1kaz, and their superposition. The superposition shows a high degree of overlap between the two proteins, demonstrat-ing that the 2-D representation contains sufficient infor-mation to identify structural similarities between proteins. Note that in a functional site identification context, the biochemical features would also be impor-tant determinants of similarity. Due to the difficulty of visual display and interpretation of multi-channel images, we have omitted combined feature maps from this presentation.
Texture mapping
The 2-D mapping presented in here lends itself to an interesting visualization application. Specifically, the 2-D map of a surface can be overlaid with an arbitrary image
to associate each map point with a pixel value from the image. Figure 10 shows the texture-mapping of the hemisphere with an image of the world. The blur in the image is due to the limited number of points we have used to represent a hemisphere. When the surface is redrawn with the assigned pixel values in 3-D, each tri-angle is colored using interpolation of the color values of its three points, to obtain a smooth image.
The process of texture mapping is repeated for a heat shock protein (PDB ID: 1kaz), where an image of a color wheel is texture-mapped on the protein (See Fig-ure 11). The spatial neighborhood of the 3-D points is extremely well preserved, as seen from the continuous gradation of the colors in 3-D. We envision this texture mapping to be useful in transferring annotations that can more easily performed on a 2D mapping, back onto the 3-D surface.
Conclusions
We proposed a 3-D to 2-D surface mapping method for protein surfaces using dimension reduction methods.
Protein function is largely dependent on surface fea-tures, especially the functional sites. Surface features are reducible to protein structure, and ultimately to sequence information, but convergent evolution has pro-duced proteins with dissimilar sequences and/or struc-tures which nevertheless have similar surface properties and functions. Surface comparison is expected to iden-tify protein function with greater efficiency than existing methods (sequence/structure comparison) by obviating complex structural analysis in favor of surface features, which have greater functional relevance.
Thus, surface comparison attempts to identify protein functional sites which are better predictors of protein function than sequence or structural features. We achieve surface comparison by mapping 3-D protein surfaces into 2-D through dimension reduction methods and enriching the 2-D representation with biochemical
and geometrical features. Various dimension reduction methods are evaluated for their ability to accurately represent the protein surface and their computational efficiency. The alignment of pairs of protein models obtained by these methods is obtained through a man-ual image registration process. An automated registra-tion process which quantifies the similarity of proteins and localizes the active site will be presented separately. Furthermore, the 3-D to 2-D mapping of surface points enables novel visualizations of protein structure and properties, including texture mapping in which the 2-D protein map is overlaid onto an arbitrary image. Future work, including the automatic implementation of the entire workflow described above, provides a clear path toward a protein function prediction system in which a query protein is ranked against a database of existing protein surface maps. Prediction of protein-protein
Figure 10Texture mapping on the hemisphere: On the left, a 2-D map of a hemisphere obtained using PCA is overlaid with an image of the world map; the parts of the image not assigned to any points are not shown. 3-D texture mapping of the hemisphere using the assigned pixel values is shown on the right.
interaction partners and interaction sites is possible through a similar system in which a query protein would be searched against a pre-built database of inter-action sites, and their correlation used in making predictions.
Acknowledgements
This article has been published as part ofProteome ScienceVolume 10 Supplement 1, 2012: Selected articles from the IEEE International Conference on Bioinformatics and Biomedicine 2011: Proteome Science. The full contents of the supplement are available online at http://www.proteomesci. com/supplements/10/S1.
Authors’contributions
AS conceived of the study and coordinated the project. HY was the primary developer, who implemented the method and performed the experiments. RQ contributed to the design and test of the method. All authors participated in the analysis of the results. HY and RQ contributed to the writing of the manuscript. All authors read and approved of the final draft.
Competing interests
The authors declare that they have no competing interests.
Published: 21 June 2012
References
1. Needleman SB, Wunsch CD:A general method applicable to the search for similarities in the amino acid sequence of two proteins.J Mol Biol
1970,48:443-453.
2. Smith TF, Waterman MS:Identification of common molecular subsequences.J Mol Biol1981,147:195-197.
3. Lipman DJ, Pearson WR:Rapid and sensitive protein similarity searches. Science1985,227:1435-1441.
4. Altschul SF, Gish W, Miller W, Myers EW, Lipman DJ:Basic local alignment search tool.J Mol Biol1990,215:403-410.
5. Berman HM, Westbrook J, Feng Z, Gilliland G, Bhat TN, Weissig H, Shindyalov IN, Bourne PE:The Protein Data Bank.Nucleic Acids Res2000,
28:235-242.
6. Via A, Ferre F, Brannetti B, Helmer-Citterich M:Protein surface similarities: a survey of methods to describe and compare protein surfaces.Cell Mol Life Sci2000,57:1970-1977.
7. Bork P, Sander C, Valencia A:Convergent evolution of similar enzymatic function on different protein folds: the hexokinase, ribokinase, and galactokinase families of sugar kinases.Protein Sci1993,2:31-40. 8. Kauvar LM, Villar HO:Deciphering cryptic similarities in protein binding
sites.Current Opinion in Biotechnology1998,9:390-394.
9. Russell RB, Sasieni PD, Sternberg MJE:Supersites within superfolds. Binding site similarity in the absence of homology.Journal of Molecular Biology1998,282:903-918.
10. An J, Totrov M, Abagyan R:Comprehensive identification of“druggable” protein ligand binding sites.Genome Inform2004,15:31-41.
11. Connolly ML:Analytical Molecular-Surface Calculation.Journal of Applied Crystallography1983,16:548-558.
12. Sanner MF, Olson AJ, Spehner JC:Reduced surface: an efficient way to compute molecular surfaces.Biopolymers1996,38:305-320.
13. Chew LP:Constrained Delaunay Triangulations.Algorithmica1989,
4:97-108.
14. Lee B, Richards FM:The interpretation of protein structures: estimation of static accessibility.J Mol Biol1971,55:379-400.
15. Connolly ML:Molecular-Surface Triangulation.Journal of Applied Crystallography1985,18:499-505.
16. Richards FM:Areas, volumes, packing and protein structure.Annu Rev Biophys Bioeng1977,6:151-176.
17. Sanner MF, Olson AJ, Spehner JC:Fast and robust computation of molecular surfaces.Proceedings of the Eleventh Annual Symposium on Computational Geometry1995, 406-407.
18. Staib LH, Duncan JS:Model-based deformable surface finding for medical images.IEEE Trans Med Imaging1996,15:720-731.
19. Delano WL:The PyMOL Molecular Graphics System, Version 1.2r3pre, Schrödinger, LLC.2002.
20. Jmol: an open-source Java viewer for chemical structures in 3D.[http:// www.jmol.org/].
21. Bairoch A:The PROSITE dictionary of sites and patterns in proteins, its current status.Nucleic Acids Res1993,21:3097-3103.
22. Abraham J, Abreu P, Aglietta M, Aguirre C, Allard D, Allekotte I, Allen J, Allison P, Alvarez-Muniz J, Ambrosio M,et al:Observation of the suppression of the flux of cosmic rays above 4 × 10 (19) eV.Phys Rev Lett2008,101:061101.
23. Venkatraman V, Sael L, Kihara D:Potential for Protein Surface Shape Analysis Using Spherical Harmonics and 3D Zernike Descriptors.Cell Biochemistry and Biophysics2009,54:23-32.
24. Fischer D, Norel R, Wolfson H, Nussinov R:Surface motifs by a computer vision technique: searches, detection, and implications for protein-ligand recognition.Proteins1993,16:278-292.
25. Poirrette AR, Artymiuk PJ, Rice DW, Willett P:Comparison of protein surfaces using a genetic algorithm.Journal of Computer-Aided Molecular Design1997,11:557-569.
26. Fanning DW, Smith JA, Rose GD:Molecular Cartography of Globular-Proteins with Application to Antigenic Sites.Biopolymers1986,25:863-883. 27. Pawlowski K, Godzik A:Surface Map Comparison: Studying Function
Diversity of Homologous Proteins.Journal of Molecular Biology2001,
309:793-806.
28. Pearson K:On lines and planes of closest fit to systems of points in space.Philosophical Magazine1901,2:559-572.
29. van der Maaten LJP:An Introduction to Dimensionality Reduction Using Matlab.Technical Report 07-06, MICC-IKAT, Maastricht University, Maastricht, The Netherlands2007.
30. van der Maaten LJP, Postma EO, van den Herik HJ:Dimensionality Reduction: A Comparative Review.Online Preprint2008.
31. Roweis. GEHaST:Stochastic Neighbor Embedding.Advances in Neural Information Processing Systems2002,15:833-840.
32. Tenenbaum JB, de Silva V, Langford JC:A global geometric framework for nonlinear dimensionality reduction.Science2000,290:2319-2323. 33. Agrafiotis DK:Stochastic proximity embedding.J Comput Chem2003,
24:1215-1221.
34. van der Maaten L, Hinton G:Visualizing Data using t-SNE.Journal of Machine Learning Research2008,9:2579-2605.
35. Roweis ST, Saul LK:Nonlinear dimensionality reduction by locally linear embedding.Science2000,290:2323-2326.
36. Rogers DJ, Tanimoto TT:A Computer Program for Classifying Plants. Science1960,132:1115-1118.
37. Honig B, Nicholls A:Classical electrostatics in biology and chemistry. Science1995,268:1144-1149.
38. Kyte J, Doolittle RF:A simple method for displaying the hydropathic character of a protein.J Mol Biol1982,157:105-132.
39. Zitová B, Flusser J:Image registration methods: a survey.Image and Vision Computing2003,21:977-1000.
40. O’Brien MC, Flaherty KM, McKay DB:Lysine 71 of the chaperone protein Hsc70 Is essential for ATP hydrolysis.J Biol Chem1996,271:15874-15878. 41. Shaw A, Saldajeno ML, Kolkman MA, Jones BE, Bott R:Structure
determination and analysis of a bacterial chymotrypsin from
Cellulomonas bogoriensis.Acta Crystallogr Sect F Struct Biol Cryst Commun
2007,63:266-269.
42. Sousa MC, McKay DB:The hydroxyl of threonine 13 of the bovine 70-kDa heat shock cognate protein is essential for transducing the ATP-induced conformational change.Biochemistry1998,37:15392-15399.
43. Bartlett GJ, Porter CT, Borkakoti N, Thornton JM:Analysis of catalytic residues in enzyme active sites.J Mol Biol2002,324:105-121.
44. Porter CT, Bartlett GJ, Thornton JM:The Catalytic Site Atlas: a resource of catalytic sites and residues identified in enzymes using structural data. Nucleic Acids Res2004,32:D129-133.
45. Schrödinger L:The PyMOL Molecular Graphics System, Version 1.5.0.1..
doi:10.1186/1477-5956-10-S1-S1