Open Access
Research
OpenFLUX: efficient modelling software for
13
C-based metabolic
flux analysis
Lake-Ee Quek
1, Christoph Wittmann
2, Lars K Nielsen
1and Jens O Krömer*
1Address: 1Australian Institute for Bioengineering and Nanotechnology, The University of Queensland, QLD 4072, Australia and 2Institute of Biochemical Engineering, Technische Universität Braunschweig, 38106 Braunschweig, Germany
Email: Lake-Ee Quek - [email protected]; Christoph Wittmann - [email protected]; Lars K Nielsen - [email protected]; Jens O Krömer* - [email protected]
* Corresponding author
Abstract
Background: The quantitative analysis of metabolic fluxes, i.e., in vivo activities of intracellular enzymes and pathways, provides key information on biological systems in systems biology and metabolic engineering. It is based on a comprehensive approach combining (i) tracer cultivation on
13C substrates, (ii) 13C labelling analysis by mass spectrometry and (iii) mathematical modelling for
experimental design, data processing, flux calculation and statistics. Whereas the cultivation and the analytical part is fairly advanced, a lack of appropriate modelling software solutions for all modelling aspects in flux studies is limiting the application of metabolic flux analysis.
Results: We have developed OpenFLUX as a user friendly, yet flexible software application for small and large scale 13C metabolic flux analysis. The application is based on the new Elementary
Metabolite Unit (EMU) framework, significantly enhancing computation speed for flux calculation. From simple notation of metabolic reaction networks defined in a spreadsheet, the OpenFLUX parser automatically generates MATLAB-readable metabolite and isotopomer balances, thus strongly facilitating model creation. The model can be used to perform experimental design, parameter estimation and sensitivity analysis either using the built-in gradient-based search or Monte Carlo algorithms or in user-defined algorithms. Exemplified for a microbial flux study with 71 reactions, 8 free flux parameters and mass isotopomer distribution of 10 metabolites, OpenFLUX allowed to automatically compile the EMU-based model from an Excel file containing metabolic reactions and carbon transfer mechanisms, showing it's user-friendliness. It reliably reproduced the published data and optimum flux distributions for the network under study were found quickly (<20 sec).
Conclusion: We have developed a fast, accurate application to perform steady-state 13C
metabolic flux analysis. OpenFLUX will strongly facilitate and enhance the design, calculation and interpretation of metabolic flux studies. By providing the software open source, we hope it will evolve with the rapidly growing field of fluxomics.
Published: 1 May 2009
Microbial Cell Factories 2009, 8:25 doi:10.1186/1475-2859-8-25
Received: 19 January 2009 Accepted: 1 May 2009
This article is available from: http://www.microbialcellfactories.com/content/8/1/25
© 2009 Quek et al; licensee BioMed Central Ltd.
Background
Metabolic flux analysis (MFA) plays a central role in met-abolic engineering and systems biology [1]. Metmet-abolic fluxes most closely reflect the underlying metabolic phe-notype, whereas other 'omics approaches only yield a sense of metabolic capacities (transcriptomics/proteom-ics) or thermodynamic driving forces (metabolom(transcriptomics/proteom-ics). Metabolic flux analysis is particular important in rational strain engineering, where we specifically seek to manipu-late the metabolic phenotype.
Due to the high complexity of the examined metabolic network, flux analysis typically involves the use of a stoi-chiometric model, in which the metabolic reactions avail-able to the cell are parameterized before the fluxes are estimated from experimental data [2]. State-of-art flux analysis today includes the use of stable isotopes to over-come problems such as incomplete resolution of impor-tant cellular pathways or the need to rely on stoichiometric parameters with high uncertainty such as ATP yield (Yx/ATP) or P/O ratio which are inherently linked to the purely stoichiometric approaches [3]. 13C-based
MFA therefore is a powerful extension of MFA [3]. In such studies, after feeding 13C-labelled substrate(s), one
meas-ures the 13C tracer enrichment patterns of metabolites that
are rich in flux information, using instruments such as nuclear magnetic resonance spectroscopy (NMR) [4,5] or mass spectrometry (MS) [6]. There are mainly two differ-ent approaches to extract flux information from the label-ling patterns: by model-based flux fitting [3], and by analytical interpretation of flux ratios [7] (both approaches briefly reviewed in [8]). Redundant pathways that contribute differently to tracer distribution can thus be resolved. Flux analysis is carried out independently from energy and redox balancing, because the balancing equations only involve the carbon backbone. Conversely, the flux results can be used to check the consistency of energy and redox balances [9].
There has been significant development especially con-cerning the experimental framework for 13C MFA [10]. 13C
MFA has been applied to various prokaryotic and eukary-otic systems [11-13] involving miniaturized screening studies in small scale [14,15]. There is an increasing trend towards large-scale network-based stationary 13C MFA
[16,17], as well as non-stationary (i.e., dynamic) 13C MFA
[18-20]. Large-scale metabolic models are preferred in order to capture, as many reactions as possible, bearing effects on carbon labelling, and to maintain global con-sistency of flux estimates. Considering metabolism in iso-lated parts or using overly summarized metabolic models can lead to biased results [17]. However, specifying large sets of isotopomer balances and subsequently performing parameter estimation can be very cumbersome.
Several software packages have been developed to facili-tate flux analysis, the most popular being FiatFlux [21] and 13C-FLUX [22]. FiatFlux implements the flux ratio approach to 13C MFA [7] and comes preconfigured to
derive flux ratios and net fluxes for [1-13C]- and [U-13
C]-glucose experiments and GC-MS analysis of proteinogenic amino acids for several microorganisms. Recent develop-ments allow to generate equation systems automatically [23], which facilitates the extension of the flux ratio approach to various metabolic models, input substrates and labelling data.
In contrast, 13C-FLUX is a general purpose package for modelling, simulation, design, evaluation, and statistical analysis of 13C-labelling experiments [22]. Unfortunately,
13C-FLUX is relatively cumbersome to use in terms of requiring the user to specify free fluxes, to set up the initial solution, and to manually initialize and terminate each optimization. It is not possible to perform multiple rounds of optimization unsupervised, which is frequently used to check convergence of the optimization results. There is a general lack of support in aspects of experimen-tal design, i.e., explore change in labelling patterns for a different flux distribution and/or various combinations of input substrates. For expert users, there is limited oppor-tunity to modify source code for implementation of new algorithms and workflows for different labelling prob-lems.
There is a need for 13C MFA tool that is simple, flexible
and transparent. Fast computation is crucial. For a non-expert user, the software must enable a smooth reproduc-ible workflow covering the whole process from metabolic model definition to flux estimation. A flexible approach necessarily supports user-defined metabolic systems, while a transparent computational model offers expert users the opportunity to tailor make downstream algo-rithms for parameter estimation and statistical analysis.
To meet this challenge, we have developed OpenFLUX, a simple yet flexible application to perform steady-state 13C
[25] compared to alternative representations of labelling distribution of metabolites, such as AAV (atom activity vector) [26], IDV (isotopomer distribution vector) [27], cumomer [28] and bondomer [29].
The present work describes the implementation and vali-dation of OpenFLUX. Specifically, we explain the tasks performed by OpenFLUX, provide an illustration of the model definition setup of a hypothetical metabolic model, and also describe the structure and contents of the resulting metabolic models. The software is then validated by reproducing published 13C MFA results.
Methods
Implementation of OpenFLUX
OpenFLUX consists of two parts for (i) automated model set-up or modification from user entered reaction data and (ii) the application to flux analysis by calculating fluxes from experimental data as well as statistical evalua-tion (Figure 1). The first part consists of a parser that auto-matically generates the metabolite and isotopomer
balance models from a text-based model definition. The second part is a structured workflow that implements a series of numerical optimization algorithms for flux parameter estimation and sensitivity analysis.
Automated generation of metabolic models
OpenFLUX parses the metabolic model from a structured tab-delimited text file, created using a spreadsheet pro-gram, into MATLAB readable metabolite and isotopomer balance models. The former is the stoichiometric matrix (S) in the mass balance
while the latter is a non-linear function (F) that maps input substrate(s) mass isotopomer distribution(s) (MID)
( ) to the simulated MIDs ( ) using the flux dis-tribution ( ) as a parameter
The generation of the isotopomer balance model closely follows the recently developed EMU framework [25], whereby the model generation algorithm progressively constructs EMU balances by identifying all reactant EMUs that contribute to a given product EMU. The algorithm progresses until each of the simulated EMU products can be traced to the input substrate EMUs via a series of bal-ancing equations. These equations are subsequently organized into matrix equations (see [25] for details).
Assignment of free fluxes
The solution to (1) can be expressed as a linear
combina-tion of free fluxes ( ) [28]
where NS is the null space of S and the dimension of equals the nullity of S, i.e., degrees-of-freedom in the sys-tem. It is these free fluxes that the optimization program will manipulate in order to achieve the best fit to the measured data.
The choice of free fluxes in (3) is not unique. In Open-FLUX, the flux vector is first decomposed into four differ-ent reaction types: bi-directional forward and reverse
reactions ( and ), and irreversible reactions that
are either free fluxes ( ) or dependent fluxes ( ),
and rearranged to the form
S v⋅ =0 (1)
xinput xcalc
v
xcalc =F x
(
input;v)
(2)vfree
v =NS v⋅ free (3)
vfree
v→ v←
vfreeirr vdepirr
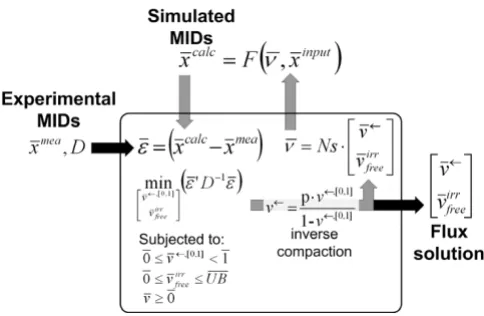
Workflow of OpenFLUX Figure 1
Workflow of OpenFLUX. The software consists of 2
Using this form, the reduced column echelon form of the null-space matrix (NS)
explicitly maps the free fluxes defined as
to the full flux vector, .
This transformation confers two main advantages. Prima-rily, the assignment of free fluxes is automated to include all reverse fluxes and a subset of irreversible fluxes (6). The reverse fluxes are determined from the spreadsheet, where the user has identified the bi-directional reactions in the network, and, for each bi-directional reaction pair, the for-ward and reverse counterpart. Additional information may be specified, such as known reaction rates derived from experimental data (e.g., biomass precursor drain or extracellular rates), or the user's preference for an irrevers-ible free flux assignment. OpenFLUX will then prioritize the assignment of free fluxes, but ultimately, the assign-ment is determined by the stoichiometric matrix.
A secondary advantage is that is calculated explicitly
from in a single matrix operation (5). This circum-vents the use of the stoichiometric matrix as an implicit constraint during optimization [17]. The formulation of the equation system used for calculation of absolute fluxes is greatly simplified compared to the convention proposed by Wiechert and de Graaf (1997) [28]. Further-more, analytical derivation of the gradient matrix is straightforward (i.e., ).
We note that the flux coordinates for bi-directional fluxes,
v←and v→, while representing a natural choice, differ from the conventional flux coordinates, net flux (vnet) and
exchange flux (vxch), used in flux analysis [28]. Both flux
coordinates can be compactified to the same effect whose main purpose is to improve the numerical performance. The rationale for the change in coordinates is detailed in the Appendix. It is straightforward to interchange between the coordinates using:
Flux calculation via numerical optimization
OpenFLUX uses FMINCON, a gradient-based minimiza-tion search funcminimiza-tion contained in MATLAB's Optimiza-tion Toolbox, to perform both flux parameter estimaOptimiza-tion and sensitivity analysis. FMINCON utilizes a quasi-New-ton sequential quadratic programming (SQP) method for constrained, non-linear optimization. The algorithm is well-suited for metabolic flux analysis where physiologi-cally meaningful boundaries exists for the free fluxes [22,30].
For parameter estimation (Figure 2), the program searches for values of the free fluxes within the domains of the flux constraints in order to minimize the weighted sum of squared residual errors ( ) between experimental data
( ) and calculated values ( ), where the weight is the inverse of the variance-covariance matrix (D)
The program assumes measurements to be uncorrelated, i.e., D contains as a diagonal the individual measurement
variances ( ). The constraints applied to the optimiza-tion are based on the definioptimiza-tion that all fluxes must be positive, since reversible reactions are separated into the forward and reverse components
The optimization is also bounded to improve numerical
stability. The irreversible fluxes are non-negative and
upward bounded by the net flux in the system. The upper bound (UB) is by-default set to 20 times the maximum substrate uptake rate, but can be varied
v v v v v free irr depirr = ⎡ ⎣ ⎢ ⎢ ⎢ ⎢ ⎢ ⎢ ⎤ ⎦ ⎥ ⎥ ⎥ ⎥ ⎥ ⎥ ← → (4)
NS null S
I I M I M netirr netrev =
(
( )
)
= ⎡ ⎣ ⎢ ⎢ ⎢ ⎢ ⎢ ⎤ ⎦ ⎥ ⎥ column reduced 0 00 ⎥⎥⎥ ⎥ (5) v v v free freeirr =⎡ ⎣ ⎢ ⎢ ⎤ ⎦ ⎥ ⎥ ← (6) v v vfree dv
dv free=NS
vnet = v→−v← (7)
v
v v v v
xch = →+ ←− →− ←
2
(8)
e
xmea xcalc
min ’ ,[ , ] v v calc mea free
irr x x
← ⎡ ⎣ ⎢ ⎢ ⎤ ⎦ ⎥ ⎥ − =
(
−)
0 1 1ee D ee, where ee
(9)
s2
v =NS v⋅ free ≥0 (10)
vfreeirr
The reverse free fluxes are non-negative, but have no natural upper limit. Hence, a compactification operation is used to transform from a physical [0, infinity] scale to a numerical [0, 1] scale [28].
A scaling factor (P) is used, whose value is typically of the same order-of-magnitude as the largest input substrate flux [31]. Alternatively, P can be adjusted during optimi-zation to obtain a better conditioned Jacobian matrix [24].
Statistical evaluation of flux data
Flux statistics, e.g. confidence intervals of single flux parameters, are important to evaluate flux data and deter-mine if observed differences between mutants or culture conditions reflect physiological differences. Confidence intervals for flux parameters (Parai) are determined using the non-linear approach developed by Antoniewicz et al.
(2006) [30]. This approach provides a more accurate esti-mate of flux uncertainty than local estiesti-mates of the stand-ard deviations. Briefly, the approach employs that the minimized variance-weighted sum of squared residual is approximately χ2 distributed and therefore the difference
(Δε;) between the objective function evaluated at the opti-mal solution and the objective function when one flux is fixed follows a χ2-distribution with one degree of
free-dom. Accordingly, an approximate (1-α) confidence interval for Parai can be defined by the two solutions for
paraio to
FMINCON is used to search for the solution pair, and each search is initialized from the optimum solution found during parameter estimation. The constraints applied in parameter estimation, (10)-(12), are also applied here ensuring that the boundaries to confidence interval represent feasible solutions. Analysis can be per-formed on different forms of Parai, such as free or depend-ent flux, flux ratio, or reversibility ratio. Alternatively, flux standard deviations can be estimated using the Monte Carlo approach included in OpenFLUX [32].
Flexible use for different types of experimental labelling data OpenFLUX automatically indicates to the user the input substrate EMUs that must be specified prior to label sim-ulation. Specifying these EMUs is done either by directly defining the vector elements of the input substrate EMUs, or indirectly using one of OpenFLUX's built-in functions. These functions calculate the corresponding vector ele-ments using either the atom activity vector (AAV) or the isotopomer distribution vector (IDV) of the input sub-strates, both of which are well known notations in flux modelling [26,27].
The simulated output vector ( ) can be modified by the user to suit the experimental data type. The
mathemat-ical manipulations that can be performed on include (i) integrating mass interference from non-backbone sta-ble isotopes using Cauchy-product [33], (ii) normalizing and truncating EMU variables to match the length of a shorter MID vector (typically 2 to 3 elements per metabo-lite), (iii) converting EMU variables into summed frac-tional labelling (SFL), and (iv) include or exclude specific element in an EMU variable (e.g. to represent positional enrichment data). These modifications are not automated by the software because they can be very diverse.
v←
0≤ 0 1 <1 0 1 = ←
+ ←
← ←
v where v v
v
,[ , ] ,[ , ]
, P
(12)
Δ Δ
e c
e e s e
a
=
=
(
)
−−
= 12 ( ),1
, , ,
where
vfree xmea v x
Para Para
free m
i io
eea
Parai Paraoptimum ,s
(
)
=(13)
xcalc
xcalc Algorithm for weighted least-square parameter estimation
Figure 2
Algorithm for weighted least-square parameter
esti-mation. OpenFLUX uses MATLAB's FMINCON to
mini-mize the residual error ( ) between the experimental MIDs ( ) and the simulated MIDs ( ), by optimizing
the free fluxes ( ), which are subjected to lower and upper boundary value constraints. is weighted by the variance matrix (D). The inverse compactification function is used to transform reverse flux from a numerical parameter (v←, [0,1]) into a physical flux parameter (v←). The null-space matrix (Ns) is then used to calculate the flux vector ( ) from the free fluxes ( ). Finally, is calculated
using and known MIDs of the input substrates ( ). FMINCON terminates when a local minimum is found, revealing the optimum free fluxes.
e
vfreeirr ,v←,[ , ]0 1 xcalc
vfreeirr ,v←,[ , ]0 1
e
v
vfreeirr ,v←,[ , ]0 1 xcalc
An EMU variable is essentially a MID vector. One can immediately simulate mass spectroscopy data using EMU variables. It is, however, possible to generate NMR fine spectra from EMU variables (detailed in [25]). OpenFLUX currently does not support automatic generation of NMR fine spectra, thus the user needs to list all essential EMU variables required for the transformation process during model set up and enter the transformations manually.
Design of experiments
Not all intracellular fluxes can be resolved in a single labelling experiment, but careful experimental planning can ensure that key unknown fluxes are determinable [34,35]. Determining the optimal labelled substrates to use and optimal metabolites to measure is a non-trivial task, often requiring sophisticated design strategies [31,36-38]. A common theme emerging from these design approaches is that one must be able to visualize the rela-tionship between flux distribution, input substrates used and labelling response measured. OpenFLUX partially supports experimental design by allowing user to perform forward label simulation, that is to predict the labelling state of specified EMUs based on fluxes and input labels. Using Monte-Carlo simulation to explore fluxes in the expected range, it is possible to establish – for a given input label – what EMUs are most responsive to changes in flux, and hence what EMUs should preferably be meas-ured.
Excluded metabolites and reactions
The spreadsheet based model specification allows the user to specify input substrate(s), simulated EMU variables as well as metabolites excluded from the stoichiometric matrix.
Five reaction types are supported. In addition to irreversi-ble ("F") and reversiirreversi-ble forward ("FR") and reversiirreversi-ble reverse ("R") fluxes, it is possible to specify reactions used only for metabolite balancing ("B") and reactions used only for isotopomer balances ("S"). The atom transition equation for "B" type reaction is not required so that only relevant information has to be generated prior to the cal-culation. Type "S" reaction is a convenient approach to map a product's MID to their respective precursor(s) with-out incurring additional degrees-of-freedom in the metab-olite balance model. Metabmetab-olites unrelated to the isotopomer balances, such as ATP and NADH, are marked with "X" in the atom transition equation. This allows user to set up a metabolic model that includes co-factor bal-ances.
Test case flux analysis TCA cycle
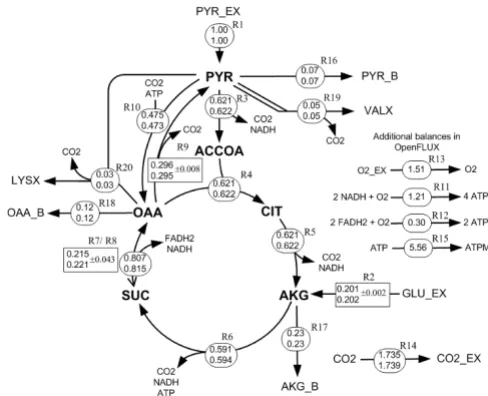
OpenFLUX' semantics and algorithms were tested using a small network. The metabolic network is a representation of a condensed TCA cycle (Figure 3, 4), which also
includes gluconeogenic (R9) and anaplerotic (R10) fluxes. The network has 2 input substrates (pyruvate (R1), glutamate (R2)), 3 biomass precursor drain fluxes (oxaloacetate (R18), α-ketoglutarate (R17), pyruvate (R16)), and 1 reversible reaction (R7 – forward, R8 – reverse) between succinate and oxaloacetate. Oxidative phosphorylation reactions are also included (R11, R12). It is assumed that the CO2 efflux (R14) is unidirectional [see Additional file 1]. The synthetic experimental data assumed available consists of the production rates of valine and lysine (R19 and R20), the precursor with-drawal rates from pyruvate, α-ketoglutarate and oxaloace-tate towards biomass formation, and values on the relative fraction of the three mass isotopomers M0, M1 and M2 for valine, lysine, aspartate and succinate. The
label-Flux distributions for a simplified TCA cycle model as described in the text and Appendix
Figure 3
Flux distributions for a simplified TCA cycle model as
described in the text and Appendix. Fluxes were
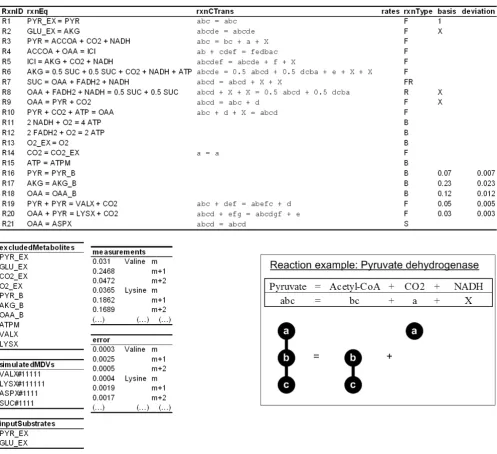
Overview of the network model definition text file Figure 4
Overview of the network model definition text file. The model definition file consists of one table and five lists. The metabolic reaction network is defined in the table, and is organized under the following headings: reaction ID (rxnID), reaction equation (rxnEQ), reaction atom transition (rxnCTrans), reaction rate (rates), reaction type (rxnType), free flux allocation (basis) and flux value standard error (deviation). If a given reaction rate is known (e.g., biomass drain rates), then the flux value and the corresponding measurement error can be included in the basis and deviation columns respectively. The parser requires the user to separately list down metabolites that are excluded from the stoichiometric model (excludedMetabolites), EMUs that are to be calculated by the isotopomer model (simulatedMDVs), and input substrates that contribute to the isotopomer balance ( input-Substrates). The experimental MIDs (measurements) and the associated errors (error) are listed in the same order as the EMUs in the simulatedMDVs list. The figure insert (bottom right) is an example of how pyruvate dehyrogenase reaction is described in the rxnEQ and rxnCTrans columns. CO2 is produced by cleaving the carboxylic end (C1) of pyruvate, leaving the acetyl moiety
ling data were corrected for mass interference from non-carbon backbone atoms. Fluxes were normalized to the pyruvate input flux of 1 mmol g-1 h-1. A detailed
instruc-tion of how to formulate, set up and implement the model using OpenFLUX is provided in the Appendix.
Metabolic model for lysine producing Corynebacterium glutamicum
We reconstructed the metabolic network of lysine
produc-ing C. glutamicum based on published information [39]
and additional modelling details kindly provided by the authors [see Additional file 2]. The input substrate used was [1-13C]-glucose (with 99% enrichment purity), and
all fluxes were normalized with respect to the glucose uptake rate (i.e., fluxes are expressed in percentage of glu-cose uptake rate). As the published MIDs are uncorrected, all the simulated EMU variables were modified for mass interference from non-carbon backbone isotopes using the molecular formula of the amino acids fragments (i.e., parent ion cluster). The first n+1 signal elements were nor-malized (n indicates number of backbone carbon), and then truncated to the correct vector length (equivalent to the measured MIDs) before performing weighted least-square analysis. The inferred metabolic model consisted of a total of 71 reactions and 42 balanceable metabolites. The metabolite model yielded a total of 26 degrees-of-freedom and 18 fluxes were determined experimentally: anabolic precursor yields (11), biomass yield (1), secreted product yields (5), and glucose uptake rate (1). To reduce the number of unknown parameters, these 18 fluxes were chosen as free fluxes, and the associated flux values were used deterministically as no redundant data exist in the measurement set. Note that if one suspects gross measure-ment errors in the flux measuremeasure-ment set, then these fluxes should be set free and the flux values subjected to the least-square analysis together with the MIDs. Five (5) of the remaining 8 free fluxes are associated with the revers-ibility of non-oxidative pentose-phosphate pathway enzymes (3), glucose-6P isomerase (1) and intercellular CO2 exchange (1). The other 3 free fluxes were assigned (by the software) to the irreversible fluxes of glucose-6P dehydrogenase, pyruvate carboxylase, and glycine synthe-sis via the serine route.
The MID of 9 amino acids and trehalose were reported. Three "S" type reactions were included in the metabolite network to directly map label distribution of alanine, aspartate and glutamate to pyruvate, oxaloacetate and α-ketoglutarate, respectively. This was not necessary for all other amino acids and trehalose because these metabo-lites were already described in the isotopomer balances.
Computational requirements
All computational work was performed on a Pentium D 3.00 GHz computer. OpenFLUX was implemented in
MATLAB 7.3.0.267 (R2006b) (The MathWorks, Natick, MA, USA). Numerical optimization was carried out using FMINCON function from MATLAB's Optimization Tool-box. Since we used numerical gradient, FMINCON auto-matically used the active-set algorithm (also known as "medium scale"). Termination tolerance on the function value was set to 1 × 10⁻⁴, and the optimizations were
ter-minated when the magnitude of directional derivative in search direction is less than 2 × 10⁻⁴. 13C-FLUX was
implemented in Ubuntu Linux 7.1 operating system.
Results and discussion
Test case flux analysis TCA cycleThe specified network (Figure 3) has 9 degrees-of-free-dom. Of the required 9 free fluxes, 7 were assigned by default from the definition: R1 (specified input flux), R8 (reverse flux), R16, R17 and R18 (specified biomass pre-cursor drain fluxes), and R19 and R20 (specified amino acid production flux). R2 was specified as a preferred free parameter in the model definition, and – since this was an acceptable choice – was assigned by the parser. Open-FLUX automatically assigned the remaining free
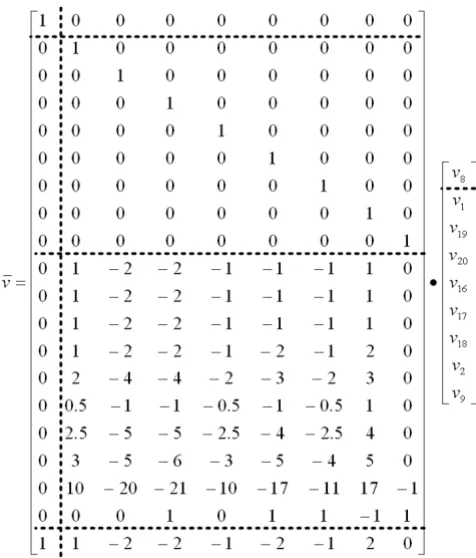
parame-The null-space matrix generated from the stoichiometric model
Figure 5
The null-space matrix generated from the stoichio-metric model. The structure of this NS reflects the generic NS matrix form shown in Eq. 3. The Identity matrix indicate the 1-to-1 mapping of the 9 free flux parameters – ν8, v2, v9
ter to R9. Note that the correct NS structure (Eq. 3) is automatically produced (Figure 5).
The parser-generated isotopomer balance model consists of 50 EMU variables organized into 7 matrix equations, of which 14 are known input substrate EMUs. With the EMU approach, the total number of unknown scalar MID vari-ables (116 varivari-ables) involved in the optimization is sig-nificantly less than a complete isotopomer model (262 variables).
The model created by OpenFLUX was validated for the TCA cycle test case by comparing the labelling data lated for a given set of fluxes with cumomer based simu-lation (i.e., 13C-FLUX) [22]. Forward simusimu-lation based on hypothetical fluxes yielded identical labelling data results for all cases (data not shown). This means that the semantics used to specify the reaction network and the underlying isotopomer balance model constructed by OpenFLUX via the EMU decomposition algorithm is con-sistent.
The labelling patterns obtained for the test case were next corrupted with 1% Gaussian noise, and subjected to least-square analysis using 13C-FLUX [22] and OpenFLUX. Randomized initial solutions were used to start each opti-mization. All approaches yielded identical optimum solu-tions, consistent with the hypothetical values (Figure 3). This is an essential performance benchmark, since new semantics were introduced to define reversible and scram-bling reactions.
The introduction of "X" type metabolites and "S" type reactions in OpenFLUX' flagging system for metabolites and reactions has several advantages. In this example, OpenFLUX automatically calculated the cofactor balances and the required oxygen uptake rate based on a given P/O ratio of 3 (Figure 5). OpenFLUX could also use the label-ling input from aspartate, without introducing this amino acid as a balanceable metabolite. With 13C-FLUX, we had to artificially create a new reaction withdrawing a fraction of oxaloacetate to constitute the flux of aspartate synthesis and allow the consideration of its labelling pattern for flux estimation.
Real case flux analysis – lysine producing C. glutamicum
The performance of OpenFLUX was tested for a real case flux scenario, comparing a low and a high lysine produc-ing mutant of the soil bacterium C. glutamicum [39]. For these mutants, fluxes were previously quantified combin-ing mass balanccombin-ing with tracer experiments on [1-13
C]-glucose, GC-MS 13C enrichment analysis of proteinogenic
amino acids [10,40], and isotopomer mapping matrices based simulation.
The isotopomer model for C. glutamicum is comprised of 108 unknown EMU variables, with 15 additional known [1-13C]-Glucose and CO
2 EMUs. A total of 20 balancing
matrix equation sets were used to calculate the unknown EMUs, 9 of which are single equation balances that are easily calculated. The 108 unknown EMU variables corre-spond to 360 scalar MID variables, which is a substantial reduction from the 8380 unknown scalar variables expected in the full isotopomer model.
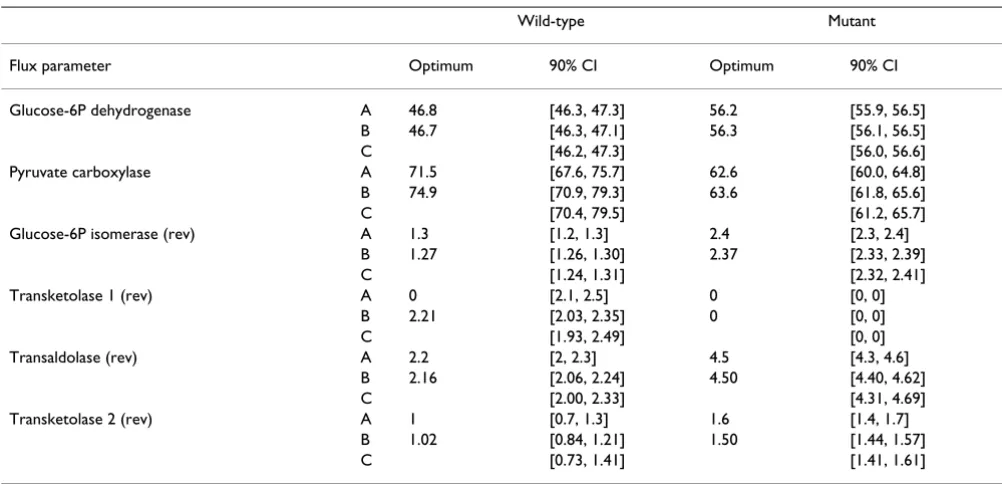
A total of 50 cycles of optimization were performed for both wild type and engineered strain datasets. The total computation time for each cycle was about 16 seconds. The calculated MIDs shown in Table 1 were derived from one of the optimization cycles that showed the smallest weighted sum of square residuals. All of the MIDs calcu-lated by OpenFLUX were consistent with the published data (Table 1). The optimized free fluxes were also repro-duced (Table 2). Comparing the 90% confidence intervals reported by Becker et al. [39] with the gradient-based search intervals generated by OpenFLUX, we could infer that there is no significant difference between the esti-mated free fluxes. In addition to the gradient-based search, we used the Monte-Carlo approach to generate the 90% CI [32,41] (Table 2). Briefly, the analysis was carried out by corrupting both the MIDs measurements with the prescribed relative error and the reported experimental yields for biomass and by-products with the correspond-ing deviations. The new data set was then used for param-eter estimation. Optimization was performed iteratively until a sample size of 150 independent flux distributions was obtained. The 90% CI for a single parameter was then calculated using the free parameter's mean and variance estimated from the samples [42]. The 90% CIs generated through Monte-Carlo simulation were consistent with the original work, as well as with the intervals generated by gradient-based search. Notably, the confidence interval generated by Monte Carlo approach is generally wider than the gradient-based search because the variations in the experimental yields were included in the analysis. The wider 90% CI managed to capture all of the published optimum free fluxes. Overall, this validates OpenFLUX's accuracy with respect to the isotopomer balance model and the numerical approach.
Conclusion
OpenFLUX is a generic and efficient novel software tool for 13C MFA. We have shown that the front-end model
eval-uation. The underlying metabolic models are transparent to the user, and could be adapted for other purposes. In addition, the definition of the simulated output vector is flexible, thus various experimental data types can be applied. Finally, the inclusion of two different but com-plementary confidence interval determination algorithms (i.e., non-linear and Monte Carlo) enables a more robust evaluation of flux solutions.
OpenFLUX performed well on real metabolic problems. We have applied the C. glutamicum metabolic model as an example problem, and were able to reproduce the calcu-lated MIDs, the optimized flux parameters and the corre-sponding confidence intervals. We also showed that OpenFLUX is computationally fast.
OpenFLUX is useful for exploring different network topol-ogy, flux distribution and modelling assumptions. The
application grants the user the ability to control the underlying metabolic models and data inputs via a simple textual interface. Experimental design is critical to justify choice of substrates and analytical techniques. One can troubleshoot potential observability and sensitivity issues by simulating hypothetical MIDs data on a typical range of flux distributions, and subsequently explore the resolu-tion of different flux parameters. OpenFLUX supports testing of various labelled substrates. For incomplete met-abolic models, 13C MFA could be used to validate soft
assumptions regarding P/O ratio and cofactor balances (ATP, NAD(P)H).
Overall, the purpose of OpenFLUX is to encourage the adoption of 13C tracer studies for flux analysis in newly
arising systems approaches. Providing it open source aims on further development of the software as a general plat-form for 13C fluxomics. 13C MFA requires significant
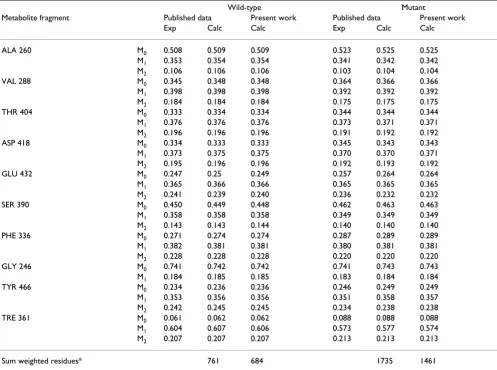
Table 1: Experimental and calculated MIDs of the wild-type and engineered C. glutamicum.
Wild-type Mutant
Metabolite fragment Published data Present work Published data Present work
Exp Calc Calc Exp Calc Calc
ALA 260 M0 0.508 0.509 0.509 0.523 0.525 0.525
M1 0.353 0.354 0.354 0.341 0.342 0.342
M2 0.106 0.106 0.106 0.103 0.104 0.104
VAL 288 M0 0.345 0.348 0.348 0.364 0.366 0.366
M1 0.398 0.398 0.398 0.392 0.392 0.392
M2 0.184 0.184 0.184 0.175 0.175 0.175
THR 404 M0 0.333 0.334 0.334 0.344 0.344 0.344
M1 0.376 0.376 0.376 0.373 0.371 0.371
M2 0.196 0.196 0.196 0.191 0.192 0.192
ASP 418 M0 0.334 0.333 0.333 0.345 0.343 0.343
M1 0.373 0.375 0.375 0.370 0.370 0.371
M2 0.195 0.196 0.196 0.192 0.193 0.192
GLU 432 M0 0.247 0.25 0.249 0.257 0.264 0.264
M1 0.365 0.366 0.366 0.365 0.365 0.365
M2 0.241 0.239 0.240 0.236 0.232 0.232
SER 390 M0 0.450 0.449 0.448 0.462 0.463 0.463
M1 0.358 0.358 0.358 0.349 0.349 0.349
M2 0.143 0.143 0.144 0.140 0.140 0.140
PHE 336 M0 0.271 0.274 0.274 0.287 0.289 0.289
M1 0.382 0.381 0.381 0.380 0.381 0.381
M2 0.228 0.228 0.228 0.220 0.220 0.220
GLY 246 M0 0.741 0.742 0.742 0.741 0.743 0.743
M1 0.184 0.185 0.185 0.183 0.184 0.184
TYR 466 M0 0.234 0.236 0.236 0.246 0.249 0.249
M1 0.353 0.356 0.356 0.351 0.358 0.357
M2 0.242 0.245 0.245 0.234 0.238 0.238
TRE 361 M0 0.061 0.062 0.062 0.088 0.088 0.088
M1 0.604 0.607 0.606 0.573 0.577 0.574
M2 0.207 0.207 0.207 0.213 0.213 0.213
Sum weighted residues* 761 684 1735 1461
* For comparative reasons, residuals resulting from minuscule technical replication errors used in original work, were accepted here.
upfront investment to construct the isotopomer balance model and to establish the numerical optimization for flux analysis. Users who are already familiar with MFA will find that 13C MFA is readily implemented once the atom
transitions are included into the metabolic model. Lastly, the text-based spreadsheet interface is an effective means of disseminating the metabolic model because the net-work topology and modelling assumptions are readily found in a single model definition file.
Symbols and abbreviations
AAV: atom activity vector; EMU: elementary metabolite unit; GC: gas chromatography; IDV: isotopomer distribu-tion vector; MFA: metabolic flux analysis; MID: mass iso-topomer distribution; MS: mass spectrometry; NMR: nuclear magnetic resonance; TCA: tricarboxylic acid; : weighted sum of squared residual errors; I: Identity matrix; NS: null space matrix; P: compactification scaling factor; S: stoichiometric matrix; WSSR: weighted sum of
squared residuals; : measurement variances; : flux
vector; : free flux vector; vnet: net flux; vxch: exchange
flux; v←, : reverse flux (scalar, vector); v→, :
for-ward flux (scalar, vector); v→, net: net forward flux; :
irreversible free flux vector; : irreversible dependent
flux vector; UB: flux upper boundary; : simulated
MID; : input substrate MID; : measurement MID.
Availability and requirements
OpenFLUX is optimized for MATLAB 7.3 (R2006b) (The MathWorks, Natick, MA, USA) and Java 6 (Sun Microsys-tems, Santa Clara, CA, USA) on a Microsoft Windows XP platform. It requires the MATLAB Optimization Toolbox. The software is also available for MacOS 10.4.11 (and later) and Ubuntu linux 7.1 operating systems. Microsoft Excel 2003 was used to generate the model input for the Java parser, alternative spreadsheet programs are also use-able.
OpenFLUX is released as open source and is available upon request, both compiled and as source code. Supple-mentary information is available online http:// web.aibn.uq.edu.au/cssb/Resources.html.
Competing interests
The authors declare that they have no competing interests.
Authors' contributions
LEQ programmed the JAVA parser, implemented Open-FLUX in MATLAB and performed the EMU based simula-tions. He also performed 13C-FLUX simulations and contributed to writing the paper. CWI performed the sim-ulations based on isotopomer mapping, provided data and modelling details on the real test case scenario, con-tributed expertise for development of OpenFLUX and e
s2 v
vfree
v← v→
vfreeirr
vdepirr
xcalc
xinput xmea
Table 2: Estimated optimum free fluxes (mmol/100 mmol Glucose) and the associated 90% confidence interval.
Wild-type Mutant
Flux parameter Optimum 90% CI Optimum 90% CI
Glucose-6P dehydrogenase A 46.8 [46.3, 47.3] 56.2 [55.9, 56.5]
B 46.7 [46.3, 47.1] 56.3 [56.1, 56.5]
C [46.2, 47.3] [56.0, 56.6]
Pyruvate carboxylase A 71.5 [67.6, 75.7] 62.6 [60.0, 64.8]
B 74.9 [70.9, 79.3] 63.6 [61.8, 65.6]
C [70.4, 79.5] [61.2, 65.7]
Glucose-6P isomerase (rev) A 1.3 [1.2, 1.3] 2.4 [2.3, 2.4]
B 1.27 [1.26, 1.30] 2.37 [2.33, 2.39]
C [1.24, 1.31] [2.32, 2.41]
Transketolase 1 (rev) A 0 [2.1, 2.5] 0 [0, 0]
B 2.21 [2.03, 2.35] 0 [0, 0]
C [1.93, 2.49] [0, 0]
Transaldolase (rev) A 2.2 [2, 2.3] 4.5 [4.3, 4.6]
B 2.16 [2.06, 2.24] 4.50 [4.40, 4.62]
C [2.00, 2.33] [4.31, 4.69]
Transketolase 2 (rev) A 1 [0.7, 1.3] 1.6 [1.4, 1.7]
B 1.02 [0.84, 1.21] 1.50 [1.44, 1.57]
C [0.73, 1.41] [1.41, 1.61]
contributed to writing of the paper. LKN provided his expertise in mathematical modelling of fluxes and con-tributed to writing the paper. JOK designed and super-vised the study. He contributed expertise in 13C fluxomics
and coordinated the writing of the paper. All authors have approved the final manuscript
Appendix
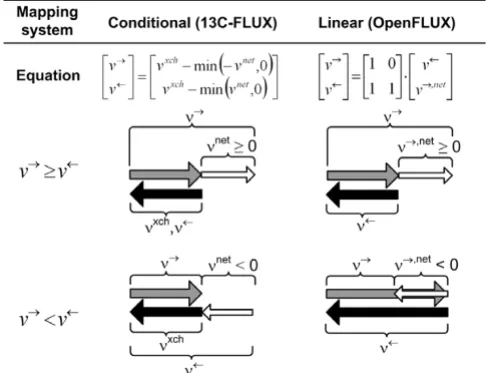
Handling bi-directional reaction using a new flux coordinate
The conventional coordinate system used to describe bi-directional reactions prevents the direct implementation of the null-space matrix [28]. In this system the net flux (vnet) and exchange flux (vxch) are used as flux coordinates,
where vxch is mapped to reverse flux (v←) if vnet is positive,
otherwise vxch is mapped to the forward flux (v→) (Figure
6).
The vnet and vxch coordinate system was created for
compac-tification purposes. As vxch can range from 0 to infinity,
which represents either irreversible or fully reversible reac-tions, vxch is compactified using (12). This has been shown
to reduce the response curvature of the 13C label with
respect to the reaction's reversibility and improve lineari-zation of the model [31]. However, such coordinate sys-tem invokes a complicated equation syssys-tem to calculate
from [28].
Here, we introduce a straightforward linear coordinate system to describe bi-directional flux: v→is expressed as v←
plus a net forward flux (v→, net), which can be positive or
negative (Figure 6). This linear transformation is directly implemented within NS with a specific structure (5), which is readily created using Gauss-Jordan elimination.
According to (5), we find that and
, i.e., v→, net of a given reversible
reac-tion is a linear combinareac-tion of . This saves us from
creating additional equation systems, as seen in the trans-formation of vxch and vnet into v→and v←. NS with the
required structure can be reproduced for all metabolic net-work configurations.
The new v→, net and v←coordinate system still allows the
compactification of v←to the same effect as compactifica-tion of vxch; since v←, like vxch, is mapped equally to the
for-ward and reverse fluxes (Figure 6). However, there is one caveat with the coordinate system adopted by OpenFLUX.
v→is forced to be a free flux after Gauss-Jordan elimina-tion if all reacelimina-tions in a branching pathway are reversible. To meet the conditions required for compactification, the null-vector associated with v←is added to the null-vector associated with v→. As a result, v→becomes v→, net, but v→, net's feasible range span both positive and negative
domains. OpenFLUX has an algorithm to detect such occurrences and performs the appropriate modification to the free flux boundary value (i.e., -UB ≤ v→, net ≤ UB).
How to set up a model in OpenFLUX – test case central metabolism
Model setup in spread-sheet mode
In OpenFLUX, the metabolic model is organized into a table consisting of seven columns, three metabolite lists and two experimental data columns (Figure 4) [see Addi-tional file 1]. The metabolic model configuration and experimental data input are gathered within a single spreadsheet interface, which contains all the information required to perform flux analysis. The parser only reads key active zones of the spreadsheet, thus other annotation information and user comments can be included in the spreadsheet. The first column contains the reaction ID. Arbitrary values can be assigned. It is important to note that the flux vector in MATLAB is organized in the same order as presented in the table (i.e., the v(1) variable rep-resents first reaction flux in the table). The second and third columns contain the reaction equations and corre-sponding atom transitions. Beforehand, it is important to distinguish reactions significant to the isotopomer bal-ance from ones that are not. The definition of the latter
v
vfree
v→ =v← +v→,net v→,net =Mnetrev⋅vfreeirr
vfreeirr
v Coordinate systems used to describe bi-directional reactions
Figure 6
Coordinate systems used to describe bi-directional reactions. The schematics under the matrix equations shows how the two coordinate systems, [vxch, vnet] and [v←,
reactions is flexible, and can accommodate floating-point coefficients, alpha-numeric metabolite names and an unlimited number of metabolite species.
Notation of metabolic reactions
The setup of the reactions relevant to isotopomer balance must obey the following rules: (1) reactant stoichiometry is always one; (2) same stoichiometric coefficients in both the reaction and atom transition equation; (3) only uni-or bi-molecular reactions. Within these rules, both nuni-or- nor-mal and scrambling reactions can be adequately described. These rules imply that scrambling occurs on the product side of the reaction equation (i.e., R6 and R8). The limitation of reaction order to bi-molecular reaction is because the parser is not capable of generating a nested Cauchy-product for higher order condensation reactions. Nonetheless, higher order reactions can be decomposed into bi-molecular reactions. The Cauchy-product is the convolution of 2 sequences A and B, where the nth
ele-ment of the product is obtained from
In the 13C tracer context, these sequences relate to the MID
of 2 EMUs involved in a condensation reaction (see [25] for an example). A Cauchy-product function has been built into OpenFLUX.
The semantics for the atom transitions in the third col-umn is based on a common convention [22,25], alpha-betic notations are used to identify a series of carbon atoms in a metabolite, and are used to describe the trans-fer of the carbon atoms from the reactant to the product [26]. As long as the convention is consistently applied, different conventions could be used to describe the order of carbon atoms, typically seen in different automated car-bon fate mapping algorithms [17]. A table of atom transi-tions in central carbon metabolism is provided [see Additional file 3]. The fourth column is used to display the flux distribution, and is only used for forward simula-tion of MIDs from the flux distribusimula-tion (hypothetical or known).
Specification of reaction types of reaction reversibility
The fifth column contains the definition of each reaction type. There are 5 reaction types, namely "F", "FR", "R", "B" and "S". Reversible reactions are decoupled into the for-ward ("FR") and reverse ("R") flux. This scheme ensures that "R" type reactions (R8) are always assigned as free fluxes. "B", "S" and "F" are used to identify the relevance of a reaction to metabolite balance, isotopomer balance or both respectively. For "F" type reactions, metabolites that are to be excluded from the isotopomer balance are marked with "X" (case insensitive) in the atom transition
equation. This is typically used for cofactors, such as NAD(P)H, FADH2 and ATP. Biomass drain fluxes (R16, R17, R18) and reactions that do not contribute to the tracer distribution (R11, R12, R13, R15) are classified as type "B" reactions. The atom transition equation for this reaction type is not required. Type "S" reaction is a con-venient approach to map a product's MID to their respec-tive precursor(s) without incurring additional degrees-of-freedom in the metabolite balance model, such as R21 for production of aspartate from oxaloacetate. This is espe-cially useful when the labelling for a metabolite can be measured, but its production rate is unknown. Aspartate production rate is typically incorporated into the oxaloac-etate biomass drain flux (R18).
Allocation of free fluxes
The sixth column contains the allocation of free fluxes for the metabolite balance model. It allows the user to specify an invariant value for a known free flux, or to allocate the preference for a reaction to be used as a free flux. For example, the drains of pyruvate, α-ketoglutarate and oxaloacetate to biomass were given the values of 0.07, 0.23 and 0.12 respectively. Additional drains for valine and lysine were added to enable subsequent model vali-dation in 13C-FLUX. Also, the activity of pyruvate uptake flux is 1 because all fluxes are normalized to this reaction. "X" is assigned to R2 as a preferred free parameter as the reaction represents the glutamate uptake flux. By conven-tion, "X" is assigned to any "R" type reaction.
Consideration of experimental noise for flux calculation
The seventh column carries the experimental standard deviations associated with each of the known fluxes. This allows a known flux value to be used either deterministi-cally, where the flux value is fixed, or as an experimental measurement, where the flux is set free and the flux value is included in the least-square analysis. Using flux values deterministically may lead to gross-measurement error, but can reduce computation time.
Listing unbalanced metabolites, simulated EMU variables and input substrates
Metabolites that are considered external to the system must be identified in order to generate a balanceable sto-ichiometric matrix. The list comprises the reactants of the system inputs and products of the system outputs. The EMU variables to be simulated were chosen to be the full carbon backbone of valine, lysine, aspartate and succi-nate. They are written in the form "metabolite name#binary number". "1" and "0" are used to indicate whether the carbon atom at a given position is to be included or omitted respectively. For example, the simu-lated valine EMU variable is written as "VALX#11111". The experimental measurements and the associated errors are listed in the same order used to list the simulated EMU variables in the model definition file. The input substrates
A B A B
n k n k
k n
D
( )
= ⋅ −=
∑
0
are pyruvate and glutamate, and are placed into another list. Generically, an input substrate is any exo-metabolite that enters the system boundary and can contribute to 13C
isotopomer distribution in metabolites. The 13C
enrich-ment of these metabolites must be known.
Error checking
Before the metabolite and isotopomer models are gener-ated, OpenFLUX inspects the model definition file for potential inconsistencies. Mainly, OpenFLUX checks for consistency in metabolite naming, stoichiometry, carbon atom length for a given metabolite, and for presence of higher order reactions or unbalanced atom transition equation. The inconsistencies are reported to the user, and must be resolved before the metabolic models are success-fully generated.
Parameter estimation and sensitivity analysis
Parameter estimation and sensitivity analysis is executed from MATLAB's command line. OpenFLUX is initialized by typing "start13OF". The user then chooses the various optimization tasks to be performed. After choosing the task, a series of command line prompts are given to the user to specify the parameters required by the optimiza-tion program. Once completed, the optimizaoptimiza-tion begins.
Additional material
Acknowledgements
We thank Oliver Frick and Esteban Marcellin for reviewing the manuscript. We also thank the University of Queensland and the Australian Institute for Bioengineering and Nanotechnology for financial support.
References
1. Lee SY, Lee DY, Kim TY: Systems biotechnology for strain improvement. Trends Biotechnol 2005, 23(7):349-358.
2. Stephanopoulos G, Aristidou AA, Nielsen JH: Metabolic engineer-ing: principles and methodologies. San Diego: Academic Press; 1998.
3. Wiechert W: 13C metabolic flux analysis. Metab Eng 2001,
3(3):195-206.
4. Szyperski T: Biosynthetically directed fractional 13C-labeling
of proteinogenic amino acids. An efficient analytical tool to investigate intermediary metabolism. Eur J Biochem 1995, 232(2):433-448.
5. Szyperski T, Glaser RW, Hochuli M, Fiaux J, Sauer U, Bailey JE, Wuthrich K: Bioreaction network topology and metabolic flux ratio analysis by biosynthetic fractional 13C labeling and
two-dimensional NMR spectroscopy. Metab Eng 1999, 1(3):189-197. 6. Christensen B, Nielsen J: Isotopomer analysis using GC-MS.
Metab Eng 1999, 1(4):282-290.
7. Fischer E, Sauer U: Metabolic flux profiling of Escherichia coli mutants in central carbon metabolism using GC-MS. Eur J Biochem 2003, 270(5):880-891.
8. Sauer U: Metabolic networks in motion: 13C-based flux anal-ysis. Mol Syst Biol 2006, 2:62.
9. Wittmann C: Metabolic flux analysis using mass spectrometry. Adv Biochem Eng Biotechnol 2002, 74:39-64.
10. Wittmann C: Fluxome analysis using GC-MS. Microb Cell Fact 2007, 6:6.
11. Khairallah M, Labarthe F, Bouchard B, Danialou G, Petrof BJ, Des Ros-iers C: Profiling substrate fluxes in the isolated working mouse heart using 13C-labeled substrates: focusing on the origin and fate of pyruvate and citrate carbons. Am J Physiol Heart Circ Physiol 2004, 286(4):H1461-1470.
12. Krömer JO, Sorgenfrei O, Klopprogge K, Heinzle E, Wittmann C: In-depth profiling of lysine-producing Corynebacterium glutami-cum by combined analysis of the transcriptome, metabo-lome, and fluxome. J Bacteriol 2004, 186(6):1769-1784. 13. Schwender J, Ohlrogge J, Shachar-Hill Y: Understanding flux in
plant metabolic networks. Curr Opin Plant Biol 2004, 7(3):309-317.
14. Wittmann C, Kim HM, Heinzle E: Metabolic network analysis of lysine producing Corynebacterium glutamicum at a minia-turized scale. Biotechnol Bioeng 2004, 87(1):1-6.
15. Fischer E, Zamboni N, Sauer U: High-throughput metabolic flux analysis based on gas chromatography-mass spectrometry derived 13C constraints. Anal Biochem 2004, 325(2):308-316. 16. Vo TD, Lim SK, Paul Lee WN, Palsson BO: Isotopomer analysis of
cellular metabolism in tissue culture: A comparative study between the pathway and network-based methods. Metabo-lomics 2006, 2(4):243-256.
17. Suthers PF, Burgard AP, Dasika MS, Nowroozi F, Van Dien S, Keasling JD, Maranas CD: Metabolic flux elucidation for large-scale models using 13C labeled isotopes. Metab Eng 2007, 9(5–
6):387-405.
18. Antoniewicz MR, Kraynie DF, Laffend LA, Gonzalez-Lergier J, Kelle-her JK, Stephanopoulos G: Metabolic flux analysis in a nonsta-tionary system: fed-batch fermentation of a high yielding strain of E. coli producing 1,3-propanediol. Metab Eng 2007, 9(3):277-292.
19. Nöh K, Gronke K, Luo B, Takors R, Oldiges M, Wiechert W: Meta-bolic flux analysis at ultra short time scale: isotopically non-stationary 13C labeling experiments. J Biotechnol 2007,
129(2):249-267.
20. Young JD, Walther JL, Antoniewicz MR, Yoo H, Stephanopoulos G: An elementary metabolite unit (EMU) based method of iso-topically nonstationary flux analysis. Biotechnol Bioeng 2008, 99(3):686-699.
21. Zamboni N, Fischer E, Sauer U: FiatFlux – a software for meta-bolic flux analysis from 13C-glucose experiments. BMC
bioin-formatics 2005, 6:209.
Additional file 1
TCA cycle metabolic model. Contains the hypothetical TCA cycle meta-bolic network, produced in the format that is readable by OpenFLUX. Information on how to set up the input substrates and the simulated out-put EMU vector are included. The EMU balance model used for flux cal-culation is also included.
Click here for file
[http://www.biomedcentral.com/content/supplementary/1475-2859-8-25-S1.xls]
Additional file 2
C. glutamicum metabolic model. Contains the C. glutamicum meta-bolic network for both wild-type and mutant strains. Model and data are reproduced from Becker et al. [39]. File includes brief instruction on how to set up the simulated output EMU vector.
Click here for file
[http://www.biomedcentral.com/content/supplementary/1475-2859-8-25-S2.xls]
Additional file 3
Atom transition equations. Contains typical reaction and atom transi-tion equatransi-tions encountered in the central metabolism. Pathways included are glycolysis (Embden-Meyerhof and Entner-Doudoroff pathways), TCA cycle (including glyoxylate shunt and anaplerotic reactions), pentose-phosphate pathway and amino acid biosynthesis from central metabolite precursors.
Click here for file
Publish with BioMed Central and every scientist can read your work free of charge
"BioMed Central will be the most significant development for disseminating the results of biomedical researc h in our lifetime."
Sir Paul Nurse, Cancer Research UK
Your research papers will be:
available free of charge to the entire biomedical community
peer reviewed and published immediately upon acceptance
cited in PubMed and archived on PubMed Central
yours — you keep the copyright
Submit your manuscript here:
http://www.biomedcentral.com/info/publishing_adv.asp
BioMedcentral 22. Wiechert W, Mollney M, Petersen S, de Graaf AA: A universal
framework for 13C metabolic flux analysis. Metab Eng 2001,
3(3):265-283.
23. Rantanen A, Rousu J, Jouhten P, Zamboni N, Maaheimo H, Ukkonen E: An analytic and systematic framework for estimating met-abolic flux ratios from 13C tracer experiments. BMC bioinfor-matics 2008, 9:266.
24. Yang TH, Frick O, Heinzle E: Hybrid optimization for 13C met-abolic flux analysis using systems parametrized by compacti-fication. BMC Syst Biol 2008, 2:29.
25. Antoniewicz MR, Kelleher JK, Stephanopoulos G: Elementary metabolite units (EMU): a novel framework for modeling isotopic distributions. Metab Eng 2007, 9(1):68-86.
26. Zupke C, Stephanopoulos G: Modeling of Isotope Distributions and Intracellular Fluxes in Metabolic Networks Using Atom Mapping Matrixes. Biotechnol Prog 1994, 10(5):489-498. 27. Schmidt K, Carlsen M, Nielsen J, Villadsen J: Modeling isotopomer
distributions in biochemical networks using isotopomer mapping matrices. Biotechnol Bioeng 1997, 55(6):831-840. 28. Wiechert W, de Graaf AA: Bidirectional reaction steps in
met-abolic networks: I. Modeling and simulation of carbon iso-tope labeling experiments. Biotechnol Bioeng 1997, 55(1):101-117.
29. van Winden WA, van Gulik WM, Schipper D, Verheijen PJ, Krabben P, Vinke JL, Heijnen JJ: Metabolic flux and metabolic network analysis of Penicillium chrysogenum using 2D [13C, 1H] COSY NMR measurements and cumulative bondomer simulation. Biotechnol Bioeng 2003, 83(1):75-92.
30. Antoniewicz MR, Kelleher JK, Stephanopoulos G: Determination of confidence intervals of metabolic fluxes estimated from stable isotope measurements. Metab Eng 2006, 8(4):324-337. 31. Möllney M, Wiechert W, Kownatzki D, de Graaf AA: Bidirectional
reaction steps in metabolic networks: IV. Optimal design of isotopomer labeling experiments. Biotechnol Bioeng 1999, 66(2):86-103.
32. Wittmann C, Heinzle E: Genealogy profiling through strain improvement by using metabolic network analysis: meta-bolic flux genealogy of several generations of lysine-produc-ing corynebacteria. Appl Environ Microbiol 2002, 68(12):5843-5859.
33. van Winden WA, Wittmann C, Heinzle E, Heijnen JJ: Correcting mass isotopomer distributions for naturally occurring iso-topes. Biotechnol Bioeng 2002, 80(4):477-479.
34. Isermann N, Wiechert W: Metabolic isotopomer labeling sys-mtes. Part II. structural flux identifiability analysis. Math Biosci 2003, 183(2):175-214.
35. van Winden WA, Heijnen JJ, Verheijen PJ, Grievink J: A priori anal-ysis of metabolic flux identifiability from (13)C-labeling data. Biotechnol Bioeng 2001, 74(6):505-516.
36. Chang Y, Suthers PF, Maranas CD: Identification of optimal measurement sets for complete flux elucidation in meta-bolic flux analysis experiments. Biotechnol Bioeng 2008, 100(6):1039-1049.
37. Wittmann C, Heinzle E: Modeling and experimental design for metabolic flux analysis of lysine-producing Corynebacteria by mass spectrometry. Metab Eng 2001, 3(2):173-191. 38. Rantanen A, Mielikainen T, Rousu J, Maaheimo H, Ukkonen E:
Plan-ning optimal measurements of isotopomer distributions for estimation of metabolic fluxes. Bioinformatics 2006, 22(10):1198-1206.
39. Becker J, Klopprogge C, Zelder O, Heinzle E, Wittmann C: Ampli-fied expression of fructose 1,6-bisphosphatase in Corynebac-terium glutamicum increases in vivo flux through the pentose phosphate pathway and lysine production on different car-bon sources. Appl Environ Microbiol 2005, 71(12):8587-8596. 40. Dauner M, Sauer U: GC-MS analysis of amino acids rapidly
pro-vides rich information for isotopomer balancing. Biotechnol Prog 2000, 16(4):642-649.
41. Kadirkamanathan V, Yang J, Billings SA, Wright PC: Markov Chain Monte Carlo Algorithm based metabolic flux distribution analysis on Corynebacterium glutamicum. Bioinformatics 2006, 22(21):2681-2687.