Open Access
Research article
Microarray analysis identifies a set of CXCR3 and CCR2 ligand
chemokines as early IFNβ-responsive genes in peripheral blood
lymphocytes
in vitro
: an implication for IFNβ-related adverse effects
in multiple sclerosis
Jun-ichi Satoh*
1,2, Yusuke Nanri
2, Hiroko Tabunoki
1and
Takashi Yamamura
2Address: 1Department of Bioinformatics, Meiji Pharmaceutical University, 2-522-1 Noshio, Kiyose, Tokyo 204-8588, Japan and 2Department of Immunology, National Institute of Neuroscience, NCNP, 4-1-1 Ogawahigashi, Kodaira, Tokyo 187-8502, Japan
Email: Jun-ichi Satoh* - [email protected]; Yusuke Nanri - [email protected]; Hiroko Tabunoki - [email protected]; Takashi Yamamura - [email protected]
* Corresponding author
Abstract
Background: A substantial proportion of multiple sclerosis (MS) patients discontinue interferon-beta (IFNβ) treatment due to various adverse effects, most of which emerge at the early phase after initiation of the treatment and then diminish with time. At present, the molecular mechanism underlying IFNβ-related adverse effects remains largely unknown. The aim of this study is to identify a comprehensive list of early IFNβ-responsive genes (IRGs) in peripheral blood mononuclear cells (PBMC) that may play a key role in induction of adverse effects.
Methods: Total RNA of PBMC exposed to 50 ng/ml recombinant human IFNβ for 3 to 24 hours
in vitro was processed for cDNA microarray analysis, followed by quantitative real-time RT-PCR analysis.
Results: Among 1,258 genes on the array, IFNβ elevated the expression of 107 and 87 genes, while it reduced the expression of 22 and 23 genes at 3 and 24 hours, respectively. Upregulated IRGs were categorized into conventional IFN-response markers, components of IFN-signaling pathways, chemokines, cytokines, growth factors, and their receptors, regulators of apoptosis, DNA damage, and cell cycle, heat shock proteins, and costimulatory and adhesion molecules. IFNβ markedly upregulated CXCR3 ligand chemokines (SCYB11, SCYB10 and SCYB9) chiefly active on effector T helper type 1 (Th1) T cells, and CCR2 ligand chemokines (SCYA8 and SCYA2) effective on monocytes, whereas it downregulated CXCR2 ligand chemokines (SCYB2, SCYB1 and IL8) primarily active on neutrophils.
Conclusion: IFNβ immediately induces a burst of gene expression of proinflammatory chemokines in vitro that have potential relevance to IFNβ-related early adverse effects in MS patients in vivo.
Published: 19 May 2006
BMC Neurology 2006, 6:18 doi:10.1186/1471-2377-6-18
Received: 20 March 2006 Accepted: 19 May 2006
This article is available from: http://www.biomedcentral.com/1471-2377/6/18
© 2006 Satoh et al; licensee BioMed Central Ltd.
Background
Multiple sclerosis (MS) is an inflammatory demyelinating disease of the central nervous system (CNS) white matter mediated by an autoimmune process, whose develop-ment is triggered by a complex interplay of both genetic and environmental factors [1]. Administration of
inter-feron-gamma (IFNγ) induced acute relapses, along with
activation of the systemic immune response [2], suggest-ing that T-lymphocytes producsuggest-ing proinflammatory T helper type 1 (Th1) cytokines play a pivotal role in the immunopathogenesis of MS. In contrast, interferon-beta (IFNβ) significantly reduces the frequency of clinical exac-erbations and delays the progression of disability in relapsing-remitting MS (RRMS), accompanied by a reduc-tion in the number of new brain lesions on MRI [3,4].
Fur-thermore, an early initiation of IFNβ delays the
conversion to clinically definite MS in the patients who experienced a first demyelinating event [5]. Although the
precise mechanism underlying therapeutic effects of IFNβ
on MS remains to be fully elucidated, previous studies proposed several possibilities, including the inhibition of Th1 cell development [6], induction of Th2 immune devi-ation [7], restordevi-ation of function of the disrupted
blood-brain barrier [8], and downregulation of IFNγ-induced
expression of class II major histocompatibility complex (MHC) molecules [9].
Although clinical benefits of IFNβ in MS are meaningful,
approximately one-third of the patients receiving IFNβ
therapy suffered from a higher or identical annual relapse rate on treatment [10]. New lesion formation on MRI
dur-ing the treatment correlates with poor response to IFNβ
[11]. Furthermore, a substantial proportion of the
patients discontinued IFNβ treatment because of various
adverse effects, including skin reactions, flu-like symp-toms, leukocytopenia, liver dysfunction, depression and amenorrhea [12]. The molecular mechanisms accounting
for IFNβ-related adverse effects remain unknown,
although most of these emerge at the early phase after ini-tiation of the treatment, and then diminish with time [12]. At present, no biologically relevant markers capable of predicting either therapeutic or detrimental responses of IFNβ in MS are available [13].
DNA microarray technology is a novel approach that allows us to systematically monitor the expression of a large number of genes. It has given new insights into the complexity of molecular interactions promoting the
autoimmune process in MS [14]. IFNβ induces a complex
pattern of gene regulation in peripheral blood mononu-clear cells (PBMC) of MS [15]. Recently, we studied the
gene expression profile of CD3+ T cells isolated from
PBMC of 13 Japanese MS patients before and after
treat-ment with IFNβ-1b by analyzing a custom cDNA
microar-ray containing a set of well-annotated, immunologically
relevant genes. IFNβ upregulates the expression of 7 IFNβ -responsive genes (IRGs) during the treatment [16]. A fol-lowing study performed on RRMS patients receiving
IFNβ-1a supported our observations [17]. More recently,
we found that the vast majority of genes expressed in
CD3+ T cells differentially between 72 untreated MS
patients and 22 healthy controls are categorized into apoptosis regulators [18]. Regarding the gene expression profile of IFNβ responders in MS, baseline levels of IL-12p35 mRNA are significantly lower in the responders [19]. Downregulation of IL-8 expression in PBMC during
IFNβ treatment distinguishes the responders from
nonre-sponders in RRMS [20]. IFNβ responders differ from
non-responders in the kinetics of expression of IRGs at 3 and 6 months after starting the treatment [21]. A three-dimen-sional model of gene triplets detected by RT-PCR analysis predicts IFNβ response status in RRMS [22]. However, all of previous observations do not clearly illustrate the molecular basis of complex biological effects of IFNβ in MS. Furthermore, no databases of immediate early IRGs in PBMC are currently available.
The present study is designed to identify a comprehensive list of immediate early IRGs in PBMC with potential rele-vance to IFNβ-related early adverse effects in MS.
Methods
Treatment of peripheral blood lymphocytes with IFNβ PBMC were isolated from heparinized blood by centrifu-gation on a Ficoll density gradient. PBMC were suspended
at 5 × 10⁶ cells/ml in RPMI 1640 medium containing 10%
fetal bovine serum, 2 mM L-glutamine, 55 µM
2-mercap-toethanol, 100 U/ml penicillin, and 100 µg/ml
strepto-mycin (culture medium). The cells were incubated in a
5%CO2/95% air incubator at 37°C for 3 hours to
charac-terize the immediate response or for 24 hours to detect the early response, in the culture medium with or without
inclusion of 50 ng/ml recombinant human IFNβ (a
spe-cific activity of = 2 × 10⁷ units/mg, PeproTech, London,
UK), 50 ng/ml recombinant human IFNγ (a specific
activ-ity of = 2 × 10⁷ units/mg, PeproTech), 50 ng/ml
recom-binant human TNFα (a specific activity of = 2 × 10⁷ units/
mg, PeproTech), or 50 ng/ml recombinant human IL-1β
(a specific activity of = 1 × 10⁷ units/mg, PeproTech). They
Quantitative real-time RT-PCR analysis
DNase-treated total RNA was processed for cDNA synthe-sis using oligo(dT)12–18 primers and SuperScript II reverse transcriptase (Invitrogen, Carlsbad, CA). cDNA was amplified by PCR in LightCycler ST300 (Roche Diagnos-tics, Tokyo, Japan) using SYBR Green I dye and the primer sets listed in Table 1. To calibrate the concentration of mRNA levels in test cDNA samples, serially-diluted puri-fied PCR products generated by conventional RT-PCR (a 10-fold dilution from 1 pg/ml to 0.0001 pg/ml) were amplified in parallel. The levels of expression of target genes were standardized against those of the glyceralde-hyde-3-phosphate dehydrogenase (G3PDH) gene detected in the identical cDNA samples. The assays were performed in triplicate measurements of the same sample and the results were expressed as the average with stand-ard error.
cDNA microarray analysis
The present study utilized a custom microarray containing duplicate spots of 1,258 cDNA immobilized on a poly-L-lysine-coated slide glass (Hitachi Life Science, Kawagoe, Saitama, Japan) [16,18,21]. They were prepared by PCR of well-annotated genes, selected from cytokines, growth fac-tors and their recepfac-tors, apoptosis regulafac-tors, oncogenes, transcription factors, cell cycle regulators and housekeep-ing genes. The complete gene list is shown in Additional file 1. Five µg of purified RNA was in vitro amplified and antisense RNA (aRNA) was processed for microarray
anal-ysis. aRNA derived from IFNβ-treated PBMC was labeled
with a fluorescent dye Cy5, while aRNA of untreated PBMC was labeled with Cy3 by reverse transcriptase reac-tion. The arrays were hybridized at 62°C for 17 hours in the hybridization buffer containing equal amounts of Cy3- or Cy5-labeled cDNA, and they were then scanned at two different photomultiplier tube (PMT) gains by the
ScanArray 5000 scanner (GSI Lumonics, Boston, MA). The data were analyzed by using the QuantArray software (GSI Lumonics). The fluorescence intensities (FI) of indi-vidual spots were quantified following global normaliza-tion between Cy3 and Cy5 signals. The average of FI of duplicate spots was calculated, then the ratio of FI of Cy5 signal versus FI of Cy3 signal exceeding 2.0 was defined as significant upregulation, whereas the ratio smaller than 0.5 was considered as substantial downregulation. The impact of inter-experiment variability was validated by analyzing a scatter plot (see Additional file 2).
The IFN-regulated expression of the genes we identified was verified by computerized search of PubMed database and IFN Stimulated Gene (ISG) database [23].
Results
Microarray analysis identified immediate early IFNβ -responsive genes in PBMC
Among 1,258 genes on the array, IFNβ treatment for 3
hours elevated the expression of 107 genes in PBMC iso-lated from a 46 year-old healthy man (the subject #1), while it reduced the expression of 22 genes (see Addi-tional files 3 and 4 for the complete list). IFNβ treatment for 24 hours upregulated 87 genes and downregulated 23 genes (see Additional files 5 and 6 for the complete list). Sixty-nine genes were upregulated at both 3 and 24 hours, while only two genes such as FOS and IL1A were down-regulated at both. The IRGs updown-regulated at both time points contained 11 in vivo IRGs reported previously by us [16], including IFIT1 (IFI56), ISG15 (G1P2), IFIT4 (IFI60), IFI27, G1P3 (IFI6-16), IRF7, ABCB2 (TAP1), ATF3, IFITM1 (IFI17), SULT1C1, and TNFAIP6, whose expression was elevated in T cells and non-T cells ex vivo, isolated from 13 RRMS patients during IFNβ treatment for 3 to 6 months. Top 20 most significant genes, either
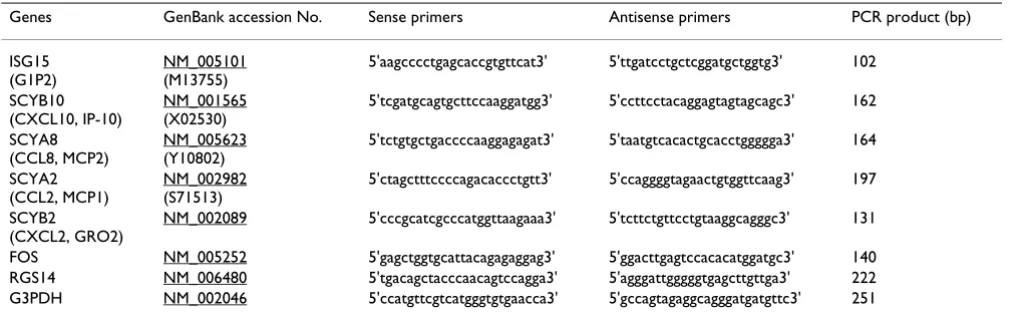
Table 1: Primers utilized for real-time RT-PCR analysis
Genes GenBank accession No. Sense primers Antisense primers PCR product (bp)
ISG15 (G1P2)
NM_005101 (M13755)
5'aagcccctgagcaccgtgttcat3' 5'ttgatcctgctcggatgctggtg3' 102
SCYB10 (CXCL10, IP-10)
NM_001565 (X02530)
5'tcgatgcagtgcttccaaggatgg3' 5'ccttcctacaggagtagtagcagc3' 162
SCYA8 (CCL8, MCP2)
NM_005623 (Y10802)
5'tctgtgctgaccccaaggagagat3' 5'taatgtcacactgcacctggggga3' 164
SCYA2 (CCL2, MCP1)
NM_002982 (S71513)
5'ctagctttccccagacaccctgtt3' 5'ccaggggtagaactgtggttcaag3' 197
SCYB2
(CXCL2, GRO2)
NM_002089 5'cccgcatcgcccatggttaagaaa3' 5'tcttctgttcctgtaaggcagggc3' 131
FOS NM_005252 5'gagctggtgcattacagagaggag3' 5'ggacttgagtccacacatggatgc3' 140
RGS14 NM_006480 5'tgacagctacccaacagtccagga3' 5'agggattgggggtgagcttgttga3' 222
G3PDH NM_002046 5'ccatgttcgtcatgggtgtgaacca3' 5'gccagtagaggcagggatgatgttc3' 251
upregulated or downregulated, are listed in Table 2 and Table 3, respectively. All of top 20 upregulated genes were found as known IRGs identified in various cell types by searching through PubMed and ISG databases.
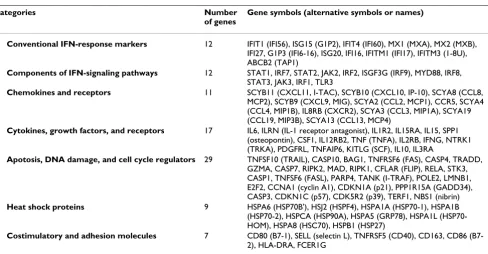
The upregulated IRGs in the complete lists (see Additional files 3 and 5) were classified into several functional cate-gories following; (i) conventional IFN-response markers (n = 12), (ii) components of classical and Toll-like recep-tor (TLR)-dependent IFN-signaling pathways (n = 12),
(iii) chemokines and their receptors (n = 11), (iv) cytokines, growth factors and their receptors (n = 17), (v) apoptosis, DNA damage, and cell cycle regulators (n = 29), (vi) heat shock proteins (n = 9), and (vii) costimula-tory and adhesion molecules (n = 7) (Table 4). The chem-okine and chemchem-okine receptor group included both CXC and CC chemokines and their receptors, such as SCYB11 (CXCL11, I-TAC), SCYB10 (CXCL10, IP-10), SCYA8 (CCL8, MCP2), SCYB9 (CXCL9, MIG), SCYA2 (CCL2, MCP1), CCR5, SCYA4 (CCL4, MIP1B), IL8RB (CXCR2),
Table 2: Top 20 upregulated genes in PBMC following exposue to IFNβ
No. Cy5/Cy3 ratio Symbol GenBank Gene name
at 3 hours
1 188.50 IFIT1 X03557 interferon-induced protein with tetratricopeptide repeats 1 (IFI56) 2 149.82 SCYB11 AF030514 chemokine (C-X-C motif) ligand 11 (CXCL11, IP-9, I-TAC)
3 81.81 ISG15 M13755 interferon-stimulated gene ISG15 (G1P2)
4 67.84 IFIT4 AF083470 interferon-induced protein with tetratricopeptide repeats 4 (IFI60)
5 66.38 MX1 M30817 myxovirus resistance protein 1 (MXA)
6 64.43 SCYB10 X02530 chemokine (C-X-C motif) ligand 10 (CXCL10, IP-10)
7 55.01 SCYA8 Y10802 chemokine (C-C motif) ligand 8 (CCL8, MCP2)
8 36.88 SCYB9 X72755 chemokine (C-X-C motif) ligand 9 (CXCL9, MIG)
9 35.14 TNFSF10 U37518 tumor necrosis factor superfamily, member 10 (TRAIL)
10 32.86 MX2 M30818 myxovirus resistance protein 2 (MXB)
11 21.99 IFI27 X67325 interferon alpha-inducible protein 27
12 21.98 G1P3 X02492 interferon alpha-inducible protein (IFI6-16), isoform a
13 19.26 ISG20 U88964 interferon-stimulated gene ISG20
14 19.12 STAT1 M97935 signal transducer and activator of transcription 1, isoform alpha
15 13.71 IRF7 U53830 interferon-regulatory factor 7, isoform alpha
16 13.44 CCNA1 U66838 cyclin A1
17 12.72 IL6 M14584 interleukin 6
18 10.86 IL1RN X53296 interleukin 1 receptor antagonist, isoform 1
19 10.47 SCYA2 S71513 chemokine (C-C motif) ligand 2 (CCL2, MCP1)
20 9.91 STAT2 M97934 signal transducer and activator of transcription 2
at 24 hours
1 193.19 SCYA8 Y10802 chemokine (C-C motif) ligand 8 (CCL8, MCP2)
2 124.77 IFIT1 X03557 interferon-induced protein with tetratricopeptide repeats 1 (IFI56)
3 107.21 IFI27 X67325 interferon alpha-inducible protein 27
4 70.51 ISG15 M13755 interferon-stimulated gene ISG15 (G1P2)
5 53.22 SCYB11 AF030514 chemokine (C-X-C motif) ligand 11 (CXCL11, IP-9, I-TAC)
6 38.07 MX1 M30817 myxovirus resistance protein 1 (MXA)
7 37.95 IFIT4 AF083470 interferon-induced protein with tetratricopeptide repeats 4 (IFI60)
8 31.56 SCYB10 X02530 chemokine (C-X-C motif) ligand 10 (CXCL10, IP-10)
9 23.65 G1P3 X02492 interferon alpha-inducible protein (IFI6-16), isoform a
10 23.10 TNFSF10 U37518 tumor necrosis factor superfamily, member 10 (TRAIL)
11 21.31 MX2 M30818 myxovirus resistance protein 2 (MXB)
12 20.68 PDGFRL D37965 platelet-derived growth factor receptor-like protein
13 15.95 CD80 M27533 CD80 antigen (B7-1)
14 13.99 IRF7 U53830 interferon-regulatory factor 7, isoform alpha
15 13.93 IL1RN X53296 interleukin 1 receptor antagonist, isoform 1
16 13.31 ISG20 U88964 interferon-stimulated gene ISG20
17 11.81 IFITM1 J04164 interferon induced transmembrane protein 1 (IFI17)
18 8.67 SCYA2 S71513 chemokine (C-C motif) ligand 2 (CCL2, MCP1)
19 8.54 IL6 M14584 interleukin 6
20 8.51 IL8RB L19593 interleukin 8 receptor beta (CXCR2)
SCYA3 (CCL3, MIP1A), SCYA19 (CCL19, MIP3B) and SCYA13 (CCL13, MCP4). It is worthy to note that both CXCR3 ligand chemokines (SCYB11, SCYB10 and SCYB9) and CCR2 ligand chemokines (SCYA10 and SCYA2) were clustered in top 20 genes greatly elevated at 3 and 24 hours of IFNβ treatment (Table 2). With respect to top 20 downregulated genes, four genes such as SCYB2 (CXCL2, GRO2), SCYB1 (CXCL1, GRO1), IL8 (SCYB8, CXCL8), and SCYA24 (eotaxin-2) were categorized into the chemokine group (Table 3). Among them, SCYB2, SCYB1 and IL8, whose expression was reduced
immedi-ately at 3 hours of IFNβ treatment, belong to CXCR2 lig-and chemokines. Although the analysis in the present study was a single microarray for each sample design, the results from two additional subjects, including a 28 year-old healthy man (the subject #2) and a 27 year-year-old
woman with RRMS who was a dropout of IFNβ treatment
due to induction of frequent severe relapses (the subject #4), verified the observations of immediate early induc-tion of CXCR3 ligand and CCR2 ligand chemokine genes
in PBMC by exposure to IFNβ, supporting the
reproduci-bility of these results (see Additional file 7).
Table 3: Top 20 downregulated genes in PBMC following exposue to IFNβ
No. Cy5/Cy3 ratio Symbol GenBank Gene name
at 3 hours
1 0.29 RGS14 NM_006480 regulator of G-protein signaling 14
2 0.30 FOS NM_005252 cellular oncogene c-fos
3 0.31 SCYB2 NM_002089 chemokine (C-X-C motif) ligand 2 (GRO2, MIP2A)
4 0.41 PPARG2 U63415 peroxisome proliferative activated receptor gamma, isoform 2
5 0.41 TNFSF11 NM_003701 tumor necrosis factor ligand superfamily, member 11 (RANKL), isoform 1
6 0.42 ABCC4 NM_005845 ATP-binding cassette, subfamily C, member 4 (MRP4)
7 0.42 MERTK NM_006343 c-mer proto-oncogene tyrosine kinase
8 0.42 TGFBR3 NM_003243 transforming growth factor beta receptor III (betaglycan)
9 0.44 ATP2B1 J04027 ATPase, Ca++ transporting, plasma membrane 1, isoform 1b
10 0.45 SCYB1 NM_001511 chemokine (C-X-C motif) ligand 1 (GRO1, MGSA)
11 0.45 IL8 NM_000584 interleukin 8 (SCYB8, CXCL8)
12 0.45 TRAF5 NM_004619 TNF receptor-associated factor 5, variant 1
13 0.47 CD3G NM_000073 CD3G antigen, gamma polypeptide
14 0.47 IL1A NM_000575 interleukin 1 alpha
15 0.47 TCFL5 NM_006602 transcription factor-like 5
16 0.48 LAT AF036905 linker for activation of T cells, isoform b
17 0.48 HNMT U08092 histamine N-methyltransferase, isoform 1
18 0.48 SLC3A1 NM_000341 solute carrier family 3, member 1
19 0.49 MGST1 NM_145764 microsomal glutathione S-transferase 1, variant 1d
20 0.49 TNFSF8 NM_001244 tumor necrosis factor ligand superfamily, member 8 (CD30L)
at 24 hours
1 0.18 ABCC3 AF083552 ATP-binding cassette, subfamily C, member 3, isoform MRP3
2 0.20 FOS NM_005252 cellular oncogene c-fos
3 0.30 ALDH2 NM_000690 aldehyde dehydrogenase 2 family
4 0.30 TPST1 NM_003596 tyrosylprotein sulfotransferase 1
5 0.31 CD9 NM_001769 CD9 antigen
6 0.34 NRG1 NM_013962 neuregulin 1, isoform GGF2
7 0.35 TLR5 NM_003268 toll-like receptor 5
8 0.36 PTGS1 NM_000962 prostaglandin-endoperoxide synthase 1 (COX1), isoform 1
9 0.37 MGST2 NM_002413 microsomal glutathione S-transferase 2
10 0.38 ITGAM NM_000632 integrin, alpha M (CD11B, MAC-1, CR3A)
11 0.38 SCYA24 NM_002991 chemokine (C-C motif) ligand 24 (eotaxin 2)
12 0.38 CYP27A1 NM_000784 cytochrome P450, family 27, subfamily A, polypeptide 1 (CTX)
13 0.39 ALDH1A1 NM_000689 aldehyde dehydrogenase 1 family, member A1
14 0.39 MYCL1 NM_005376 v-myc myelocytomatosis viral oncogene homolog 1 (LMYC)
15 0.41 ATP6AP2 NM_005765 ATPase, H+ transporting, lysosomal accessory protein 2 (ATP6M8-9)
16 0.44 PRKCG NM_002739 protein kinase C gamma
17 0.45 ATP2B1 J04027 ATPase, Ca++ transporting, plasma membrane 1, isoform 1b
18 0.46 AP1S2 NM_003916 adaptor-related protein complex 1, sigma 2 subunit
19 0.47 NR6A1 NM_001489 nuclear receptor subfamily 6, group A, member 1 (RTR), isoform 2
20 0.47 GCG NM_173916 glucagon
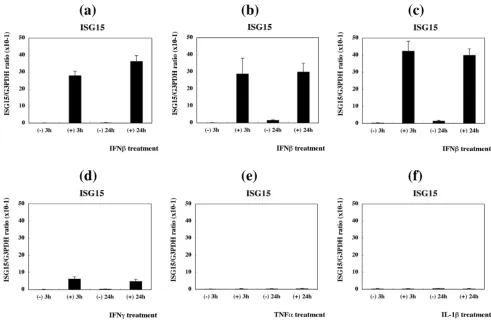
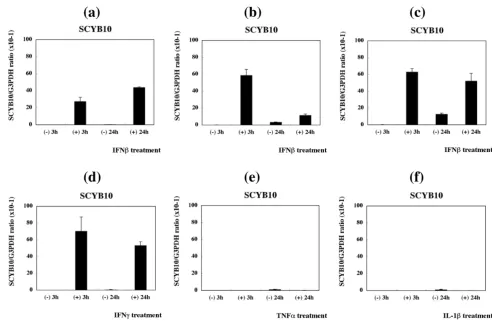
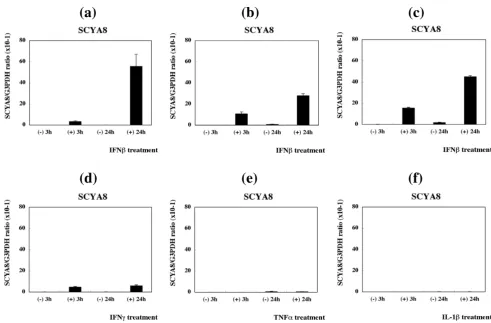
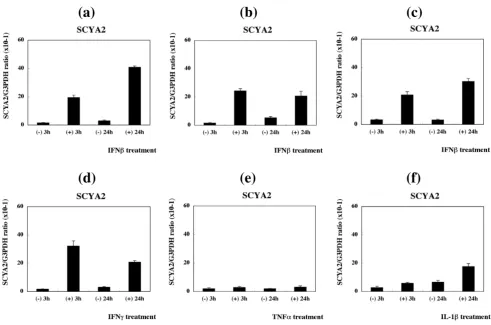
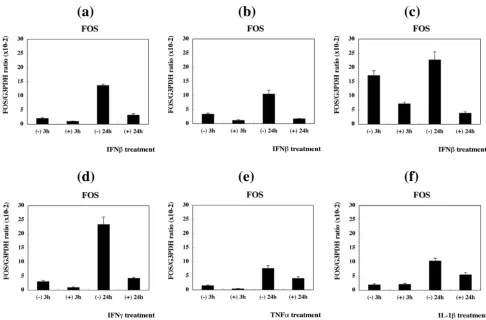
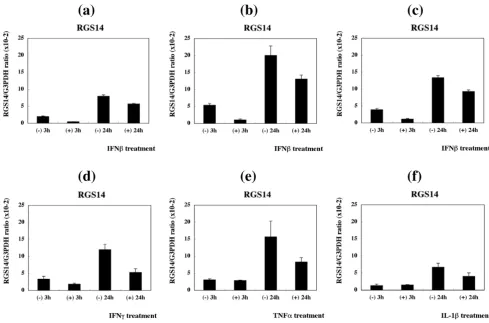
Real-time RT-PCR analysis validated IFNβ-regulated expression of IRGs identified by microarray analysis Although the microarray we utilized contains total 64 spots of the G3PDH gene (see Additional file 1), G3PDH was neither identified as a significantly upregulated nor a downregulated gene in the microarray analysis, suggesting that G3PDH represents a reliable housekeeping gene in gene expression analysis of PBMC following treatment with IFNβ. Therefore, quantitative real-time RT-PCR anal-ysis was performed by evaluating the levels of expression of target genes standardized against those of G3PDH detected in the identical cDNA samples. It verified the key observations of microarray analysis, such as marked upregulation of ISG15, the prototype of IRGs (Figure 1a– c), and great elevation of SCYB10, SCYA8 and SCYA2
(Fig-ures 2, 3, 4a–c) in PBMC at both 3 and 24 hours of IFNβ
treatment. Furthermore, the quantitative analysis con-firmed substantial downregulation of FOS at both time points (Figure 5a–c), and RGS14 and SCYB2 predomi-nantly at 3 hours (Figures 6, 7a–c). Exposure of PBMC to
IFNγ greatly elevated the expression of SCYB10 and
SCYA2, and to a lessor extent, ISG15 and SCYA8 at both time points (Figures 1, 2, 3, 4d), suggesting a functional overlap in induction of CXCR3 ligand and CCR2 ligand chemokines between type I and type II IFN signaling path-ways. In contrast, TNFα and IL-1β the prototype of proin-flammatory cytokines, did not at all elevate the levels of expression of ISG15, SCYB10 or SCYA8 (Figures 1, 2, 3e, f), while IL-1β significantly (p = 0.041 at 3 hours and p =
0.004 at 24 hours by two-sided paired t-test) but TNFα
only marginally (p = 0.2102 at 3 hours and p = 0.0825 at 24 hours by two-sided paired t-test) upregulated SCYA2 expression (Figure 4e, f). Treatment with IFNγ, TNFα or
IL-1β reduced the levels of FOS and RGS14 substantially
at 24 hours (Figures 5, 6d–f). IFNγ reduced the expression of SCYB2, whereas TNFα and IL-1β elevated its levels at both time points, suggesting differential regulation of SCYB2 gene expression in PBMC by exposure to distinct cytokines (Figure 7d–f). The IFNβ-regulated gene expres-sion pattern was similar among PBMC derived from three distinct healthy subjects #1, #2 and #3, supporting the reproducibility of these observations (Figures 1, 2, 3, 4, 5, 6, 7a–c).
Table 4: Functional classification of IFNβ-upregulated genes in PBMC
Categories Number
of genes
Gene symbols (alternative symbols or names)
1 Conventional IFN-response markers 12 IFIT1 (IFI56), ISG15 (G1P2), IFIT4 (IFI60), MX1 (MXA), MX2 (MXB), IFI27, G1P3 (IFI6-16), ISG20, IFI16, IFITM1 (IFI17), IFITM3 (1-8U), ABCB2 (TAP1)
2 Components of IFN-signaling pathways 12 STAT1, IRF7, STAT2, JAK2, IRF2, ISGF3G (IRF9), MYD88, IRF8, STAT3, JAK3, IRF1, TLR3
3 Chemokines and receptors 11 SCYB11 (CXCL11, I-TAC), SCYB10 (CXCL10, IP-10), SCYA8 (CCL8, MCP2), SCYB9 (CXCL9, MIG), SCYA2 (CCL2, MCP1), CCR5, SCYA4 (CCL4, MIP1B), IL8RB (CXCR2), SCYA3 (CCL3, MIP1A), SCYA19 (CCL19, MIP3B), SCYA13 (CCL13, MCP4)
4 Cytokines, growth factors, and receptors 17 IL6, ILRN (IL-1 receptor antagonist), IL1R2, IL15RA, IL15, SPP1 (osteopontin), CSF1, IL12RB2, TNF (TNFA), IL2RB, IFNG, NTRK1 (TRKA), PDGFRL, TNFAIP6, KITLG (SCF), IL10, IL3RA
5 Apotosis, DNA damage, and cell cycle regulators 29 TNFSF10 (TRAIL), CASP10, BAG1, TNFRSF6 (FAS), CASP4, TRADD, GZMA, CASP7, RIPK2, MAD, RIPK1, CFLAR (FLIP), RELA, STK3, CASP1, TNFSF6 (FASL), PARP4, TANK (I-TRAF), POLE2, LMNB1, E2F2, CCNA1 (cyclin A1), CDKN1A (p21), PPP1R15A (GADD34), CASP3, CDKN1C (p57), CDK5R2 (p39), TERF1, NBS1 (nibrin)
6 Heat shock proteins 9 HSPA6 (HSP70B'), HSJ2 (HSPF4), HSPA1A (HSP70-1), HSPA1B 2), HSPCA (HSP90A), HSPA5 (GRP78), HSPA1L (HSP70-HOM), HSPA8 (HSC70), HSPB1 (HSP27)
7 Costimulatory and adhesion molecules 7 CD80 1), SELL (selectin L), TNFRSF5 (CD40), CD163, CD86 (B7-2), HLA-DRA, FCER1G
Real-time RT-PCR analysis of ISG15 expression in PBMC
Figure 1
Real-time RT-PCR analysis of ISG15 expression in PBMC. PBMC derived from three distinct healthy subjects numbered #1 (a 46 year-old man), #2 (a 28 year-old man), and #3 (a 42 year-old woman) were incubated for 3 hours or 24 hours in the culture medium with (+) or without (-) inclusion of recombinant human IFNβ, IFNγ, TNFα or IL-1β at a concentration of 50 ng/ml each. cDNA was processed for real-time PCR analysis using specific primers listed in Table 1. The levels of expression of ISG15 are standardized against those of the glyceraldehyde-3-phosphate dehydrogenase (G3PDH) gene detected in identical cDNA samples. The assays were performed in triplicate measurements of the same sample, and the results were expressed as the average with standard error. The panels represent the expression of ISG15 in (a) #1, IFNβ; (b) #2, IFNβ; (c) #3, IFNβ; (d) #1, IFNγ; (e) #1, TNFα; and (f) #1, IL-1β.
(a)
(b)
(c)
Real-time RT-PCR analysis of SCYB10 expression in PBMC
Figure 2
Real-time RT-PCR analysis of SCYB10 expression in PBMC. See the footnote of Figure 1. The panels represent the expression of SCYB10 in (a) #1, IFNβ; (b) #2, IFNβ; (c) #3, IFNβ; (d) #1, IFNγ; (e) #1, TNFα; and (f) #1, IL-1β.
(a)
(b)
(c)
Real-time RT-PCR analysis of SCYA8 expression in PBMC
Figure 3
Real-time RT-PCR analysis of SCYA8 expression in PBMC. See the footnote of Figure 1. The panels represent the expression of SCYA8 in (a) #1, IFNβ; (b) #2, IFNβ; (c) #3, IFNβ; (d) #1, IFNγ; (e) #1, TNFα; and (f) #1, IL-1β.
(a)
(b)
(c)
Real-time RT-PCR analysis of SCYA2 expression in PBMC
Figure 4
Real-time RT-PCR analysis of SCYA2 expression in PBMC. See the footnote of Figure 1. The panels represent the expression of SCYA2 in (a) #1, IFNβ; (b) #2, IFNβ; (c) #3, IFNβ; (d) #1, IFNγ; (e) #1, TNFα; and (f) #1, IL-1β.
(a)
(b)
(c)
Real-time RT-PCR analysis of FOS expression in PBMC
Figure 5
Real-time RT-PCR analysis of FOS expression in PBMC. See the footnote of Figure 1. The panels represent the expression of FOS in (a) #1, IFNβ; (b) #2, IFNβ; (c) #3, IFNβ; (d) #1, IFNγ; (e) #1, TNFα; and (f) #1, IL-1β.
(a)
(b)
(c)
Real-time RT-PCR analysis of RGS14 expression in PBMC
Figure 6
Real-time RT-PCR analysis of RGS14 expression in PBMC. See the footnote of Figure 1. The panels represent the expression of RGS14 in (a) #1, IFNβ; (b) #2, IFNβ; (c) #3, IFNβ; (d) #1, IFNγ; (e) #1, TNFα; and (f) #1, IL-1β.
(a)
(b)
(c)
Discussion
IFNs are a family of cytokines that mediates antiviral, anti-proliferative and immunoregulatory activities. Type I
IFNs, IFNα and β, are produced principally by
virus-infected host cells, whereas type II IFN, IFNγ, is produced by activated T cells and natural killer (NK) cells. Type I IFNs activate JAK protein tyrosine kinases associated with the cell surface receptors for IFNs, leading to formation of the complex of signal transducer and activator of tran-scription (STAT) molecules with the IFN regulatory factor (IRF) family of transcription factors. The STAT/IRF com-plex translocates into the nucleus, and binds to the DNA sequences termed the IFN-stimulated response element (ISRE) or the IRF-recognition element (IRE). This binding subsequently activates transcription of a wide variety of IFN-responsive genes (IRGs) as well as the genes of type I and type II IFNs, leading to the biological responses trig-gered by the IFNs [24]. Both type I and type II IFNs enhance the expression of class I and class II MHC mole-cules [25]. Among nine distinct IRFs, IRF7 and IRF3 play a central role in induction of type I IFN genes via the
virus-activated MYD88-independent pathway or Toll-like recep-tor (TLR)7, 8 or 9-activated MYD88-dependent pathway [26], while IRF1 plays more active roles in induction of IFNγ-target genes essential for Th1-type immune response [25].
The present study by analyzing DNA microarray character-ized a comprehensive list of immediate early IRGs in PBMC in vitro. Following a 3 to 24 hour-exposure to IFNβ, upregulated genes greatly outnumbered downregulated genes. All top 20 upregulated genes represent known IRGs previously identified in various cell types. The upregu-lated IRGs of PBMC were classified into several functional categories. The list included not only conventional IFN-response markers and components of IFN-signaling path-ways, but also contained many proinflammatory chemok-ines and cytokchemok-ines. This is surprising because IFNβ acts principally as an anti-Th1, anti-inflammatory cytokine [6,7]. By analyzing global gene expression profile, the present study for the first time showed that IFNβ induced a burst of gene expression of CXCR3 ligand chemokines
Real-time RT-PCR analysis of SCYB2 expression in PBMC
Figure 7
Real-time RT-PCR analysis of SCYB2 expression in PBMC. See the footnote of Figure 1. The panels represent the expression of SCYB2 in (a) #1, IFNβ; (b) #2, IFNβ; (c) #3, IFNβ; (d) #1, IFNγ; (e) #1, TNFα; and (f) #1, IL-1β.
(a)
(b)
(c)
(SCYB11, SCYB10 and SCYB9) and CCR2 ligand chemok-ines (SCYA8 and SCYA2), which was verified by quantita-tive real-time RT-PCR analysis. The chemokine genes actually have ISRE or IRE in the promoter regions, indicat-ing direct targets of IFNβ[27,28].
CXCR3 is expressed predominantly on activated Th1 T cells, while CCR2 is expressed chiefly on monocytes [29]. The number of CXCR3+ T cells is increased in the blood of
RRMS, and they accumulate in perivascular infiltrates in active MS lesions [30,31], while SCYB10 (IP-10) and SCYB9 (MIG) are detected in the cerebrospinal fluid (CSF) of RRMS at acute relapse and expressed in reactive astrocytes in active MS lesions [31,32]. SCYA2 (MCP1) and SCYA8 (MCP2) immunoreactivities are also identi-fied in reactive astrocytes in active demyelinating lesions of MS [33,34]. These observations suggest that CXCR3, CCR2, and their ligand chemokines positively regulate active inflammation in MS. Although the precise cell types expressing CXCR3 ligand and CCR2 ligand chemokines in PBMC in response to IFNβ remain to be characterized, the chemokine burst plays a central role in rapid activation and systemic recruitment of Th1 T cells and monocytes immediately after initiation of IFNβ treatment. A recent
study showed that IFNβ promotes trafficking of mouse
leukocytes by regulating a specific set of chemokines [35]. However, concurrent upregulation of a set of CXCR3 and CCR2 ligand chemokines has not previously been
reported in MS patients on a long-term IFNβ treatment
[16,17,20-22], suggesting that this phenomenon is an immediate early but transient event in vivo. IFNβ immedi-ately reduced the expression of RGS14 (the most signifi-cantly downregulated gene at 3 hours; see Table 3), a member of the regulator of G protein signaling (RGS) gene family that acts as a negative regulator of G protein-coupled receptor (GPCR) signaling. Since all chemokine
receptors are GPCR, IFNβ-induced downregulation of
RGS14 might facilitate chemokine responsiveness in the cells expressing RGS14 [36,37]. Much less is known about
the mechanism for regulation of IFNβ-repressed genes
[38]. We identified IL-8 as one of IFNβ-repressed genes in
PBMC (Table 3). IFNβ inhibits the transcription of IL-8
gene, possibly by binding of NF-κB repressing factor
(NRF) to a negative regulatory element of the IL-8 pro-moter [39]. Serum IL-8 levels and IL-8 secretion from PBMC are elevated in untreated MS, and then reduced fol-lowing IFNβ therapy [40]. Downregulation of IL-8 expres-sion in PBMC during IFNβ treatment provides a predictive indicator for the responders in RRMS [20].
IFNβ also promptly upregulated a variety of
proinflam-matory cytokines, such as IL-6, IL-15, osteopontin, TNFα,
and IFNγ in PBMC (Table 4). IFNβ promotes production
of TNFα and IFNγ in unstimulated PBMC but decreases
their levels in preactivated PBMC [41-43]. IFNβ increases
the number of IFNγ-secreting cells in vivo at the early period of the treatment [44]. Most importantly,
proin-flammatory cytokines and chemokines induced by IFNβ
have relevance to treatment-related early adverse effects. There exists a close relationship between flu-like symp-toms and increased levels of IL-6 [45]. A single injection of IFNβ induces a transient burst of SCYB10 (IP-10) in the plasma of RRMS patients, which correlates with an
inci-dence of flu-like symptoms [46]. IFNβ enhances the
expression of CD80, SCYB10 (IP-10) and SCYA2 (MCP1) in situ at sites of injection, leading to chemotaxis of lym-phocytes and monocytes in the lesions of skin reaction [47-49]. We found that IFNβ aberrantly regulated the lev-els of expression of several cytochrome P450 (CYP) enzymes (see Additional files 3,4,5,6). Type I IFN reduces the activity of CYP enzymes that metabolize various endogenous and exogenous substrates, probably leading to an increase in the potential for IFN-related hepatotox-icity [50].
Finally, the list of IRGs included various apoptosis regula-tors and HSP family members. ISRE-like sequences are identified in the regulatory element of CASP1, CASP4, CASP8, TNFRSF6 (FAS), TNFSF6 (FASL) and TNFSF10
(TRAIL), suggesting that IFNβ acts as a proapototic
cytokine [51,52]. A recent study showed that early and
sustained induction of TRAIL provides a marker for IFNβ
treatment response in MS [53]. Furthermore, IFNβ
-induc-ible apoptosis regulators play an immunoregulatory role. TNFR1-associated via death domain (TRADD) inhibits IFNγ-induced STAT1α activation [54]. Receptor-interact-ing serine-theronine kinase 1 (RIPK1) regulates TLR3-independent viral double-stranded RNA-induced type I IFN production [55]. Because HSPs in general act as an anti-apoptotic defender, the induction of HSP gene expression might occur as a counterbalance against upreg-ulation of proapoptotic regulators. Alternatively, IRGs
could directly enhance HSP expression. IFNβ-induced
STAT1, by interacting with heat shock factor-1 (HSF1),
activates the HSP70 and HSP90β gene promoters [56].
Conclusion
Microarray analysis showed that IFNβ immediately
induces a burst of gene expression of proinflammatory chemokines and cytokines in vitro that have potential rel-evance to IFNβ-related early adverse effects in MS patients in vivo.
Abbreviations
MS = multiple sclerosis; IFNβ = interferon-beta; IRGs =
IFNβ-responsive genes; PBMC = peripheral blood
Toll-like receptor; STAT = signal transducer and activator of transcription; IRF = interferon regulatory factor; ISRE = interferon-stimulated response element; IRE = interferon regulatory factor-recognition element; HSPs = heat shock proteins; CSF = cerebrospinal fluid; GPCR = G protein-coupled receptor; RGS = regulator of G protein signaling.
Competing interests
The author(s) declare that they have no competing inter-ests.
Authors' contributions
JS, YN and HT carried out DNA microarray and real-time RT-PCR analysis, and JS drafted the manuscript. TY partic-ipated in the design of the study and helped to draft the manuscript. All authors read and approved the final man-uscript.
Additional material
Acknowledgements
This work was supported by grants to J-IS from Research on Psychiatric and Neurological Diseases and Mental Health, the Ministry of Health, Labour and Welfare of Japan (H17-020) and Research on Health Sciences Focusing on Drug Innovation, the Japan Health Sciences Foundation (KH21101), and by the Grant-in-Aid for Scientific Research, the Ministry of Education, Cul-ture, Sports, Science and Technology of Japan (B-18300118). The authors would thank Dr. Jun Tsuyuzaki, Department of Neurology, Komoro Kosei Hospital, Nagano, Japan for introducing us the patients.
References
1. Sospedra M, Martin R: Immunology of multiple sclerosis. Annu Rev Immunol 2005, 23:683-747.
2. Panitch HS, Hirsch RL, Schindler J, Johnson KP: Treatment of mul-tiple sclerosis with g amma interferon: Exacerbations
associ-Additional File 1
The gene list of cDNA microarray utilized in the present study. The complete gene list of cDNA microarray utilized in the present study is shown. It includes 1,258 well-annotated genes, selected from cytokines, growth factors and their receptors, apoptosis regulators, oncogenes, tran-scription factors, cell cycle regulators and housekeeping genes.
Click here for file
[http://www.biomedcentral.com/content/supplementary/1471-2377-6-18-S1.xls]
Additional File 2
Scatter plots of three distinct microarray experiments. The figure rep-resents a scatter plot exhibiting the comparison between the fluorescence intensity (FI) of Cy5 signals in the longitudinal axis and FI of Cy3 signals in the horizontal axis. (a) the subject #1 (a 46 year-old healthy man), (b) the subject #2 (a 28 year-old healthy man), and (c) the subject #4 (a 27 year-old woman with RRMS who was a dropout of IFNβ treatment due to induction of frequent severe relapses).
Click here for file
[http://www.biomedcentral.com/content/supplementary/1471-2377-6-18-S2.ppt]
Additional File 3
The complete list of upregulated genes in PBMC following exposure to IFNβ for 3 hours. Upregulated genes in PBMC of the subject #1 (a 46 year-old healthy man) by a 3 hour-exposure to 50 ng/ml recombinant human IFNβ are listed with Cy5/Cy3 signal intensity ratio, gene symbol, GenBank accession number, and gene name. In vivo IRG in T cells and non-T cells of RRMS patients reported previously (Ref. 16) are under-lined.
Click here for file
[http://www.biomedcentral.com/content/supplementary/1471-2377-6-18-S3.xls]
Additional File 4
The complete list of downregulated genes in PBMC following exposure to IFNβ for 3 hours. Downregulated genes in PBMC of the subject #1 (a 46 year-old healthy man) by a 3 hour-exposure to 50 ng/ml recombinant human IFNβ are listed with Cy5/Cy3 signal intensity ratio, gene symbol, GenBank accession number, and gene name.
Click here for file
[http://www.biomedcentral.com/content/supplementary/1471-2377-6-18-S4.xls]
Additional File 5
The complete list of upregulated genes in PBMC following exposure to IFNβ for 24 hours. Upregulated genes in PBMC of the subject #1 (a 46 year-old healthy man) by a 24 hour-exposure to 50 ng/ml recombinant human IFNβ are listed with Cy5/Cy3 signal intensity ratio, gene symbol, GenBank accession number, and gene name. In vivo IRG in T cells and non-T cells of RRMS patients reported previously (Ref. 16) are under-lined.
Click here for file
[http://www.biomedcentral.com/content/supplementary/1471-2377-6-18-S5.xls]
Additional File 6
The complete list of downregulated genes in PBMC following exposure to IFNβ for 24 hours. Downregulated genes in PBMC of the subject #1 (a 46 year-old healthy man) by a 24 hour-exposure to 50 ng/ml recom-binant human IFNβ are listed with Cy5/Cy3 signal intensity ratio, gene symbol, GenBank accession number, and gene name.
Click here for file
[http://www.biomedcentral.com/content/supplementary/1471-2377-6-18-S6.xls]
Additional File 7
Top 20 upregulated genes in PBMC following exposure to IFNβ for 3 hours: two additional subjects. Upregulated genes in PBMC of the sub-ject #2 (a 28 year-old healthy man) and #4 (a 27 year-old woman with RRMS who was a dropout of IFNβ treatment due to induction of frequent severe relapses) following a 3 hour-exposure to 50 ng/ml recombinant human IFNβ are listed with Cy5/Cy3 signal intensity ratio, gene symbol, and gene name. Both CXCR3 ligand (yellow) and CCR2 ligand (blue) chemokines are highlighted.
Click here for file
ated with activation of the immune function. Neurology 1987, 37:1097-1102.
3. The IFNB Multiple Sclerosis Study Group: Interferon beta-1b is effective in relapsing-remitting multiple sclerosis. I. Clinical results of a multicenter, randomized, double-blind, placebo-controlled trial. Neurology 1993, 43:655-661.
4. Jacobs LD, Cookfair DL, Rudick RA, Herndon RM, Richert JR, Salazar AM, Fischer JS, Goodkin DE, Granger CV, Simon JH, Alam JJ, Bar-toszak DM, Bourdette DN, Braiman J, Brownscheidle CM, Coats ME, Cohan SL, Dougherty DS, Kinkel RP, Mass MK, Munschauer FE 3rd, Priore RL, Pullicino PM, Scherokman BJ, Whitham RH, The Multiple Sclerosis Collaborative Research Group (MSCRG): Intramuscular interferon beta-1a for disease progression in relapsing multi-ple sclerosis. Ann Neurol 1996, 39:285-294.
5. Jacobs LD, Beck RW, Simon JH, Kinkel RP, Brownscheidle CM, Mur-ray TJ, Simonian NA, Slasor PJ, Sandrock AW: Intramuscular inter-feron beta-1a therapy initiated during a first demyelinating event in multiple sclerosis. CHAMPS Study Group. N Engl J Med 2000, 343:898-904.
6. McRae BL, Semnani RT, Hayes MP, van Seventer GA: Type I IFNs inhibit human dendritic cell IL-12 production and Th1 cell development. J Immunol 1998, 60:4298-4304.
7. Kozovska ME, Hong J, Zang YC, Li S, Rivera VM, Killian JM, Zhang JZ: Interferon beta induces T-helper 2 immune deviation in MS. Neurology 1999, 53:1692-1697.
8. Stone LA, Frank JA, Albert PS, Bash C, Smith ME, Maloni H, McFarland HF: The effects of interferon-β on blood-brain barrier disrup-tions demonstrated by contrast-enhanced magnetic reso-nance imaging in relapsing-remitting multiple sclerosis. Ann Neurol 1995, 37:611-619.
9. Satoh J, Paty DW, Kim SU: Differential effects of beta and gamma interferons on expression of major histocompatibil-ity complex antigens and intercellular adhesion molecule-1 in cultured fetal human astrocytes. Neurology 1995, 45:367-373. 10. Waubant E, Vukusic S, Gignoux L, Dubief FD, Achiti I, Blanc S, Renoux C, Confavreux C: Clinical characteristics of responders to interferon therapy for relapsing MS. Neurology 2003, 61:184-189.
11. Rudick RA, Lee JC, Simon J, Ransohoff RM, Fisher E: Defining inter-feron β response status in multiple sclerosis patients. Ann Neurol 2004, 56:548-555.
12. Neilley LK, Goodin DS, Goodkin DE, Hauser SL: Side effect profile of interferon beta-1b in MS: Results of an open label trial. Neurology 1996, 46:552-554.
13. Bielekova B, Martin R: Development of biomarkers in multiple sclerosis. Brain 2004, 127:1463-1478.
14. Steinman L, Zamvil S: Transcriptional analysis of targets in mul-tiple sclerosis. Nature Rev Immunol 2003, 3:483-492.
15. Wandinger KP, Strüzebecher CS, Bielekova B, Detore G, Rosenwald A, Staudt LM, McFarland HF, Martin R: Complex immunomodu-latory effects of interferon-β in multiple sclerosis include the upregulation of T helper 1-associated marker genes. Ann Neu-rol 2001, 50:349-357.
16. Koike F, Satoh J, Miyake S, Yamamoto T, Kawai M, Kikuchi S, Nomura K, Yokoyama K, Ota K, Kanda T, Fukazawa T, Yamamura T: Micro-array analysis identifies interferon β-regulated genes in mul-tiple sclerosis. J Neuroimmunol 2003, 139:109-118.
17. Weinstock-Guttman B, Badgett D, Patrick K, Hartrich L, Santos R, Hall D, Baier M, Feichter J, Ramanathan M: Genomic effects of IFN-β in multiple sclerosis patients. J Immunol 2003, 171:2694-2702.
18. Satoh J, Nakanishi M, Koike F, Miyake S, Yamamoto T, Kawai M, Kikuchi S, Nomura K, Yokoyama K, Ota K, Kanda T, Fukazawa T, Yamamura T: Microarray analysis identifies an aberrant expression of apoptosis and DNA damage-regulatory genes in multiple sclerosis. Neurobiol Dis 2005, 18:537-550.
19. van Boxel-Dezaire AH, van Trigt-Hoff SC, Killestein J, Schrijver HM, van Houwelingen JC, Polman CH, Nagelkerken L: Contrasting response to interferon β-1b treatment in relapsing-remitting multiple sclerosis: does baseline interleukin-12p35 messen-ger RNA predict the efficacy of treatment? Ann Neurol 2000, 48:313-322.
20. Stürzebecher S, Wandinger KP, Rosenwald A, Sathyamoorthy M, Tzou A, Mattar P, Frank JA, Staudt L, Martin R, McFarland HF: Expression profiling identifies responder and non-responder
phenotypes to interferon-β in multiple sclerosis. Brain 2003, 126:1419-1429.
21. Satoh J, Nakanishi M, Koike F, Onoue H, Aranami T, Yamamoto T, Kawai M, Kikuchi S, Nomura K, Yokoyama K, Ota K, Saito T, Ohta M, Miyake S, Kanda T, Fukazawa T, Yamamura T: T cell gene expression profiling identifies distinct subgroups of Japanese multiple sclerosis patients. J Neuroimmunol 2006, 174:108-118. 22. Baranzini SE, Mousavi P, Rio J, Caillier SJ, Stillman A, Villoslada P,
Wyatt MM, Comabella M, Greller LD, Somogyi R, Montalban X, Oksenberg JR: Transcription-based prediction of response to IFNβ using supervised computational methods. PLoS Biol 2005, 3:e2.
23. Interferon Stimulated Gene Database Arranged intoFunc-tional Categories [http://www.lerner.ccf.org/labs/williams/xchip-html.cgi]
24. Theofilopoulos AN, Baccala R, Beutler B, Kono DH: Type I inter-ferons (α/β) in immunity and autoimmunity. Annu Rev Immunol 2005, 23:307-335.
25. Taniguchi T, Ogasawara K, Takaoka A, Tanaka N: IRF family of transcription factors as regulators of host defense. Annu Rev Immunol 2001, 19:623-655.
26. Honda K, Yanai H, Negishi H, Asagiri M, Sato M, Mizutani T, Shimada N, Ohba Y, Takaoka A, Yoshida N, Taniguchi T: IRF-7 is the master regulator of type-I interferon-dependent immune response. Nature 2005, 434:772-777.
27. Marx N, Mach F, Sauty A, Leung JH, Sarafi MN, Ransohoff RM, Libby P, Plutzky J, Luster AD: Peroxisome proliferators-activated receptor-γ activators inhibit IFN-γ-induced expression of the T cell-active CXC chemokines IP-10, Mig, and I-TAC in human endothelial cells. J Immunol 2000, 164:6503-6508. 28. Kim OS, Park EJ, Joe E, Jou I: JAK-STAT signaling mediates
gan-gliosides-induced inflammatory responses in brain microglial cells. J Biol Chem 2002, 277:40594-40601.
29. Zlotnik A, Yoshie O: Chemokines: a new classification system and their role in immunity. Immunity 2000, 12:121-127. 30. Balashov KE, Rottman JB, Weiner HL, Hancock WW: CCR5+ and
CXCR3+ T cells are increased in multiple sclerosis and their ligands MIP-1α and IP-10 are expressed in demyelinating brain lesions. Proc Natl Acad Sci USA 1999, 96:6873-6878. 31. Sørensen T, Tani M, Jensen J, Pierce V, Lucchinetti C, Folcik VA, Qin
S, Rottman J, Sellebjerg F, Strieter RM, Frederiksen JL, Ransohoff RM: Expression of specific chemokines and chemokine receptors in the central nervous system of multiple sclerosis patients. J Clin Invest 1999, 103:807-815.
32. Simpson JE, Newcombe J, Cuzner ML, Woodroofe MN: Expression of the interferon-γ-inducible chemokines IP-10 and Mig and their receptor, CXCR3, in multiple sclerosis lesions. Neu-ropathol Appl Neurobiol 2000, 26:133-142.
33. McManus C, Berman JW, Brett FM, Staunton H, Farrell M, Brosnan CF: MCP-1, MCP-2 and MCP-3 expression in multiple sclero-sis lesions: an immunohistochemical and in situ hybridization study. J Neuroimmunol 1998, 86:20-29.
34. Van Der Voorn P, Tekstra J, Beelen RH, Tensen CP, Van Der Valk P, De Groot CJ: Expression of MCP-1 by reactive astrocytes in demyelinating multiple sclerosis lesions. Am J Pathol 1999, 154:45-51.
35. Hokeness KL, Kuziel WA, Biron CA, Salazar-Mather TP: Monocyte chemoattractant protein-1 and CCR2 interactions are required for IFN-α/β-induced inflammatory responses and aniviral defense in liver. J Immunol 2005, 174:1549-1556. 36. Giorelli M, Livrea P, Defazio G, Iacovelli L, Capobianco L, Picascia A,
Sallese M, Martino D, Aniello MS, Trojano M, De Blasi A: Interferon beta-1a counteracts effects of activation on the expression of G-protein-coupled receptor kinases 2 and 3, β-arrestin-1, and regulators of G-protein signaling 2 and 16 in human mononuclear leukocytes. Cell Signal 2002, 14:673-678. 37. Reif K, Cyster JG: RGS molecule expression in murine B
phocytes and ability to down-regulate chemotaxis to lym-phoid chemokines. J Immunol 2000, 164:4720-4729.
38. Der SD, Zhou A, Williams BRG, Silverman RH: Identification of genes differentially regulated by interferon α, β, or γ using oligonucleotide arrays. Proc Natl Acad Sci USA 1998, 95:15623-15628.
transcrip-Publish with BioMed Central and every scientist can read your work free of charge "BioMed Central will be the most significant development for disseminating the results of biomedical researc h in our lifetime."
Sir Paul Nurse, Cancer Research UK
Your research papers will be:
available free of charge to the entire biomedical community
peer reviewed and published immediately upon acceptance
cited in PubMed and archived on PubMed Central
yours — you keep the copyright
Submit your manuscript here:
http://www.biomedcentral.com/info/publishing_adv.asp
BioMedcentral tion by binding to a conserved NF-κB-flanking sequence
ele-ment. J Biol Chem 2001, 176:4501-4508.
40. Lund BT, Ashikian N, Ta HQ, Chakryan Y, Manoukian K, Groshen S, Gilmore W, Cheema GS, Stohl W, Burnett ME, Ko D, Kachuck NJ, Weiner LP: Increased CXCL8 (IL-8) expression in multiple sclerosis. J Neuroimmunol 2004, 155:161-171.
41. Iarlori C, Reale M, De Luca G, Di Iorio A, Feliciani C, Tulli A, Conti P, Gambi D, Lugaresi A: Interferon β-1b modulates MCP-1 expression and production in relapsing-remitting multiple sclerosis. J Neuroimmunol 2002, 123:170-179.
42. Rothuizen LE, Buclin T, Spertini F, Trinchard I, Munafo A, Buchwalder PA Ythier A, Biollaz J: Influence of interferon β-1a dose fre-quency on PBMC cytokine secretion and biological effect markers. J Neuroimmunol 1999, 99:131-141.
43. Comabella M, Imitola J, Weiner HL, Khoury SJ: Interferon-β treat-ment alters peripheral blood monocytes chemokine produc-tion in MS patients. J Neuroimmunol 2002, 126:205-212. 44. Dayal AS, Jensen MA, Ledo A, Arnason BG:
Interferon-gamma-secreting cells in multiple sclerosis patients treated with interferon beta-1b. Neurology 1995, 45:2173-2177.
45. Martínez-Cáceres EM, Río J, Barrau M, Durán I, Borrás C, Tintoré M, Montalban X: Amelioration of flulike symptoms at the onset of interferon β-1b therapy in multiple sclerosis by low-dose oral steroids is related to a decrease in interleukin-6 induction. Ann Neurol 1998, 44:682-685.
46. Buttmann M, Merzyn C, Rieckmann P: Interferon-β induces tran-sient systemic IP-10/CXCL10 chemokine release in patients with multiple sclerosis. J Neuroimmunol 2004, 156:195-203. 47. Sarris AH, Esgleyes-Ribot T, Crow M, Broxmeyer HE, Karasavvas N,
Pugh W Grossman D, Deisseroth A, Duvic M: Cytokine loops involving interferon-γ and IP-10, a cytokine chemotactic for CD4+ lymphocytes: an explanation for the epidermotropism of cutaneous T-cell lymphoma. Blood 1995, 86:651-658. 48. Marckmann S, Wiesemann E, Hilse R, Trebst C, Stangel M,
Wind-hagen A: Interferon-β up-regulates the expression of co-stim-ulatory molecules CD80, CD86 and CD40 on monocytes: significance for treatment of multiple sclerosis. Clin Exp Immu-nol 2004, 138:499-506.
49. Buttmann M, Goebeler M, Toksoy A, Schmid S, Graf W, Berberich-Siebelt F, Rieckmann P: Subcutaneous interferon-β injections in patients with multiple sclerosis initiate inflammatory skin reactions by local chemokine induction. J Neuroimmunol 2005, 168:175-82.
50. Islam M, Frye RF, Richards TJ, Sbeitan I, Donnelly SS, Glue P, Agarwala SS, Kirkwood JM: Differential effect of IFNα-2b on the cyto-chrome P450 enzyme system: a potential basis of IFN toxic-ity and its modulation by other drugs. Clin Cancer Res 2002, 8:2480-2487.
51. Chawla-Sarkar M, Lindner DJ, Liu YF, Williams BR, Sen GC, Silverman RH, Borden EC: Apoptosis and interferons: role of interferon-stimulated genes as mediators of apoptosis. Apoptosis 2003, 8:237-249.
52. Geiss GK, Carter VS, He Y, Kwieciszewski BK, Holzman T, Korth MJ, et al.: Gene expression profiling of the cellular transcriptional network regulated by alpha/beta interferon and its partial attenuation by the hepatitis C virus nonstructural 5A pro-tein. J Virol 2003, 77:6367-6375.
53. Wandinger KP, Lünemann JD, Wengert O, Bellmann-Strobl J, Aktas O, Weber A, Grundstrom E, Ehrlich S, Wernecke KD, Volk HD, Zipp F: TNF-related apoptosis inducing ligand (TRAIL) as a poten-tial response marker for interferon-beta treatment in multi-ple sclerosis. Lancet 2003, 361:2036-2043.
54. Wesemann DR, Qin H, Kokorina N, Benveniste EN: TRADD inter-acts with STAT1-α and influences interferon-γ signaling. Nature Immunol 2004, 5:199-207.
55. Balachandran S, Thomas E, Barber GN: A FADD-dependent innate immune mechanism in mammalian cells. Nature 2004, 432:401-405.
56. Stephanou A, Isenberg DA, Nakajima K, Latchman DS: Signal trans-ducer and activator of transcription-1 and heat shock factor-1 interact and activate the transcription of the Hsp-70 and Hsp-90β gene promoter. J Biol Chem 1999, 274:1723-1728.
Pre-publication history
The pre-publication history for this paper can be accessed here: