R E S E A R C H
Open Access
Fatty acid distribution of cord and maternal blood
in human pregnancy: special focus on individual
trans
fatty acids and conjugated linoleic acids
Uta Enke
1, Anke Jaudszus
2, Ekkehard Schleussner
1, Lydia Seyfarth
1, Gerhard Jahreis
2and Katrin Kuhnt
2*Abstract
Background:Maternal nutrition in pregnancy has a crucial impact on the development of the fetus. Dietary trans fatty acids (tFA) are known to have adverse health effects, especially during pregnancy. However, the distribution oftFA produced via partial hydrogenation of vegetable oils (mainly elaidic acid;t9) differs compared to ruminant-derivedtFA (mainly vaccenic acid;t11). Recent findings indicate that they may have different impact on human health.
Therefore, in this study, plasma and erythrocytes of mother-child pairs (n = 55) were sampled to investigate the distribution oftFA, including individualtransC18:1 fatty acids and conjugated linoleic acids (CLA) in fetal related to maternal lipids; with additional consideration of maternal dairy fat intake.
Results:Portion oft9 andt11, but also ofc9,t11 CLA was higher in maternal than in fetal blood lipids. The portion oft9 in maternal and fetal lipids differed only slightly. In contrast, the portion of fetalt11 was only half of that in maternal blood. This led to a fetalt9/t11-index in plasma and erythrocytes being twice as high compared to the maternal values. A high dairy fat intake resulted in elevated portions oft11 and its Δ9-desaturation productc9,t11 CLA in maternal blood. In contrast, in the respective fetal blood lipids onlyc9,t11 CLA, but not t11 was increased. Nevertheless, a positive association between maternal and fetal plasma exists for botht11 andc9,t11 CLA. Furthermore, in contrast tot9,t11 was not negatively associated with n-3 LC-PUFA in fetal blood lipids.
Conclusions:Fetal blood fatty acid composition essentially depends on and is altered by the maternal fatty acid supply. However, in addition to dietary factors, other aspects also contribute to the individual fatty acid distribution (oxidation, conversion, incorporation). The lower portion of fetalt11 compared to maternalt11, possibly results fromΔ9-desaturation to c9,t11 CLA and/or oxidation. Based on the fatty acid distribution, it can be concluded that t11 differs fromt9 regarding its metabolism and their impact on fetal LC-PUFA.
Keywords:transoctadecenoic acids,transfatty acids, vaccenic acid, elaidic acid, conjugated linoleic acids, omega-3 LC-PUFA,t9/t11-index, fetus, pregnancy, dairy fat
Background
Maternal nutrition may have a crucial impact on the development of the fetus during pregnancy and even for the child after birth [1]. Long chain polyunsaturated fatty acids (LC-PUFA), such as C20:4 n-6 (arachidonic acid; AA) and C22:6 n-3 (docosahexaenoic acid; DHA) are known to be essential for fetal development [2-4].
Moreover, n-3 LC-PUFA have been shown to modulate the fetal immune system and, thus, possibly decrease the risk for later atopy development [5]. In contrast, trans fatty acids (tFA) are considered to enhance the risk of coronary heart disease [6,7], atopy [8], complica-tions in pregnancy, e.g. preeclampsia [9] and to impair fetal development [10]. Extensive data on preferred LC-PUFA transport from mother to fetus [11,12] as well as higher LC-PUFA concentrations in fetal than in mater-nal blood [13-16] have been published over the last few decades. In contrast, data of fetal blood concentrations
* Correspondence: katrin.kuhnt@uni-jena.de
2
Department of Nutritional Physiology, Institute of Nutrition, Friedrich Schiller University Jena, Dornburger Str. 24, Jena, Germany
Full list of author information is available at the end of the article
and profile of conjugated linoleic acids (CLA) and tFA are scarce. Moreover, in results from studies concerning tFA, only mean percentage values of totaltFA in mater-nal and/or fetal plasma and erythrocyte lipids have been reported [13,17-20].
However, since the amount and distribution of indivi-dual tFA, especiallytransC18:1, differs considerably between industrial and natural (ruminant)tFA sources, a discussion has arisen regarding the extent to which rumi-nanttFA raises the risk for cardiovascular diseases in com-parison to industrialtFA. The latter mainly comprises of trans-9 C18:1 (elaidic acid;t9) andtrans-10 C18:1 [21]. In contrast,trans-11 C18:1 (vaccenic acid;t11) is the major transC18:1 in ruminanttFA principally resulting in a low t9/t11-index in dairy products (< 1) [22]. Thet11 in dairy fat derives from microbial biohydrogenation of PUFA in the rumen. Dairy fat also contains CLA, especiallyc9,t11 CLA produced by rumen microbes and primarily by endo-genousΔ9-desaturation oft11 by the mammary gland [23].
It has been argued that in contrast to other trans C18:1, intake of t11 is not associated with coronary heart disease or inflammation [24]. In fact, t11 may even impart health benefits due to its function as a metabolic precursor of c9,t11 CLA. This conversion also occurs in humans [22,25,26]. Both, t11 andc9,t11 CLA have been shown to exert anti-inflammatory effects in allergy models [27,28], and t11 did not negatively alter inflammatory parameters in humans [29]. High maternal dairy fat intake led to elevatedc9,t11 CLA andt11, thus decreasing thet9/t11-index in breast milk [30]. These ruminant fatty acids in breast milk showed protective effects against the development of atopic manifestation in infants [31].
To date, no corresponding data concerning individual transC18:1 such ast9 andt11 are available for maternal and the corresponding fetal blood. This study aimed at characterising the distribution of individual trans iso-mers of maternal and fetal blood lipids and their asso-ciation with LC-PUFA in fetal blood lipids. In addition, the relationship between maternal intake of dairy pro-ducts and the maternal and fetal blood fatty acid profile was investigated.
Methods
Subjects and study design
Blood samples from 55 mothers together with cord blood from their neonates were collected at birth. In this study, only healthy infants born at term after uncomplicated pregnancies were included. Mothers with gestational diabetes or those taking pharmaceuticals were excluded. After birth, mothers were requested to answer two questionnaires: one focussing on obstetric history, lifestyle, and socioeconomic factors and the
other was a food frequency questionnaire (FFQ) dealing with foods from a variety of groups, such as dairy pro-ducts, fish, oils, seeds or nuts. The study protocol was approved by the local ethics committee (Nr. 1345-06/ 04). Informed written consent was obtained from all mothers.
Sample collection and preparation for gas chromatography
Maternal blood was drawn at birth from a peripheral vein. Fetal blood was drawn by venipuncture from the placental portion of the umbilical cord immediately after clamping. Blood was collected in EDTA-tubes (S-Monovette 9 ml KE3, Sarstedt). Plasma was separated by centrifugation (1500 × g, 10 min, 4°C) and erythrocytes were washed three times with physiological sodium chloride solution. Plasma and erythrocytes were frozen immediately at -80°C and stored until lipid extraction.
Lipid extraction and transmethylation
Lipids were extracted from plasma and erythrocytes based on the method of Bligh and Dyer [32]. Lipid extracts were transmethylated by using a combination of 0.5 N metha-nolic sodium hydroxide (Merck) and 10% (w/w, Supelco) boron trifluoride-methanol (100°C for 5 min each). Subse-quently, fatty acid methyl esters (FAME) were purified by thin layer chromatography and dissolved in n-hexane for analysis [33]. A system of two GC/FID methods was used to analyse the full fatty acid spectrum from C4 to C26 including CLA (GC-17 V3 Shimadzu; DB-225MS: 60 m, i. d. 0.25 mm, 0.25μm film thickness; Agilent Technologies) as well ascisandtransisomers of C18:1,transC18:2 and C18:3 (GC-2010, Shimadzu; CP-select 200 m × 0.25 mm i.d. with 0.25 μm film thickness; Varian) [21]. In brief, injector and detector temperatures were maintained at 260°C and 270°C, respectively, with hydrogen as carrier gas [21]. In total 88 fatty acids were identified and detect-abletransC18:1 comprise the following isomers:t4,t5,t6/ 7/8,t9,t10,t11,t12,t13/14,t15, andt16 C18:1. Further-more,t9,t12;c9,t12;t9,c12 C18:2;t3,c9,c11 andc8,t10,t12 C18:3, were summarised as totaltFA. Fatty acid concen-trations were expressed as the percentage of the total area of all FA peaks (% of total FAME).
Data evaluation and statistics
Evaluation of food frequency questionnaires (n = 41) was carried out using Prodi 5.5 Nutriscience software (summarized in Table 1). Fourteen questionnaires had to be excluded due to unreliable data.
was used to determine the difference of means in the subgroups of high and low dairy fat intake. Data were reported as means ± SD. Significance was defined as P≤ 0.05.
Results Subjects
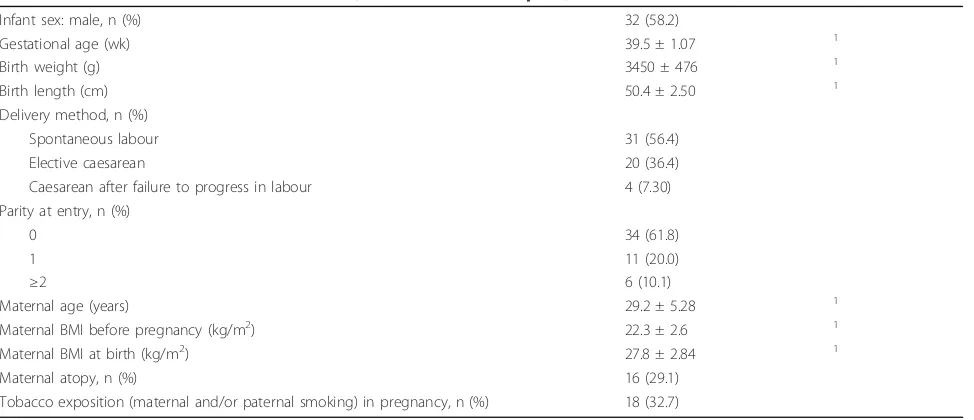
The mean maternal age at birth was 29.2 years. Infants had normal birth weight and length (Table 2).
Dietary intake
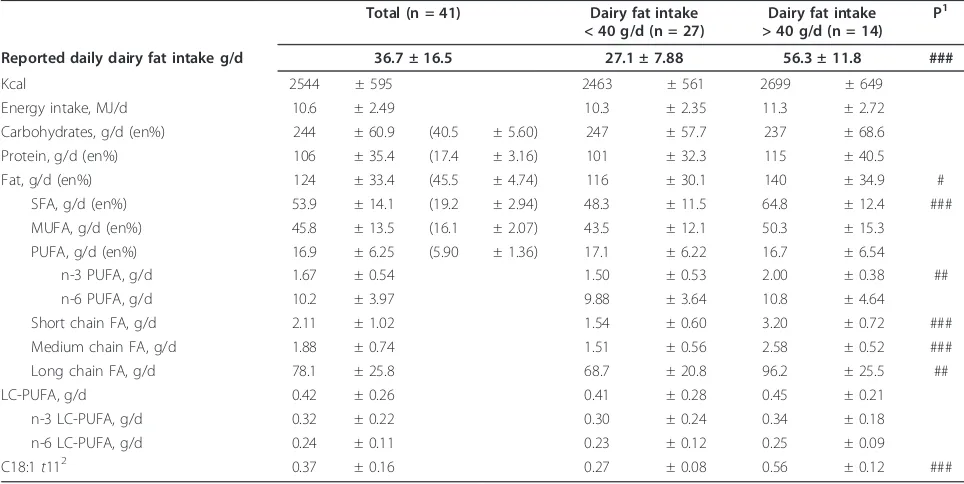
Mothers reported that they did not essentially change their dietary habits during pregnancy. In general, they consumed western-style diets that were predominantly omnivore. The fat intake (n = 41) averaged 124 g per day which corresponds to 45% of total energy intake (en %), with high inter-individual variations (from 55 to 215 g/d; Table 1). Mean dairy fat intake was 36.7 g/d, ran-ging from 7.29 g/d (2.2 en%) to 82.1 g/d (39.3 en%). Mothers who reported a high dairy fat intake (> 40 g/d) tended to have higher energy uptake due to the raised dietary fat (increased by 1.2 times). In addition, their dietary intake of saturated and short chain fatty acids was also 1.3 to 2 times higher (Table 1). Overall, fish was reportedly consumed less than once a week and n-3 PUFA supplementation (e.g. by fish oil capsules) was not common (n = 11; 20%). A high dairy fat intake was not associated with fish oil supplementation and
increased intake of n-3 PUFA-rich foods (e.g., fish, nuts, and vegetable oils). If fish oil was supplemented, a higher proportion of n-3 LC-PUFA in maternal lipids was not observed (data not shown).
Fatty acid profile in maternal and fetal blood lipids (n = 55)
- Trans fatty acids
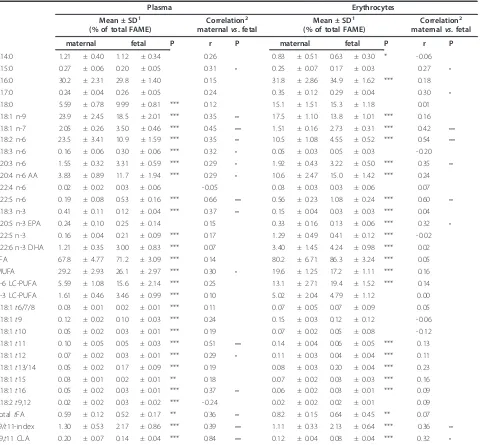
The mean totaltFA, as well ast9 andt11 in plasma and erythrocyte lipids were significantly higher in maternal compared to fetal lipids (Table 3). However, in both fetal lipids fractions,t11 levels were half oft9 values leading to a higher fetalt9/t11-index compared to the maternal index in both plasma and erythrocytes (Table 3).
TotaltFA in maternal plasma (Pmat) correlated posi-tively with total tFA concentrations in fetal plasma (Pfet). There was no correlation oft9 between Pmatand Pfet. On the contrary, there was a positive correlation between Pmat and Pfetfort11. In general, no correlation for totaltFA as well as t9 andt11 was found between maternal and fetal erythrocytes (Emat, Efet, respectively; Table 3).
On the other hand, positive correlations were found within the respective blood fraction betweent9 andt11 (Pmat: r = 0.33, P < 0.05; Pfet: r = 0.39, P < 0.001; Emat: r = 0.12, P = 0.37; Efet: r = 0.89, P < 0.001; data not shown).
In general, in most samples, proportions of t4 and t5 C18:1 as well as of t3,c9,c11 C18:3 were below the
Table 1 Daily intake of energy and dietary fatty acids estimated by food frequency questionnaires and regarding calculated dairy fat intake (n = 41)
Total (n = 41) Dairy fat intake
< 40 g/d (n = 27)
Dairy fat intake > 40 g/d (n = 14)
P1
Reported daily dairy fat intake g/d 36.7 ± 16.5 27.1 ± 7.88 56.3 ± 11.8 ###
Kcal 2544 ± 595 2463 ± 561 2699 ± 649
Energy intake, MJ/d 10.6 ± 2.49 10.3 ± 2.35 11.3 ± 2.72
Carbohydrates, g/d (en%) 244 ± 60.9 (40.5 ± 5.60) 247 ± 57.7 237 ± 68.6
Protein, g/d (en%) 106 ± 35.4 (17.4 ± 3.16) 101 ± 32.3 115 ± 40.5
Fat, g/d (en%) 124 ± 33.4 (45.5 ± 4.74) 116 ± 30.1 140 ± 34.9 #
SFA, g/d (en%) 53.9 ± 14.1 (19.2 ± 2.94) 48.3 ± 11.5 64.8 ± 12.4 ###
MUFA, g/d (en%) 45.8 ± 13.5 (16.1 ± 2.07) 43.5 ± 12.1 50.3 ± 15.3
PUFA, g/d (en%) 16.9 ± 6.25 (5.90 ± 1.36) 17.1 ± 6.22 16.7 ± 6.54
n-3 PUFA, g/d 1.67 ± 0.54 1.50 ± 0.53 2.00 ± 0.38 ##
n-6 PUFA, g/d 10.2 ± 3.97 9.88 ± 3.64 10.8 ± 4.64
Short chain FA, g/d 2.11 ± 1.02 1.54 ± 0.60 3.20 ± 0.72 ###
Medium chain FA, g/d 1.88 ± 0.74 1.51 ± 0.56 2.58 ± 0.52 ###
Long chain FA, g/d 78.1 ± 25.8 68.7 ± 20.8 96.2 ± 25.5 ##
LC-PUFA, g/d 0.42 ± 0.26 0.41 ± 0.28 0.45 ± 0.21
n-3 LC-PUFA, g/d 0.32 ± 0.22 0.30 ± 0.24 0.34 ± 0.18
n-6 LC-PUFA, g/d 0.24 ± 0.11 0.23 ± 0.12 0.25 ± 0.09
C18:1t112 0.37 ± 0.16 0.27 ± 0.08 0.56 ± 0.12 ###
Mean ± SD; SFA, saturated fatty acids; MUFA, monounsaturated fatty acids; PUFA, polyunsaturated fatty acids. 1
Means are significantly different between low and high dairy fat intake (t-Test): # P < 0.05; ## P < 0.01; ### P < 0.001. 2
detection limit. The co-eluting isomers t13 and t14 C18:1 were the onlytransisomers which were lower in maternal than in fetal lipids (Table 3). [However, since there was no pre-separation ofcis C18:1 via Ag+-TLC before GC analysis, an overestimation of t13/14 C18:1 due to co-elution with cis C18:1 isomers c6-8 could have occurred [34]. It is also possible that c6-8 C18:1 are especially relevant in fetal lipids, however, no data are available in the literature].
- Conjugated linoleic acids
The c9,t11 CLA was significantly higher in maternal than in fetal lipids (Table 3). Moreover, positive correla-tions of c9,t11 CLA between maternal and fetal lipids were stronger for plasma than for erythrocytes (Table 3). In Pmatand Pfet, elevatedc9,t11 CLA were seen com-pared tot11, whilst both were equally distributed in the respective erythrocyte lipids. In addition, maternal t11 in plasma and erythrocytes was positively correlated to the respective fetal c9,t11 CLA (r = 0.51, r = 0.59; P < 0.001, respectively, data not shown).
- Polyunsaturated fatty acids
Quantities of AA, n-6, and DHA, n-3, were significantly higher in Pfetand Efetthan in the respective maternal lipids. In contrast, proportions of linoleic acid (C18:2 n-6) were higher in the maternal than in fetal lipids (Table 3).
- Correlation between trans fatty acids and polyunsaturated fatty acids
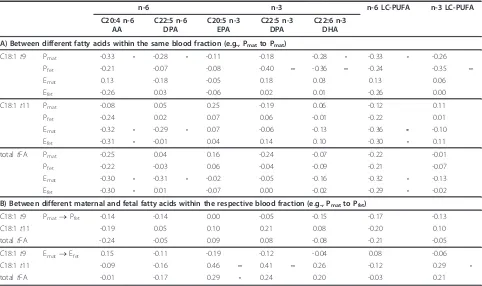
Analysis of correlations between tFA and LC-PUFA revealed a heterogeneous result. However, a significant negative association was found in Pfetbetween t9 and
n-3 LC-PUFA (total, DPA n-n-3, DHA) while t11 was
negatively associated with n-6 LC-PUFA in Ematand Efet (Table 4).
Furthermore, regarding correlations of maternal to fetal fatty acids,t11 in maternal blood lipids was posi-tively associated with fetal n-3 LC-PUFA, especially in erythrocytes (Table 4(B)).
Association between dairy fat intake and fatty acid profile of blood lipids (n = 41)
A high maternal intake of dairy fat (> 40 g/d; n = 14) resulted in an elevated amount of milk specific fatty acids such as C15:0, C17:0 and t11 in both maternal lipid fractions (Pmat and Emat) compared to mothers with lower dairy fat intake (n = 27; Table 5). In contrast, in fetal lipids, the high maternal dairy fat intake was only reflected by a higherc9,t11 CLA in plasma and ery-throcytes, whereas t11 was not elevated. But, sincet11 was elevated in maternal lipids, the t9/t11-index had decreased, which was also shown in fetal lipids. In addi-tion, due to a high dairy fat intake, n-3 LC-PUFA such as EPA, DPA, and DHA were elevated in fetal lipids, particularly in plasma (Table 5).
Data analysis regarding fatty acid correlation between maternal and fetal lipids clearly showed that both t11 andc9,t11 CLA were positively correlated between Pmat and Pfetin the case of low and high dairy fat intake (Fig-ure 1). In contrast, no correlation was observed fort9 between maternal and fetal lipids, independently of dairy fat intake (Figure 1). A high dairy fat intake did not result in a negative correlation betweent11 and t9 in all maternal and fetal blood lipids (data not shown).
Table 2 Maternal and infant characteristics (n = 55 mother-child pairs)
Infant sex: male, n (%) 32 (58.2)
Gestational age (wk) 39.5 ± 1.07 1
Birth weight (g) 3450 ± 476 1
Birth length (cm) 50.4 ± 2.50 1
Delivery method, n (%)
Spontaneous labour 31 (56.4)
Elective caesarean 20 (36.4)
Caesarean after failure to progress in labour 4 (7.30)
Parity at entry, n (%)
0 34 (61.8)
1 11 (20.0)
≥2 6 (10.1)
Maternal age (years) 29.2 ± 5.28 1
Maternal BMI before pregnancy (kg/m2) 22.3 ± 2.6 1
Maternal BMI at birth (kg/m2) 27.8 ± 2.84 1
Maternal atopy, n (%) 16 (29.1)
Tobacco exposition (maternal and/or paternal smoking) in pregnancy, n (%) 18 (32.7)
All blood donors. 1
Discussion
The quantities of fatty acids in maternal and, especially, in fetal blood are under the influence of various factors. SincetFA are not synthesised in human tissue, all tFA with isolated double bonds present in fetal blood lipids can only be due to a transplacental transfer and must originate from maternal diet. Herein, we investigated the fatty acid composition of plasma and erythrocytes in mother-child pairs at birth, focussing on totaltFA and
individual transC18:1 such as t9 and t11 with special regard to dairy fat intake.
-Totaltransfatty acids in maternal and fetal blood lipids
In the present study, total tFA concentrations in mater-nal and fetal lipids were about 0.5 to 0.8% of FAME, with generally higher levels in maternal and plasma lipids compared to fetal and erythrocyte lipids, respec-tively. In several recently published European studies,
Table 3 Fatty acids in maternal and fetal plasma and erythrocytes (n = 55)
Plasma Erythrocytes
Mean ± SD1
(% of total FAME)
Correlation2
maternalvs. fetal
Mean ± SD1
(% of total FAME)
Correlation2
maternalvs. fetal
maternal fetal P r P maternal fetal P r P
C14:0 1.21 ± 0.40 1.12 ± 0.34 0.26 0.83 ± 0.51 0.63 ± 0.30 * -0.06
C15:0 0.27 ± 0.06 0.20 ± 0.05 0.31 • 0.25 ± 0.07 0.17 ± 0.03 0.27 •
C16:0 30.2 ± 2.31 29.8 ± 1.40 0.15 31.8 ± 2.86 34.9 ± 1.62 *** 0.18
C17:0 0.24 ± 0.04 0.26 ± 0.05 0.24 0.35 ± 0.12 0.29 ± 0.04 0.30 •
C18:0 5.59 ± 0.78 9.99 ± 0.81 *** 0.12 15.1 ± 1.51 15.3 ± 1.18 0.01
C18:1 n-9 23.9 ± 2.45 18.5 ± 2.01 *** 0.35 •• 17.5 ± 1.10 13.8 ± 1.01 *** 0.16 C18:1 n-7 2.05 ± 0.26 3.50 ± 0.46 *** 0.45 ••• 1.51 ± 0.16 2.73 ± 0.31 *** 0.42 ••• C18:2 n-6 23.5 ± 3.41 10.9 ± 1.59 *** 0.35 •• 10.5 ± 1.08 4.55 ± 0.52 *** 0.54 •••
C18:3 n-6 0.16 ± 0.06 0.30 ± 0.06 *** 0.32 • 0.05 ± 0.03 0.05 ± 0.03 -0.20
C20:3 n-6 1.55 ± 0.32 3.31 ± 0.59 *** 0.29 • 1.92 ± 0.43 3.22 ± 0.50 *** 0.35 ••
C20:4 n-6 AA 3.83 ± 0.89 11.7 ± 1.94 *** 0.29 • 10.6 ± 2.47 15.0 ± 1.42 *** 0.24
C22:4 n-6 0.02 ± 0.02 0.03 ± 0.06 -0.05 0.03 ± 0.03 0.03 ± 0.06 0.07
C22:5 n-6 0.19 ± 0.08 0.53 ± 0.16 *** 0.66 ••• 0.56 ± 0.23 1.08 ± 0.24 *** 0.60 •• C18:3 n-3 0.41 ± 0.11 0.12 ± 0.04 *** 0.37 •• 0.15 ± 0.04 0.03 ± 0.03 *** 0.04
C20:5 n-3 EPA 0.24 ± 0.10 0.25 ± 0.14 0.15 0.33 ± 0.16 0.13 ± 0.06 *** 0.32 •
C22:5 n-3 0.16 ± 0.04 0.21 ± 0.09 *** 0.17 1.29 ± 0.49 0.41 ± 0.12 *** -0.02
C22:6 n-3 DHA 1.21 ± 0.35 3.00 ± 0.83 *** 0.07 3.40 ± 1.45 4.24 ± 0.98 *** 0.02
SFA 67.8 ± 4.77 71.2 ± 3.09 *** 0.14 80.2 ± 6.71 86.3 ± 3.24 *** 0.05
MUFA 29.2 ± 2.93 26.1 ± 2.97 *** 0.30 • 19.6 ± 1.25 17.2 ± 1.11 *** 0.16
n-6 LC-PUFA 5.59 ± 1.08 15.6 ± 2.14 *** 0.25 13.1 ± 2.71 19.4 ± 1.52 *** 0.14
n-3 LC-PUFA 1.61 ± 0.46 3.46 ± 0.99 *** 0.10 5.02 ± 2.04 4.79 ± 1.12 0.00
C18:1t6/7/8 0.03 ± 0.01 0.02 ± 0.01 *** 0.11 0.07 ± 0.05 0.07 ± 0.09 0.05
C18:1t9 0.12 ± 0.02 0.10 ± 0.03 *** 0.24 0.15 ± 0.03 0.12 ± 0.12 -0.06
C18:1t10 0.05 ± 0.02 0.03 ± 0.01 *** 0.19 0.07 ± 0.02 0.05 ± 0.08 -0.12
C18:1t11 0.10 ± 0.05 0.05 ± 0.03 *** 0.51 ••• 0.14 ± 0.04 0.06 ± 0.05 *** 0.13 C18:1t12 0.07 ± 0.02 0.03 ± 0.01 *** 0.29 • 0.11 ± 0.03 0.04 ± 0.04 *** 0.11 C18:1t13/14 0.05 ± 0.02 0.17 ± 0.09 *** 0.19 0.08 ± 0.03 0.20 ± 0.04 *** 0.23
C18:1t15 0.03 ± 0.01 0.02 ± 0.01 ** 0.18 0.07 ± 0.02 0.03 ± 0.03 *** 0.16
C18:1t16 0.05 ± 0.02 0.03 ± 0.01 *** 0.37 •• 0.06 ± 0.02 0.03 ± 0.01 *** 0.09
C18:2t9,12 0.02 ± 0.02 0.03 ± 0.02 *** -0.24 0.02 ± 0.02 0.02 ± 0.01 0.09
TotaltFA 0.59 ± 0.12 0.52 ± 0.17 ** 0.36 •• 0.82 ± 0.15 0.64 ± 0.45 ** 0.07
t9/t11-index 1.30 ± 0.53 2.17 ± 0.86 *** 0.39 ••• 1.11 ± 0.33 2.13 ± 0.64 *** 0.36 •• c9,t11 CLA 0.20 ± 0.07 0.14 ± 0.04 *** 0.84 ••• 0.12 ± 0.04 0.08 ± 0.04 *** 0.32 •
FAME, fatty acid methyl esters; SFA, saturated fatty acids (sum of C12:0, C14:0, C15:0, C16:0, C17:0 and C18:0); MUFA, monounsaturated fatty acids (sum of thecis isomers of C16:1, C18:1 n-9 and C18:1 n-7); n-3 and n-6 LC-PUFA, omega-3 and omega-6 long chain polyunsaturated fatty acids (sum of C20:5 n-3, C22:5 n-3, C22:6 n-3 and C20:3 n-6, C20:4 n-6, C22:4 n-6, C22:5 n-6, respectively); totaltFA, totaltransfatty acids (sum of C18:1t4,t5,t6/7/8,t9,t10,t11,t12,t13/14,t15 and t16 as well as C18:2t9,12, C18:3t3,c9,c11 and C18:3c8,t10,t12).
1
Means are significantly different between maternal and fetal lipids (paired t-Test): *P < 0.05; ** P < 0.01; *** P < 0.001. 2
values for total tFA in maternal and fetal erythrocytes and plasma lipids range from 0.08% to 0.45% in phos-pholipids and up to 2.74% in the other lipid fractions, however, with higher tFA values in maternal than in fetal lipids [13,19,20,35]. Nevertheless, comparison of data for totaltFA is difficult since percentages of single fatty acids may vary according to the analysed plasma fractions (phospholipids vs. total lipids; [36]) and the applied method of analysis (GC-column, varying num-bers of analysed/identified fatty acids, integration para-meters, management of un-identified peaks).
-transfatty acid intake
Following a number of accounts regarding adverse health effects [6,37], thetFA, content in foods has con-tinuously decreased over the last decades [21,38]. Recent reports estimate the mean dietarytFA intake in Ger-many at 2.3 g/d for men (0.8 en%) and 1.6 g/d for women (0.74 en%; [39]). Since tFA content varies strongly within food categories [21], the exact intake of tFA is difficult to calculate. Furthermore, the distribu-tion of individual tFA isomers varies according to their origin. In dairy fat, t11 is generally the major t18:1 con-taining about 1.0 to 2.0% of FAME [21,40]. Thus, the present maternal mean values for low and high dairy fat intake were approximately 27.1 and 56.3 g/d, which
were estimated as corresponding to about 0.3 to 0.6 g t11/d, respectively (Table 2). This assessment is in line with recent data regarding the averaget11 intake [39]. In contrast, the t9 intake in the age group 30 ± 5 years of the present study population was found to be about twice as high as thet11 intake [39] resulting in a mean dietaryt9/t11-index of about 2.
-Individualtransfatty acids in blood lipids
Hardly any data are available in the literature concern-ing individual transC18:1 such ast11 andt9 in mater-nal and/or fetal blood lipids. The present proportions of t9 and t11 were similar in maternal blood lipids (Pmat 0.12 vs. 0.10). Whereast9 in fetal blood lipids tended to be lower compared to maternal lipids,t11 was only half the value of maternalt11 (Pmat0.10vs. Pfet0.05; Table 3). This resulted in fetal t9/t11-indices being twice as high as maternal indices (Table 3, 5).
A general positive correlation of t11, but not of t9 was seen between maternal and fetal plasma (Table 3 Figure 1). However, fetal t11 was about the half that of t9 (Table 3). This low value could indicate differences in materno-fetal transfer as well as metabolism (oxida-tion, conversion, incorporation) of both individual trans isomers t9 andt11, as has been observed in rat hepato-cytes [41,42].
Table 4 Correlation (r) betweentFA and LC-PUFAs in maternal and fetal plasma and erythrocytes (n = 55)
n-6 n-3 n-6 LC-PUFA n-3 LC-PUFA
C20:4 n-6 AA
C22:5 n-6 DPA
C20:5 n-3 EPA
C22:5 n-3 DPA
C22:6 n-3 DHA
A) Between different fatty acids within the same blood fraction (e.g., Pmatto Pmat)
C18:1t9 Pmat -0.33 • -0.28 • -0.11 -0.18 -0.28 • -0.33 • -0.26
Pfet -0.21 -0.07 -0.08 -0.40 •• -0.36 •• -0.24 -0.35 ••
Emat 0.13 -0.18 -0.05 0.18 0.03 0.13 0.06
Efet -0.26 0.03 -0.06 0.02 0.01 -0.26 0.00
C18:1t11 Pmat -0.08 0.05 0.25 -0.19 0.06 -0.12 0.11
Pfet -0.24 0.02 0.07 0.06 -0.01 -0.22 0.01
Emat -0.32 • -0.29 • 0.07 -0.06 -0.13 -0.36 •• -0.10
Efet -0.31 • -0.01 0.04 0.14 0.10 -0.30 • 0.11
totaltFA Pmat -0.25 0.04 0.16 -0.24 -0.07 -0.22 -0.01
Pfet -0.22 -0.03 0.06 -0.04 -0.09 -0.21 -0.07
Emat -0.30 • -0.31 • -0.02 -0.05 -0.16 -0.32 • -0.13
Efet -0.30 • 0.01 -0.07 0.00 -0.02 -0.29 • -0.02
B) Between different maternal and fetal fatty acids within the respective blood fraction (e.g., Pmatto Pfet)
C18:1t9 Pmat®Pfet -0.14 -0.14 0.00 -0.05 -0.15 -0.17 -0.13
C18:1t11 -0.19 0.05 0.10 0.21 0.08 -0.20 0.10
totaltFA -0.24 -0.05 0.09 0.08 -0.08 -0.21 -0.05
C18:1t9 Emat®Efet 0.15 -0.11 -0.19 -0.12 -0.04 0.08 -0.06
C18:1t11 -0.09 -0.16 0.46 •• 0.41 •• 0.26 -0.12 0.29 •
totaltFA -0.01 -0.17 0.29 • 0.24 0.20 -0.03 0.21
Pearson correlation coefficient (r);•P < 0.05;••P < 0.01. A) e.g.t9 Pmatto AA Pmat.
-Conjugated linoleic acids in the diet and blood lipids Dairy fat contains CLA (mainlyc9,t11 CLA), which is formed byΔ9-desaturation oft11 [23]. In dairy fat and human breast milk,t11 was generally higher compared to c9,t11 CLA, whilst the ratio ranged from 4:1 to 2:1 [31,43,44].
In the present study, irrespective of dairy fat intake,t11 was lower compared toc9,t11 CLA in lipids of maternal and fetal plasma (1:2; Table 3) probably reflecting the con-version oft11 toc9,t11 CLA byΔ9-desaturase and/or its
preferred oxidation [22]. In contrast, the ratio oft11 toc9, t11 CLA in erythrocyte lipids was about 1:1, since mater-nal and fetalc9,t11 CLA was lower compared to their levels in plasma, in accordance with data described by Mueller et al [17]. This aspect may be caused by a higher incorporation of CLA into neutral lipids than into phos-pholipids, the major lipid fraction in erythrocytes [45]. Further, our results confirmed that maternalc9,t11 CLA (dietary and of endogenous origin) was positively corre-lated to fetalc9,t11 CLA (Table 3) [44].
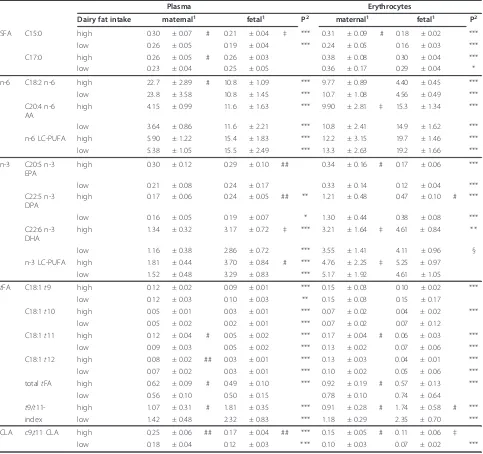
Table 5 Differences of selected fatty acids in maternal and fetal plasma and erythrocytes regarding high and low dairy fat intake
Plasma Erythrocytes
Dairy fat intake maternal1 fetal1 P2 maternal1 fetal1 P2
SFA C15:0 high 0.30 ± 0.07 # 0.21 ± 0.04 ‡ *** 0.31 ± 0.09 # 0.18 ± 0.02 ***
low 0.26 ± 0.05 0.19 ± 0.04 *** 0.24 ± 0.05 0.16 ± 0.03 ***
C17:0 high 0.26 ± 0.05 # 0.26 ± 0.03 0.38 ± 0.08 0.30 ± 0.04 ***
low 0.23 ± 0.04 0.25 ± 0.05 0.36 ± 0.17 0.29 ± 0.04 *
n-6 C18:2 n-6 high 22.7 ± 2.89 # 10.8 ± 1.09 *** 9.77 ± 0.89 4.40 ± 0.45 ***
low 23.8 ± 3.58 10.8 ± 1.45 *** 10.7 ± 1.08 4.56 ± 0.49 ***
C20:4 n-6 AA
high 4.15 ± 0.99 11.6 ± 1.63 *** 9.90 ± 2.81 ‡ 15.3 ± 1.34 ***
low 3.64 ± 0.86 11.6 ± 2.21 *** 10.8 ± 2.41 14.9 ± 1.62 ***
n-6 LC-PUFA high 5.90 ± 1.22 15.4 ± 1.83 *** 12.2 ± 3.15 19.7 ± 1.46 ***
low 5.38 ± 1.05 15.5 ± 2.49 *** 13.3 ± 2.63 19.2 ± 1.66 ***
n-3 C20:5 n-3 EPA
high 0.30 ± 0.12 0.29 ± 0.10 ## 0.34 ± 0.16 # 0.17 ± 0.06 ***
low 0.21 ± 0.08 0.24 ± 0.17 0.33 ± 0.14 0.12 ± 0.04 ***
C22:5 n-3 DPA
high 0.17 ± 0.06 0.24 ± 0.05 ## ** 1.21 ± 0.48 0.47 ± 0.10 # ***
low 0.16 ± 0.05 0.19 ± 0.07 * 1.30 ± 0.44 0.38 ± 0.08 ***
C22:6 n-3 DHA
high 1.34 ± 0.32 3.17 ± 0.72 ‡ *** 3.21 ± 1.64 ‡ 4.61 ± 0.84 **
low 1.16 ± 0.38 2.86 ± 0.72 *** 3.55 ± 1.41 4.11 ± 0.96 §
n-3 LC-PUFA high 1.81 ± 0.44 3.70 ± 0.84 # *** 4.76 ± 2.25 ‡ 5.25 ± 0.97
low 1.52 ± 0.48 3.29 ± 0.83 *** 5.17 ± 1.92 4.61 ± 1.05
tFA C18:1t9 high 0.12 ± 0.02 0.09 ± 0.01 *** 0.15 ± 0.03 0.10 ± 0.02 ***
low 0.12 ± 0.03 0.10 ± 0.03 ** 0.15 ± 0.03 0.15 ± 0.17
C18:1t10 high 0.05 ± 0.01 0.03 ± 0.01 *** 0.07 ± 0.02 0.04 ± 0.02 ***
low 0.05 ± 0.02 0.02 ± 0.01 *** 0.07 ± 0.02 0.07 ± 0.12
C18:1t11 high 0.12 ± 0.04 # 0.05 ± 0.02 *** 0.17 ± 0.04 # 0.06 ± 0.03 ***
low 0.09 ± 0.03 0.05 ± 0.02 *** 0.13 ± 0.02 0.07 ± 0.06 ***
C18:1t12 high 0.08 ± 0.02 ## 0.03 ± 0.01 *** 0.13 ± 0.03 0.04 ± 0.01 ***
low 0.07 ± 0.02 0.03 ± 0.01 *** 0.10 ± 0.02 0.05 ± 0.06 ***
totaltFA high 0.62 ± 0.09 # 0.49 ± 0.10 *** 0.92 ± 0.19 # 0.57 ± 0.13 ***
low 0.56 ± 0.10 0.50 ± 0.15 0.78 ± 0.10 0.74 ± 0.64
t9/t11- high 1.07 ± 0.31 # 1.81 ± 0.35 *** 0.91 ± 0.28 # 1.74 ± 0.58 # ***
index low 1.42 ± 0.48 2.32 ± 0.83 *** 1.18 ± 0.29 2.35 ± 0.70 ***
CLA c9,t11 CLA high 0.25 ± 0.06 ## 0.17 ± 0.04 ## *** 0.15 ± 0.05 # 0.11 ± 0.06 ‡
low 0.18 ± 0.04 0.12 ± 0.03 *** 0.10 ± 0.03 0.07 ± 0.02 ***
1
Portions of the respective fatty acid in % of total FAME as mean ± SD of high dairy fat intake (> 40 g/d, upper values; n = 14) and low dairy fat intake (< 40 g/ d, lower values; n = 27); means are different between both groups (unpaired t-Test):‡P < 0.1; # P < 0.05; ## P < 0.01.
2
A (plasma) B (erythrocytes) 0.0 0.1 0.2 0.3 0.4
0.00 0.05 0.10 0.15 0.20 0.25 P mat t 9
r = 0.18 P = 0.39 r = 0.20 P = 0.51
0.0 0.1 0.2
0.00 0.10 0.20 0.30 P mat t 11
r = 0.58 P < 0.01 r = 0.59 P < 0.05
0.0 1.0 2.0 3.0 4.0 5.0
0.0 0.5 1.0 1.5 2.0 2.5 P mat t 9/ t 11-index
t
9/
t
11-index
r = 0.54 P < 0.01 r = 0.09 P = 0.78
0.0 0.1 0.2 0.3 0.4
0.0 0.1 0.2 0.3 0.4 P mat c 9, t 11 CLA
Pfe
t
c 9,
t
11
CLA
r = 0.74 P < 0.01 r = 0.75 P < 0.01
0.0 0.1 0.2 0.3 0.4
0.00 0.05 0.10 0.15 0.20 0.25 E mat t 9
r = -0.09 P = 0.66 r = 0.27 P = 0.38
0.0 0.1 0.2
0.00 0.10 0.20 0.30 E mat t 11
r = 0.28 P = 0.17 r = 0.17 P = 0.57
0.0 1.0 2.0 3.0 4.0 5.0
0.0 0.5 1.0 1.5 2.0 2.5
E mat t 9/ t 11-index
t 9/ t 11-index
r = 0.18 P = 0.39 r = 0.69 P < 0.01
0.0 0.1 0.2 0.3 0.4
0.0 0.1 0.2 0.3 0.4 E mat c 9, t 11 CLA
c
9,
t
11 CLA
r = 0.25 P = 0.22 r = 0.01 P = 0.96
0.0 0.1 0.2 0.3 0.4
0.0 0.1 0.2 0.3 P mat t 11
c 9,
t
11
CLA
r = 0.51 P < 0.01 r = 0.43 P = 0.17
0.0 0.1 0.2 0.3 0.4
0.0 0.1 0.2 0.3 E mat t 11
c
9,
t
11 CLA
r = 0.39 P < 0.05 r = 0.24 P = 0.44
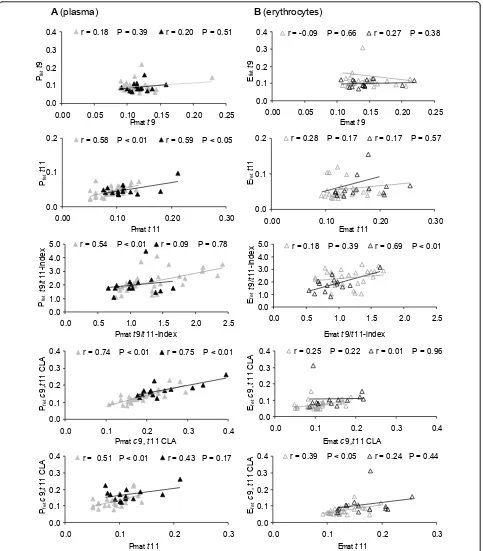
Pfe t t 9 Efe t t 9 Pfe t t 11 Efe t t 11 Pfe t Efe t Efe t Efe t Pfe t
Figure 1Correlation of the individualtFA, thet9/t11-index, andc9,t11 CLA. Correlation between the respective fatty acid in maternal and
-Impact of high dairy fat intake on composition of fatty acids in blood lipids
The present results clearly showed an association between ruminant fat consumption and fatty acid distri-bution of human lipids. A high dairy fat intake in mothers (> 40 g/d) resulted in increasedc9,t11 CLA and totaltFA, especially t11 in blood lipids. Moreover, the raisedt11 concentrations resulted in a decreased mater-nalt9/t11-index (Table 5).
In breast milk of mothers with comparably high con-sumption of dairy fat (> 40 g/d), elevatedt11 andc9,t11 CLA and a decreasedt9/t11-index were also observed [30,44]. The increase in the milk specific fatty acids C15:0 and C17:0 in maternal blood also confirmed the high dairy fat intake in the present study (Table 5). Simi-lar results were obtained in breast milk in a former study [44]. Interestingly, due to a maternal high dairy fat intake, onlyc9,t11 CLA and nott11 was elevated in the corre-sponding fetal blood lipids (Table 5).
However, there was a positive correlation of t11 in plasma between mother and child (not in erythrocytes, Figure 1). The t9 levels did not significantly differ and there was no correlation between maternal and fetal lipids on comparing a high and low dairy fat diet (Table 5). Although the results point to differences between t9 andt11 regarding metabolism and/or transfer, respective data are not yet available for humans.
-Transfatty acids and long chain-PUFA in maternal and
fetal blood lipids
The composition of maternal dietary fat and body fat depot [14,35] strongly accounts for the fatty acid composi-tion in fetal tissue. However, the increased amounts of n-6 LC-PUFA (AA, DPA) and n-3 LC-PUFA (DPA, DHA) in fetal plasma and erythrocytes compared to maternal lipids observed in the present and former studies is physiologi-cally consistent and attributed to the special requirements of the fetus (Table 3) [46,47]. Further, a wide range of fatty acid transporters and binding proteins in the placenta determines the enrichment of these LC-PUFA [11,12].
Several publications show an inverse association between totaltFA and both n-6 (e.g. AA) as well as n-3 LC-PUFA (e.g. DHA) in blood lipids. However, since these data only deal with either maternal or fetal blood lipids and not with their interaction as well as different lipid fractions were used, comparison is difficult [18,20]. In the present study, totaltFA were also inversely asso-ciated with the sum of n-6, but not n-3 LC-PUFA within the same blood fraction (partly significant; Table 4(A)). Regarding n-3 LC-PUFA in fetal plasma, a nega-tive correlation was only found for t9, but not for t11 (Table 4(A). This result might be of relevance, since n-3 have been shown to extend anti-inflammatory effects [5].
Concerning the relationship between maternal and fetal lipids, the current study data showed a positive cor-relation oft11 to n-3 LC-PUFA, however, the result was only significant in erythrocytes (Table 4(B)). This effect could be associated with a higher dairy fat intake, since n-3 LC-PUFA (EPA, DPA, DHA) were significantly ele-vated in the respective fetal plasma (Table 5). Some stu-dies have revealed the ability of tFA to inhibit several enzymes involved in LC-PUFA synthesis but without distinguishing between industrial and ruminant tFA [48,49]. However, there is little data regarding the impact oftFA on placental fatty acid transporters show-ing that t9 may inhibit binding of PUFA at placental membranes [50].
Differences betweent9 andt11 indicated herein might be the result of isomer-specific influences on transcrip-tion factors (such as PPARs) involved in the expression of placental transport proteins [51,52]. From cellular and animal models, there is evidence that t9 inhibits [53] andt11 activates [54] PPAR expression. Thus, dif-ferences in PPAR activation by t9 andt11 could inter-fere with the cellular uptake of LC-PUFA into the placenta [55,56].
Conclusions
We analysed for the first time individual isomers of
trans C18:1 in blood lipids of mother-child pairs at
birth and found differences betweent9 andt11.
In fetal lipids,t11 accumulation was only half that of t9, probably due to t11 conversion to c9,t11 CLA. In general, totaltFA, includingt9 andt11, were higher in maternal than in fetal lipids. The present results also demonstrated that maternal high dairy fat intake led to increasedt11 andc9,t11 CLA in the blood lipids. How-ever,t11 was not increased in the respective fetal lipids. In addition, the essential n-3 LC-PUFA were elevated in fetal blood lipids.
Thus,tFA have to be distinguished according to their origin (ruminant or industrial) to separately investigate their possible influence on fetal development and human health.
Abbreviations
AA: arachidonic acid; CLA: conjugated linoleic acids; DHA: docosahexaenoic acid; DPA: docosapentaenoic acid; en%: energy %; Ematand Efet: maternal
and fetal erythrocytes; EPA: eicosapentaenoic acid; FAME: fatty acid methyl esters; MUFA: monounsaturated fatty acids; n-3 and n-6 LC-PUFA: omega-3 and omega-6 long chain polyunsaturated fatty acids; Pmatand Pfet: maternal
and fetal plasma; SFA: saturated fatty acids;tFA:transfatty acids;t9:trans-9 C18:1 (elaidic acid);t11:trans-11 C18:1 (vaccenic acid).
Acknowledgements
we thank Udo Markert for his support and Nasim Kroegel for linguistic review of the manuscript.
Author details
1
Placenta Laboratory, Department of Obstetrics, Jena University Hospital, Friedrich Schiller University Jena, Bachstrasse 18, Jena, Germany.
2
Department of Nutritional Physiology, Institute of Nutrition, Friedrich Schiller University Jena, Dornburger Str. 24, Jena, Germany.
Authors’contributions
UE, LS, GJ, and ES designed the study, UE and LS collected the samples. AJ and KK performed fatty acid analysis. UE performed the Prodi evaluation and the statistical analyses. UE, KK and AJ wrote the paper. All authors read and approved the final manuscript.
Competing interests
The authors declare that they have no competing interests.
Received: 18 November 2011 Accepted: 30 December 2011 Published: 30 December 2011
References
1. Barker DJ:The origins of the developmental origins theory.J Intern Med 2007,261:412-417.
2. Warner JO:The early life origins of asthma and related allergic disorders. Arch Dis Child2004,89:97-102.
3. Wyrwoll CS, Mark PJ, Mori TA, Puddey IB, Waddell BJ:Prevention of programmed hyperleptinemia and hypertension by postnatal dietary omega-3 fatty acids.Endocrinology2006,147:599-606.
4. Enke U, Seyfarth L, Schleussner E, Markert UR:Impact of PUFA on early immune and fetal development.Br J Nutr2008,100:1158-1168. 5. Prescott SL, Barden AE, Mori TA, Dunstan JA:Maternal fish oil
supplementation in pregnancy modifies neonatal leukotriene production by cord-blood-derived neutrophils.Clin Sci (Lond)2007, 113:409-416.
6. Mozaffarian D, Aro A, Willett WC:Health effects of trans-fatty acids: experimental and observational evidence.Eur J Clin Nutr2009,63(Suppl 2):S5-21.
7. van de Vijver LP, van Poppel G, van Houwelingen A, Kruyssen DA, Hornstra G:Trans unsaturated fatty acids in plasma phospholipids and coronary heart disease: a case-control study.Atherosclerosis1996, 126:155-161.
8. Weiland SK, von Mutius E, Husing A, Asher MI:Intake of trans fatty acids and prevalence of childhood asthma and allergies in Europe. ISAAC Steering Committee.Lancet1999,353:2040-2041.
9. Williams MA, King IB, Sorensen TK, Zingheim RW, Troyer BL, Zebelman AM, Luthy DA:Risk of preeclampsia in relation to elaidic acid (trans fatty acid) in maternal erythrocytes.Gynecol Obstet Invest1998,46:84-87. 10. Innis SM:Trans fatty intakes during pregnancy, infancy and early
childhood.Atheroscler Suppl2006,7:17-20.
11. Haggarty P, Ashton J, Joynson M, Abramovich DR, Page K:Effect of maternal polyunsaturated fatty acid concentration on transport by the human placenta.Biol Neonate1999,75:350-359.
12. Dutta-Roy AK:Cellular uptake of long-chain fatty acids: role of membrane-associated fatty-acid-binding/transport proteins.Cell Mol Life Sci2000,57:1360-1372.
13. Vlaardingerbroek H, Hornstra G:Essential fatty acids in erythrocyte phospholipids during pregnancy and at delivery in mothers and their neonates: comparison with plasma phospholipids.Prostaglandins Leukot Essent Fatty Acids2004,71:363-374.
14. Dunstan JA, Mori TA, Barden A, Beilin LJ, Holt PG, Calder PC, Taylor AL, Prescott SL:Effects of n-3 polyunsaturated fatty acid supplementation in pregnancy on maternal and fetal erythrocyte fatty acid composition.Eur J Clin Nutr2004,58:429-437.
15. Innis SM:Essential fatty acid transfer and fetal development.Placenta 2005,26(Suppl A):S70-75.
16. van Houwelingen AC, Foreman-van Drongelen MM, Nicolini U,
Nicolaides KH, Al MD, Kester AD, Hornstra G:Essential fatty acid status of fetal plasma phospholipids: similar to postnatal values obtained at comparable gestational ages.Early Hum Dev1996,46:141-152.
17. Müller A, Keller U, Seliger G, Barthel C, Steinhart H, Eder K:Concentrations of conjugated linoleic acids in neonatal blood in relationship to those in maternal blood.Prostaglandins Leukot Essent Fatty Acids2007,76:213-219. 18. Elias SL, Innis SM:Infant plasma trans, n-6, and n-3 fatty acids and
conjugated linoleic acids are related to maternal plasma fatty acids, length of gestation, and birth weight and length.Am J Clin Nutr2001, 73:807-814.
19. Berghaus TM, Demmelmair H, Koletzko B:Fatty acid composition of lipid classes in maternal and cord plasma at birth.Eur J Pediatr1998, 157:763-768.
20. Decsi T, Burus I, Molnar S, Minda H, Veitl V:Inverse association between trans isomeric and long-chain polyunsaturated fatty acids in cord blood lipids of full-term infants.Am J Clin Nutr2001,74:364-368.
21. Kuhnt K, Baehr M, Rohrer C, Jahreis G:Trans fatty acid isomers and the trans-9/trans-11 index in fat containing foods.Eur J Lipid Sci Technol2011, 113:1281-1292.
22. Kuhnt K, Kraft J, Moeckel P, Jahreis G:Trans-11-18: 1 is effectively Delta9-desaturated compared with trans-12-18: 1 in humans.Br J Nutr2006, 95:752-761.
23. Corl BA, Baumgard LH, Dwyer DA, Griinari JM, Phillips BS, Bauman DE:The role of Delta(9)-desaturase in the production of cis-9, trans-11 CLA.J Nutr Biochem2001,12:622-630.
24. Field CJ, Blewett HH, Proctor S, Vine D:Human health benefits of vaccenic acid.Appl Physiol Nutr Metab2009,34:979-991.
25. Turpeinen AM, Mutanen M, Aro A, Salminen I, Basu S, Palmquist DL, Griinari JM:Bioconversion of vaccenic acid to conjugated linoleic acid in humans.Am J Clin Nutr2002,76:504-510.
26. Mosley EE, McGuire MK, Williams JE, McGuire MA:Cis-9, trans-11 conjugated linoleic acid is synthesized from vaccenic acid in lactating women.J Nutr2006,136:2297-2301.
27. Kanwar RK, Macgibbon AK, Black PN, Kanwar JR, Rowan A, Vale M, Krissansen GW:Bovine milk fat enriched in conjugated linoleic and vaccenic acids attenuates allergic airway disease in mice.Clin Exp Allergy 2008,38:208-218.
28. Jaudszus A, Krokowski M, Mockel P, Darcan Y, Avagyan A, Matricardi P, Jahreis G, Hamelmann E:Cis-9,trans-11-conjugated linoleic acid inhibits allergic sensitization and airway inflammation via a PPARgamma-related mechanism in mice.J Nutr2008,138:1336-1342.
29. Kuhnt K, Wagner A, Kraft J, Basu S, Jahreis G:Dietary supplementation with 11trans- and 12trans-18: 1 and oxidative stress in humans.Am J Clin Nutr2006,84:981-988.
30. Rist L, Mueller A, Barthel C, Snijders B, Jansen M, Simoes-Wust AP, Huber M, Kummeling I, von Mandach U, Steinhart H, Thijs C:Influence of organic diet on the amount of conjugated linoleic acids in breast milk of lactating women in the Netherlands.Br J Nutr2007,97:735-743. 31. Thijs C, Mueller A, Rist L, Kummeling I, Snijders BE, Huber M, van Ree R,
Simoes-Wust AP, Dagnelie PC, van den Brandt PA:Fatty acids in breast milk and development of atopic eczema and allergic sensitisation in infancy.Allergy2011,66:58-67.
32. Bligh EG, Dyer WJ:A rapid method of total lipid extraction and purification.Can J Biochem Physiol1959,37:911-917.
33. Degen C, Lochner A, Keller S, Kuhnt K, Daenicke S, Jahreis G:Influence of in vitro supplementation with lipids from conventional and Alpine milk on fatty acid distribution and cell growth of HT-29 cells.Lipids Health Dis 2011,10:131.
34. Destaillats F, Golay PA, Joffre F, de Wispelaere M, Hug B, Giuffrida F, Fauconnot L, Dionisi F:Comparison of available analytical methods to measure trans-octadecenoic acid isomeric profile and content by gas-liquid chromatography in milk fat.J Chromatogr A2007,1145:222-228. 35. Lakin V, Haggarty P, Abramovich DR, Ashton J, Moffat CF, McNeill G,
Danielian PJ, Grubb D:Dietary intake and tissue concentration of fatty acids in omnivore, vegetarian and diabetic pregnancy.Prostaglandins Leukot Essent Fatty Acids1998,59:209-220.
36. Shahin AM, McGuire MK, Anderson N, Williams J, McGuire MA:Effects of margarine and butter consumption on distribution of trans-18:1 fatty acid isomers and conjugated linoleic acid in major serum lipid classes in lactating women.Lipids2006,41:141-147.
38. Craig-Schmidt MC:World-wide consumption of trans fatty acids. Atheroscler Suppl2006,7:1-4.
39. Gabriel S:Ermittlung der Aufnahme von trans-Fettsäuren durch Lebensmittel in Deutschland.Diploma thesisFriedrich Schiller University Jena, Institute of Nutrition, Department of Nutritional Physiology; in cooperation with the Federal Institute for Risk Assessment (BfR); 2009. 40. Precht D, Molkentin J:Rapid analysis of the isomers of
trans-octadecenoic acid in milk fat.Int Dairy J1996,6:791-809.
41. Du ZY, Degrace P, Gresti J, Loreau O, Clouet P:Vaccenic and elaidic acid equally esterify into triacylglycerols, but differently into phospholipids of fed rat liver cells.Lipids2011,46:647-657.
42. Du ZY, Degrace P, Gresti J, Loreau O, Clouet P:Dissimilar properties of vaccenic versus elaidic acid in beta-oxidation activities and gene regulation in rat liver cells.Lipids2010,45:581-591.
43. Mendis S, Cruz-Hernandez C, Ratnayake WM:Fatty acid profile of Canadian dairy products with special attention to the trans-octadecenoic acid and conjugated linoleic acid isomers.J AOAC Int2008,91:811-819.
44. Mueller A, Thijs C, Rist L, Simoes-Wust AP, Huber M, Steinhart H:Trans fatty acids in human milk are an indicator of different maternal dietary sources containing trans fatty acids.Lipids2010,45:245-251. 45. Banni S, Carta G, Angioni E, Murru E, Scanu P, Melis MP, Bauman DE,
Fischer SM, Ip C:Distribution of conjugated linoleic acid and metabolites in different lipid fractions in the rat liver.J Lipid Res2001,42:1056-1061. 46. Innis SM:Metabolic programming of long-term outcomes due to fatty
acid nutrition in early life.Matern Child Nutr2011, ,7:112-123. 47. Lauritzen L, Carlson SE:Maternal fatty acid status during pregnancy and
lactation and relation to newborn and infant status.Matern Child Nutr 2011,7(Suppl 2):41-58.
48. Larque E, Perez-Llamas F, Puerta V, Giron MD, Suarez MD, Zamora S, Gil A: Dietary trans fatty acids affect docosahexaenoic acid concentrations in plasma and liver but not brain of pregnant and fetal rats.Pediatr Res 2000,47:278-283.
49. Puca AA, Andrew P, Novelli V, Anselmi CV, Somalvico F, Cirillo NA, Chatgilialoglu C, Ferreri C:Fatty acid profile of erythrocyte membranes as possible biomarker of longevity.Rejuvenation Res2008,11:63-72. 50. Campbell FM, Gordon MJ, Dutta-Roy AK:Preferential uptake of long chain
polyunsaturated fatty acids by isolated human placental membranes. Mol Cell Biochem1996,155:77-83.
51. Cunningham P, McDermott L:Long chain PUFA transport in human term placenta.J Nutr2009,139:636-639.
52. Xu Y, Wang Q, Cook TJ, Knipp GT:Effect of placental fatty acid metabolism and regulation by peroxisome proliferator activated receptor on pregnancy and fetal outcomes.J Pharm Sci2007, 96:2582-2606.
53. Saravanan N, Haseeb A, Ehtesham NZ, Ghafoorunissa :Differential effects of dietary saturated and trans-fatty acids on expression of genes associated with insulin sensitivity in rat adipose tissue.Eur J Endocrinol 2005,153:159-165.
54. Lampen A, Leifheit M, Voss J, Nau H:Molecular and cellular effects of cis-9, trans-11-conjugated linoleic acid in enterocytes: effects on proliferation, differentiation, and gene expression.Biochim Biophys Acta 2005,1735:30-40.
55. Johnsen GM, Weedon-Fekjaer MS, Tobin KA, Staff AC, Duttaroy AK: Long-chain polyunsaturated fatty acids stimulate cellular fatty acid uptake in human placental choriocarcinoma (BeWo) cells.Placenta2009, 30:1037-1044.
56. Di Nunzio M, Danesi F, Bordoni A:n-3 PUFA as regulators of cardiac gene transcription: a new link between PPAR activation and fatty acid composition.Lipids2009,44:1073-1079.
doi:10.1186/1476-511X-10-247
Cite this article as:Enkeet al.:Fatty acid distribution of cord and maternal blood in human pregnancy: special focus on individualtrans fatty acids and conjugated linoleic acids.Lipids in Health and Disease2011 10:247.
Submit your next manuscript to BioMed Central and take full advantage of:
• Convenient online submission
• Thorough peer review
• No space constraints or color figure charges
• Immediate publication on acceptance
• Inclusion in PubMed, CAS, Scopus and Google Scholar
• Research which is freely available for redistribution