Open Access
Research article
Incongruence between test statistics and P
values in medical papers
Emili García-Berthou* and Carles Alcaraz
Address: Department of Environmental Sciences, University of Girona, E-17071 Girona, Spain
Email: Emili García-Berthou* - emili.garcia@udg.es; Carles Alcaraz - carles.alcaraz@udg.es * Corresponding author
Abstract
Background: Given an observed test statistic and its degrees of freedom, one may compute the observed P value with most statistical packages. It is unknown to what extent test statistics and P
values are congruent in published medical papers.
Methods: We checked the congruence of statistical results reported in all the papers of volumes 409–412 of Nature (2001) and a random sample of 63 results from volumes 322–323 of BMJ (2001). We also tested whether the frequencies of the last digit of a sample of 610 test statistics deviated from a uniform distribution (i.e., equally probable digits).
Results: 11.6% (21 of 181) and 11.1% (7 of 63) of the statistical results published in Nature and BMJ
respectively during 2001 were incongruent, probably mostly due to rounding, transcription, or type-setting errors. At least one such error appeared in 38% and 25% of the papers of Nature and
BMJ, respectively. In 12% of the cases, the significance level might change one or more orders of magnitude. The frequencies of the last digit of statistics deviated from the uniform distribution and suggested digit preference in rounding and reporting.
Conclusions: This incongruence of test statistics and P values is another example that statistical practice is generally poor, even in the most renowned scientific journals, and that quality of papers should be more controlled and valued.
Background
Statistics is a difficult topic to teach and learn and there is ample evidence that its application is often faulty in med-icine [1-6] as well as in many other scientific disciplines. Errors include aspects of design, analysis, and reporting and interpretation. Although there has recently been con-siderable effort to improve and standardise the reporting of medical research (e.g., the CONSORT statement for randomised controlled trials [7]), there is almost no liter-ature demonstrating the incorrect computation or report-ing of results beyond general deficiencies of computer packages [8,9] or some well-scrutinized data such as Ben-ford's original data [10]. Beyond deficiencies of software,
such numerical errors may later originate in the transcrip-tion of results from computer outputs to reports and man-uscripts, wrong rounding of results, or uncorrected typesetting errors. We investigated this question by check-ing the statistical results reported in all the papers of vol-umes 409–412 of Nature (2001) and some papers in vol. 322–323 of BMJ (2001). We show that the occurrence of errors is very high and we review ways to improve current practice.
Methods
Given an observed test statistic and its degrees of freedom
(df), one may compute the observed P value or
Published: 28 May 2004
BMC Medical Research Methodology 2004, 4:13
Received: 02 January 2004 Accepted: 28 May 2004
This article is available from: http://www.biomedcentral.com/1471-2288/4/13
significance level (or vice versa) with most statistical pack-ages. We are thus able to check the congruence of results consisting of the test statistic, df and a precise P value. We cannot check results consisting only of a P value or with no precise P value (e.g. P < 0.05 instead of P = 0.023) and therefore these were not considered in our review. Note that the latter are bad practices and reporting both the observed test statistic and the "exact" P value has been rec-ommended [3]. We did not check the congruence of con-fidence intervals and other statistics because it would be generally impossible without access to the raw data.
We checked all the statistical results (consisting of the test statistic, df and a precise P value) reported in all the papers of volumes 409–412 of Nature (2001) and 12 randomly selected papers from vol. 322–323 of BMJ (2001). We checked the results with three different packages: SPSS for Windows 10.1, STATISTICA '98 for Windows, and the free-ware NCSS Probability Calculator for Windows. The results of the three statistical packages were identical at least up to the 4th decimal. All the results checked and the errors detected are detailed in Table 1 for BMJ (see Additional file 1) and Table 2 for Nature (see Additional file 2).
We only determined that a result was in error when it was not possibly due to rounding in the original paper. For instance, the result of "χ2 = 1.7, df = 1, P = 0.30" in vol.
322, p. 769–770 of BMJ cannot be due to correct rounding of the test statistic and P value, given the following precise results: χ2 = 1.65, df = 1, P = 0.199; χ2 = 1.70, df = 1, P =
0.192; χ2 = 1.75, df = 1, P = 0.186. If the statistic was really χ2 = 1.7, then the P value should have been much lower
than 0.3. In fact, a χ2 of 1.07 with 1 df yields a P value of
0.3, suggesting a reporting error. In contrast, the result "χ2
= 1.2, df = 2, P = 0.54" in vol. 322, p. 336–342 is congru-ent with the following precise results after rounding: χ2 =
1.15, df = 2, P = 0.563; χ2 = 1.20, df = 2, P = 0.549; χ2 =
1.25, df = 2, P = 0.535.
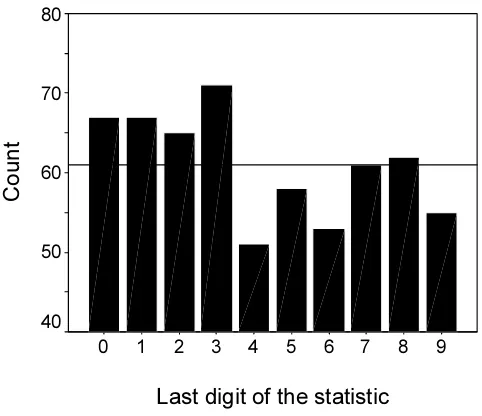
We also tested whether the frequencies of the last digit of the P values found and an additional random sample of 610 statistics (Table 3, see Additional file 3) in the same volumes 409–412 of Nature deviated significantly from the uniform distribution with the Kolmogorov-Smirnov test (with SPSS for Windows 10.1). For leading digits, Ben-ford's law (i.e., that the distribution of first digits follows a logarithmic pattern, with probability decreasing from 0 to 9) is usually observed. Benford's law states that for the first digit the probability of 1 is 30.1% while the probabil-ity for 9 is 4.6% [11]. However, the distribution flattens out progressively for subsequent digits and the difference is only 12.0% for 0 and 8.5% for 9 for the second digit (and 10.2% and 9.8% respectively for the third digit). As the statistics analysed were usually reported to 3–4 signif-icant figures, a uniform distribution (i.e. equally probable
digits) should be rather expected. Similar analyses of equiprobability of last digits have been performed in a variety of medical contexts to detect digit preference and check the accuracy of databases [12-16].
Results and discussion
We found that a surprising 11.6% (21 of 181) of the com-putations in Nature were incongruent (Table 2, see Addi-tional file 2). A less exhaustive check in BMJ resulted in a very similar percentage (11.1%, 7 of 63) (Table 1, see Additional file 1). At least one such error appeared in 38% (12 of 32) and 25% (3 of 12) of the papers of Nature and
BMJ respectively, indicating that they are widespread and not concentrated in a few papers. For instance, in vol. 411,
p. 88 of Nature "F2,14 = 10.89, P = 0.014" was reported
while the congruent P value is 0.0014, suggesting a tran-scription error. Another trantran-scription error is "F7,79 = 7.09,
P = 0.0094" in vol. 412, p. 74, in which the P value corre-sponds to an F with 1 and 79 degrees of freedom.
Many errors are probably due to incorrect rounding, e.g. "r = 0.30, N = 21, P = 0.20" (congruent P = 0.186) in vol. 411, p. 297 of Nature or "χ2 = 0.01, df = 1, P = 1.00"
(con-gruent P = 0.92) in vol. 322, p. 336–342 of BMJ. Some authors state P = 0.001, when they should state P < 0.001 or P << 0.001.
These incongruences are probably due to inaccurate rounding or transcription. Software deficiencies are usu-ally orders of magnitude less important [8,9], and would be restricted to specific papers using a certain statistical package, contrary to our findings of over 25% of the papers with errors. Most typesetting errors are probably detected by authors' corrections and errors in previous steps of manuscript preparation are probably more fre-quent and difficult to detect.
per-formed by authors in a consistent manner (e.g., to 3–4 sig-nificant figures).
The estimate of 11–12% of incongruent statistical results is a conservative one since some cases were not considered errors because they might have been caused by rounding. It is not possible to be certain of the real importance of these errors because without access to the raw data, we do not know the correct result. Apparently, the conclusion would change from significant to nonsignificant in only about 4% (1/27) of the errors (1 error reporting "1,9" df for a t statistic was not considered) using the arbitrary 5% level. However, the median of the relative bias (absolute difference between the reported and congruent P values, divided by the congruent P value) was 38% and in 12% of the cases the relative bias was larger than 10%, showing that the significance level might change one or more orders of magnitude.
Although these kinds of errors may leave unchanged the conclusions of a study and other errors might be more harmful, they are indicative of poor practice. Our concern is that these kinds of errors are probably present in all numerical results (e.g., means, percentages, confidence intervals) and all steps of scientific research, with poten-tially important practical consequences. Moreover, poor presentation provides clues that there may be serious errors elsewhere [17]. Our findings confirm that the qual-ity of research and scientific papers needs improvement and should be more carefully checked and evaluated in these days of high publication pressure [18-20].
Conclusions
Several detailed guidelines on the practice and reporting of statistics in medical papers are available. [3,7,21,22]. There is considerable consensus on the most desirable practices, and some of their suggestions are:
1) In medical research, confidence intervals are often more appropriate than hypothesis testing. If hypothesis testing is used, it is desirable to report not only the P val-ues but also the observed valval-ues of test statistics and the degrees of freedom.
2) Exact P values (to no more than two significant figures) should be given rather than reporting P > 0.05 or P < 0.01. It is unnecessary to specify levels of P lower than 0.0001.
3) Spurious precision adds no value to a paper and even detracts from its readability and credibility. Results need to be rounded [23-25].
To this we need to add that:
1) Numerical results should be correctly rounded. The problem of introducing bias by rounding digits ending in five [26] is a trivial one compared to the misuses reported in our paper.
Histogram of the last digit of 610 test statistics (see Addi-tional file 3) in volumes 409–412 of Nature
Figure 1
Histogram of the last digit of 610 test statistics (see Addi-tional file 3) in volumes 409–412 of Nature. The reference line corresponds to the mean count (61).
Histogram of the last digit of 181 P values (see Additional file 2) in volumes 409–412 of Nature
Figure 2
Histogram of the last digit of 181 P values (see Additional file 2) in volumes 409–412 of Nature. The reference line corre-sponds to the mean count (18.1).
Last digit of the statistic
9 8 7 6 5 4 3 2 1 0Count
80
70
60
50
40
Last digit of P value
9 8 7 6 5 4 3 2 1 0
Count
30
20
10
2) The preparation and editing of manuscripts should be more carefully checked. Increasing the use in medical journals of statistical reviewers [1,17] and of unlimited publication of correspondence on the web [2] may help to improve the quality of papers.
3) In principle, authors of research papers (including sys-tematic reviews) should make the raw data freely available on the Internet and journals should implement and stim-ulate this practice. The benefits of this recent practice mainly involve: further analyses not directly addressed by the primary researchers are possible [27,28], including effective systematic review and meta-analysis [29] or the estimation of adequate sample sizes (power analysis) [30]; other researchers can check whether the results are correct and the conclusions justified [29,30]; fraud and sloppiness may be more easily detected and is thus dis-couraged [27].
4) The software version or code used should also be stated, since this gives many hints of the methods used.
Among others, Altman and coauthors give details of many other ways to improve the practice and reporting of statistics in medicine and their suggestions are widely applicable to other research fields [1,3,5,17].
Competing interests
None declared.Authors' contributions
EGB initiated, designed and supervised the study. CA did the journal search and statistical checking of results. All authors participated in analysing and discussing the data and in writing the paper.
Additional material
Acknowledgements
We thank the comments of DG Altman, VA Ferraris, A Harris, and BD McCullough, which greatly improved previous versions of the manuscript. CA held a doctoral fellowship (FPU AP 2002-0206) from the Spanish Min-istry of Education.
References
1. Altman DG: Statistics in medical journals. Stat Med 1982,
1:59-71.
2. Altman DG: Poor-quality medical research: what can journals do?JAMA 2002, 287:2765-2767.
3. Altman DG, Gore SM, Gardner MJ, Pocock SJ: Statistical guide-lines for contributors to medical journals. BMJ 1983,
286:1489-1493.
4. O'Fallon JR, Dubey SD, Salsburg DS, Edmonson JH, Soffer A, Colton T: Should there be statistical guidelines for medical research papers?Biometrics 1978, 34:687-695.
5. Altman DG, Bland JM: Improving doctors' understanding of statistics.J R Statist Soc A 1991, 154:223-267.
6. Altman DG: Statistics in medical journals: developments in the 1980s.Stat Med 1991, 10:1897-1913.
7. Altman DG, Schulz KF, Moher D, Egger M, Davidoff F, Elbourne D, Gøtzsche PC, Lang T, for the CONSORT group: The Revised CONSORT Statement for Reporting Randomized Trials: Explanation and Elaboration.Ann Intern Med 2001, 134:663-694. 8. McCullough BD: Assessing the Reliability of Statistical
Soft-ware: Part II.Am Stat 1999, 53:149-159.
9. McCullough BD: On the accuracy of statistical procedures in Microsoft Excel 97.Comput Statist Data Anal 1999, 31:27-37. 10. Diaconis P, Freedman D: On rounding percentages.J Amer Stat
Associ 1979, 74:359-364.
11. Benford F: The Law of Anomalous Numbers.Proc Amer Phil Soc
1938, 78:551-572.
12. Edouard L, Senthilselvan A: Observer error and birthweight: digit preference in recording.Public Health 1997, 111:77-79. 13. Savitz DA, Dole N, Siega-Riz AM, Herring AH: Comparison of
pregnancy dating by last menstrual period, ultrasound scan-ning, and their combination. Am J Obstet Gynecol 2002,
187:1660-1666.
14. Clemons T, Pagano M: Are Babies Normal? Am Stat 1999,
53:298-302.
15. Greer W: Preprocessing histograms of age at menopause using the fast Fourier transform.Maturitas 2003, 44:267-277. 16. K Kuulasmaa, H-W Hense, H Tolonen: Quality Assessment of Data on
Blood Pressure in the WHO MONICA Project 1998 in press. http:// www4.ktl.fi/publications/monica/bp/bpqa.htm
17. Altman DG: Statistical reviewing for medical journals.Stat Med
1998, 17:2661-2674.
18. Hawkins BA: More haste, less science?Nature 1999, 400:498. 19. Altman DG: Statistics in medical journals: some recent
trends.Stat Med 2000, 19:3275-3289.
20. Altman DG: The scandal of poor medical research.BMJ 1994,
308:283-284.
21. Bailar JC III, Mosteller F: Guidelines for statistical reporting in articles for medical journals. Amplifications and explanations.Ann Intern Med 1988, 108:266-273.
22. Altman DG, Bland JM: Presentation of numerical data.BMJ 1996,
312:572.
23. Ehrenberg ASC: The problem of numeracy. Am Stat 1981,
35:67-71.
24. Ehrenberg ASC: Rudiments of numeracy.J R Statist Soc A 1977,
140:277-297.
25. Finney DJ, Harper JL: Editorial code for presentation of statisti-cal analyses.Proc R Soc Lond, Ser B: Biol Sci 1993, 254:287-288. 26. Green D: Eliminating bias due to rounding.Teaching Statistics
1990, 12:69.
27. Smith GD: Increasing the accessibility of data. BMJ 1994,
308:1519-1520.
Additional File 1
The 63 statististical results checked and 7 errors detected from volumes 322–323 of BMJ.
Click here for file
[http://www.biomedcentral.com/content/supplementary/1471-2288-4-13-S1.doc]
Additional File 2
The 181 statististical results checked and 21 errors detected from volumes 409–412 of Nature.
Click here for file
[http://www.biomedcentral.com/content/supplementary/1471-2288-4-13-S2.doc]
Additional File 3
Last digit of 610 test statistics in the volumes 409–412 of Nature.
Click here for file
Publish with BioMed Central and every scientist can read your work free of charge "BioMed Central will be the most significant development for disseminating the results of biomedical researc h in our lifetime."
Sir Paul Nurse, Cancer Research UK
Your research papers will be:
available free of charge to the entire biomedical community
peer reviewed and published immediately upon acceptance
cited in PubMed and archived on PubMed Central
yours — you keep the copyright
Submit your manuscript here:
http://www.biomedcentral.com/info/publishing_adv.asp
BioMedcentral
28. Hoaglin DC, Andrews DF: The reporting of computation-based results in statistics.Am Stat 1975, 29:122-126.
29. Hutchon DJR: Infopoints: Publishing raw data and real time statistical analysis on e-journals.BMJ 2001, 322:530.
30. Delamothe T: Whose data are they anyway? BMJ 1996,
312:1241-1242.
Pre-publication history
The pre-publication history for this paper can be accessed here: