R E S E A R C H A R T I C L E
Open Access
Reporting of statistically significant results
at ClinicalTrials.gov for completed
superiority randomized controlled trials
Agnes Dechartres
1,2,3,4*†, Elizabeth G. Bond
4,5†, Jordan Scheer
2, Carolina Riveros
1,2, Ignacio Atal
1,3,4and Philippe Ravaud
1,2,3,4,5Abstract
Background:Publication bias and other reporting bias have been well documented for journal articles, but no study has evaluated the nature of results posted at ClinicalTrials.gov. We aimed to assess how many randomized controlled trials (RCTs) with results posted at ClinicalTrials.gov report statistically significant results and whether the proportion of trials with significant results differs when no treatment effect estimate orp-value is posted.
Methods:We searched ClinicalTrials.gov in June 2015 for all studies with results posted. We included completed RCTs with a superiority hypothesis and considered results for the first primary outcome with results posted. For each trial, we assessed whether a treatment effect estimate and/orp-value was reported at ClinicalTrials.gov and if yes, whether results were statistically significant. If no treatment effect estimate orp-value was reported, we calculated the treatment effect and correspondingp-value using results per arm posted at ClinicalTrials.gov when sufficient data were reported.
Results:From the 17,536 studies with results posted at ClinicalTrials.gov, we identified 2823 completed phase 3 or 4 randomized trials with a superiority hypothesis. Of these, 1400 (50%) reported a treatment effect estimate and/or p-value. Results were statistically significant for 844 trials (60%), with a medianp-value of 0.01 (Q1-Q3: 0.001–0.26). For the 1423 trials with no treatment effect estimate orp-value posted, we could calculate the treatment effect and correspondingp-value using results reported per arm for 929 (65%). For 494 trials (35%),p-values could not
be calculated mainly because of insufficient reporting, censored data, or repeated measurements over time. For the 929 trials we could calculatep-values, we found statistically significant results for 342 (37%), with a medianp-value of 0.19 (Q1-Q3: 0.005–0.59).
Conclusions:Half of the trials with results posted at ClinicalTrials.gov reported a treatment effect estimate and/or p-value, with significant results for 60% of these.p-values could be calculated from results reported per arm at ClinicalTrials.gov for only 65% of the other trials. The proportion of significant results was much lower for these trials, which suggests a selective posting of treatment effect estimates and/orp-values when results are statistically significant.
Keywords:Clinical trials, Reporting, Publication bias, Registration, Results, Transparency
* Correspondence:[email protected] †Equal contributors
1Centre de Recherche Epidémiologie et Statistique, INSERM U1153, Paris,
France
2Centre d’Epidémiologie Clinique, Hôpital Hôtel-Dieu, Assistance Publique-Hôpitaux de Paris, Paris, France
Full list of author information is available at the end of the article
Background
Most patients assume that they are receiving evidence-based care made by well-informed medical practitioners. However, reporting bias within peer-reviewed literature makes that assumption difficult [1, 2]. Evidence of such reporting bias has been well documented [3–6], with many studies showing that trials with statistically significant results are more likely to be published and to be pub-lished more quickly than those with no statistical differ-ence [3, 6–8]. Such reporting bias may affect the results of systematic reviews and meta-analyses toward more positive results [9, 10] and lead to erroneous decision-making with serious consequences for patients [11, 12].
To limit reporting bias, the International Committee of Medical Journal Editors (ICMJE) released a statement in 2005 that made trial registration a condition for publi-cation [13–15]. A further step was achieved in 2007 with the US Food and Drug Administration Amendments Act (FDAAA 801) requiring phase 2–4 trials of FDA-approved drugs, devices, or biologics to post results on the federally funded registry ClinicalTrials.gov within 1 year of completion [16, 17]. According to the law, “a table of values for each of the primary and secondary outcome measures for each arm of the clinical trial, in-cluding the results of scientifically appropriate tests of the statistical significance of such outcome measures” should be posted [18]. However, it seems that many tri-als with results posted fail to report a an estimate of treatment effect orp-value.
In this study, we aimed to assess how many superiority clinical trials with results posted at ClinicalTrials.gov re-port statistically significant results and whether the pro-portion of significant results differed for trials with no treatment effect estimate orp-value posted.
Methods Data sources
On 2 June 2015, one of the authors (EGB) searched Clini-calTrials.gov for “Studies with Results” in the Study Re-sults field, then downloaded all records corresponding to these studies as excel and xml files. There was no limit on date. xml files were handled with R version R 3.2.3 (R Foundation for Statistical Computing, Vienna, Austria; https://www.R-project.org/) with the xml package.
Identification of completed phase 3 or 4 clinical trials with a superiority hypothesis
Trials reported as “phase 3” or “phase 4” in the phase field, as “randomized” in the study design field, and as “completed”in the recruitment field were considered for inclusion. Trials not reporting these elements were ex-cluded. We identified the number of arms reported in the study results and excluded single-arm trials as well as trials involving three or more arms so as to focus on
comparisons between an experimental intervention and a control. We excluded non-inferiority and equivalence trials, which were identified if the keywords “ non-infer-iority,” “non-inferior,” “equivalence,” “bioequivalence,” “bio-equivalence,” or “equivalent” were present in the following fields: study design, endpoint classification, or study results. We manually verified that each trial ex-cluded on the basis of these criteria met the definition of a non-inferiority trial (i.e., aiming to show that an experimental intervention is non-inferior to a control one) or equivalence trial (i.e., aiming to show that two interventions have therapeutic equivalence [19, 20]). We also excluded pharmacokinetic trials reported as a “bio-equivalence study” or“pharmacokinetics/dynamics study” in the endpoint classification field or based on information reported in the study results. We consid-ered all other trials as superiority trials (i.e., aiming to show a statistical difference between two interventions [20]) and included them. The selection process was done by one reviewer (EGB) and checked by a second reviewer (JS). Any discrepancies were resolved by a third reviewer (AD).
Extraction of data from ClinicalTrials.gov
The following characteristics were extracted from the re-cords downloaded from ClinicalTrials.gov:
1. General characteristics: we collected the phase of the trial (phase 3 or 4), type of intervention assessed (e.g., drug, biological, or device), type of control (i.e., placebo, no treatment, or active control), sponsor, and collaborators. We considered that there was an industry sponsorship if the sponsor or one of the collaborators was industry. We also extracted sample size and primary completion date (i.e., date of final collection for the primary outcome).
2. Location: we collected the countries where the trial was conducted and whether the trial was conducted in a single country and the number of centers involved.
3. Results posted: we collected the date when results were first received and whether the study was likely subject to the FDAAA. This characteristic is based on an algorithm developed by the US National Library of Medicine. Then, for the first primary outcome reported in the Results section, we
collected whether a treatment effect estimate and/or p-value was reported and, if yes, we extracted them.
Reporting of statistically significant results for the first primary outcome reported
For each trial with a treatment effect estimate and/or
were statistically significant or not. To do so, we relied on the p-value reported at ClinicalTrials.gov and con-sidered p-values <0.05 as statistically significant. Five percent has been the most commonly used threshold for statistical significance in clinical intervention re-search [21]. When only a measure of treatment effect with 95% confidence interval (CI) was reported, we de-rived thep-value from the 95% CI using the formula re-ported by Altman and Bland [22].
Calculation ofp-values for trials with no treatment effect estimate orp-value reported
For trials with no treatment effect estimate orp-value re-ported, we calculated whenever possible the treatment ef-fect estimate and correspondingp-value using the results per arm posted at ClinicalTrials.gov. This calculation was possible only for binary and continuous outcomes when sufficient data were reported at ClinicalTrials.gov. For binary outcomes, we calculated relative risk with 95% CI and the correspondingp-value from the number of events and number of participants analyzed reported per arm. For continuous outcomes, we calculated mean difference with 95% CI and the corresponding
p-value from the mean and standard deviation (SD) or standard error (SE), which we transformed to SD as well as the number of participants analyzed reported per arm.
Extraction of results per arm from ClinicalTrials.gov and calculation of treatment effect estimate with 95% CI and the correspondingp-value was systematically performed by two reviewers working independently (JS and CR) using Revman 5.3 (Copenhagen: The Nordic Cochrane Centre, The Cochrane Collaboration, 2014). Then, all results were compared and any disagreement was resolved by consensus with the help of a senior researcher (AD) if needed. We also considered ap-value <0.05 as statistically significant.
Calculation of treatment effect estimate and corre-spondingp-value was not possible for censored outcomes (e.g., progression-free survival), repeated measurements of the outcome over time (e.g., change in mean bone mineral density from baseline assessed at 12, 24, and 36 months), other situations for which there were several observa-tions or events per patient because these situaobserva-tions re-quired individual patient data, or when there was no event in both groups.
Statistical analysis
Categorical variables were described with frequencies (percentages) and quantitative variables with median (Q1-Q3). To assess the statistical significance of the results, we focused on p-values rather than on treat-ment effect estimates with 95% CI, and graphically represented the density plots of p-values for trials by whether a treatment effect estimate and/or p-value
was reported or not. For this, we considered p-values <0.0001 equal to 0.0001.
We aimed to identify trial characteristics associated with reporting a p-value <0.05 for the first primary outcome at ClinicalTrials.gov. To do, so, we first compared trial characteristics by whether results were reported to be statistically significant or not using chi-square tests for categorical variables and Wilcoxon tests for continuous variables. Then, we used a multivariate logistic regression model to iden-tify factors independently associated with the report-ing of statistically significant results. All variables that were statistically significant on univariate ana-lyses were entered into multivariate analysis except center, which was closely related to single-country status.
Statistical analysis involved use of SAS 9.3 (SAS Inst., Cary, NC, USA). The density plot was created with R 3.2.3 (R Foundation for Statistical Computing) using a syntax provided in a previous article [23].
Results
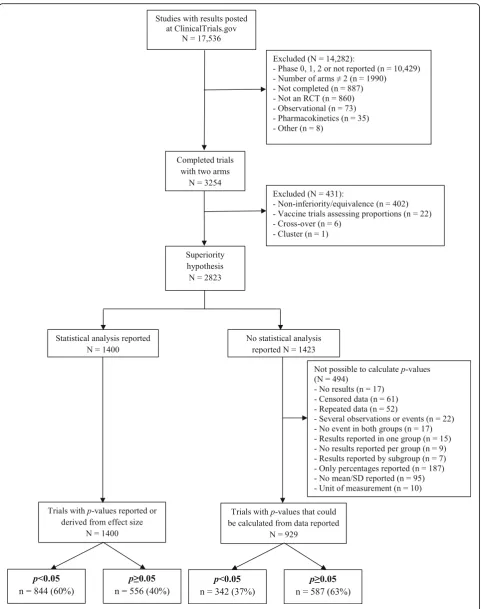
Identification of completed randomized trials with a superiority hypothesis
Figure 1 shows the selection process. From the 192,175 studies registered at ClinicalTrials.gov on 2 June 2015, 17,536 had results posted, with 9640 (55%) likely to be subject to the FDAAA. We identified 2823 completed phase 3 or 4 randomized trials with a superiority hypothesis.
Reporting of treatment effect estimate and/orp-value at ClinicalTrials.gov
Among the 2823 eligible trials, 1400 (50%) had a treat-ment effect estimate and/orp-value reported at Clinical-Trials.gov, and 1423 trials (50%) had only results per arm reported. Characteristics of trials by whether a treat-ment effect estimate and/orp-value was reported or not are reported in Table 1. Briefly, as compared with trials with no treatment effect estimate or p-value reported, those with a treatment effect estimate and/orp-value re-ported were more likely to be phase 3 trials (68% versus 51%), to have an inactive comparator (59% versus 36%), to have an industry sponsorship (83% versus 74%), to in-volve several countries (41% versus 21%) and several centers (66% versus 49%), to be subject to the FDAAA (68% versus 59%), and to have a larger median sample size (270 versus 156).
Reporting of statistically significant results for the first primary outcome
statistically significant for 844 trials (60%), with a median p-value of 0.01 (Q1-Q3: 0.001–0.26) (Fig. 2). For trials with no treatment effect estimate or p-value reported at ClinicalTrials.gov (N= 1423), we could calculate treatment effect estimate and the corre-sponding p-value for 929 (65%). From data posted at ClinicalTrials.gov, p-values could not be calculated for 494 trials (35%), mainly because of the reporting of percentages only for binary outcomes (n= 187), no reporting of mean (±SD) for continuous outcomes (n = 95), censored data (n= 61), and repeated measure-ments over time (n= 52). Characteristics did not dif-fer between trials for which we could calculate p -values and those with no treatment effect estimate or
p-value reported (Appendix). Among the 929 trials for which we could calculate p-values, results were
statistically significant for 342 (37%), with a median
p-value of 0.19 (Q1-Q3: 0.005–0.59) (Fig. 2).
Factors associated with reporting statistically significant results for the first primary outcome
Table 2 compares trial characteristics by whether statistically significant results were reported or not. Trials with signifi-cant results reported were more likely to be phase 3 trials (74% versus 53%,p< 0.0001), to have an inactive compara-tor (64% versus 40%,p< 0.0001), to have an industry spon-sorship (totally or partially) (88% versus 74%,p< 0.0001), to be subject to the FDAAA (70% versus 61%,p< 0.0001), and to have a larger sample size or to be a multicenter trial in-volving several countries than those reporting a p-value
≥0.05 or not reporting treatment effect estimate orp-value.
Table 1Characteristics of completed phase 3 or 4 randomized clinical trials with results posted and a superiority hypothesis by whether a treatment effect estimate and/orp-value is reported at ClinicalTrials.gov
Characteristics Categories Trials with treatment effect
estimate and/orp-value reported (N = 1400)
Trials with no treatment effect estimate orp-value reported (N = 1423)
Phase of the study Phase 3 948 (68) 728 (51)
Phase 4 452 (32) 695 (49)
Intervention type Drug 1088 (78) 1014 (71)
Mixed interventions 180 (13) 148 (10)
Biological 48 (3) 96 (7)
Device 40 (3) 97 (7)
Other 44 (3) 68 (5)
Control group Placebo or no treatment 822 (59) 516 (36)
Active treatment 578 (41) 907 (64)
Sponsorship Industry totally or partly 1162 (83) 1055 (74)
Academic only 238 (17) 368 (26)
Countries Single country 646 (46) 982 (69)
Multiple countries 568 (41) 292 (21)
Not reported 186 (13) 149 (10)
Location At least one site in the USA 846 (61) 822 (58)
No site in the USA 368 (26) 452 (32)
Not reported 186 (13) 149 (10)
Subject to the FDAAA Yes 951 (68) 843 (59)
No 377 (27) 556 (39)
Not reported 72 (5) 24 (2)
Centers Multicenter 929 (66) 696 (49)
Single center 285 (20) 578 (41)
Not reported 186 (13) 149 (10)
Sample size Median (Q1-Q3) 270 (116–520) 156 (60–378)
Time to results first received at ClinicalTrials.gov (month)
Median (Q1-Q3) 13.5 (11.7–26.4) 17.1 (12.0–32.3)
On adjusted multivariate analysis, reporting statisti-cally significant results at ClinicalTrials.gov for the first primary outcome was associated with being a phase 3 trial (odds ratio [OR] = 1.68, 95% CI 1.38–2.04), having an inactive comparator (OR = 2.19, 95% CI 1.83–2.61), having an industry sponsorship (OR = 1.57, 95% CI 1.22–2.03), and involving multiple countries (OR = 1.58, 95% CI 1.29–1.93) (Table 3).
Discussion
Nearly half of the studies with results posted at Clini-calTrials.gov are not required to do so as they do not seem to be subject to the FDAAA. Nevertheless, more attention should be paid to having more complete and transparent results posted. Only half of the com-pleted trials with results posted at ClinicalTrials.gov report a treatment effect estimate and/or p-value for the first primary outcome posted, with 60% of these trials reporting significant results. In contrast, the propor-tion of trials with significant results seemed much lower when no treatment effect estimate or p-value was re-ported. Factors independently associated with reporting statistically significant results at ClinicalTrials.gov were
being a phase 3 trial, using an inactive comparator, hav-ing industry sponsorship, and involvhav-ing multiple countries.
ClinicalTrials.gov is the most widely used clinical trial registry worldwide, with studies registered from 190 countries, and for now it is the only one allowing stan-dardized posting of results [17, 18]. Clinical.Trials.gov represents a crucial source of information on trial re-sults. Previous studies showed that it allows access to results not yet published and to more complete results than in corresponding published articles [24–26]. A re-cent study has compared results posted at Clinical-Trials.gov to corresponding FDA reports for new drug approval trials and found large concordance between both sources [27].
In this study, we found that results of many trials are posted although not required, because nearly half of the trials with results posted did not seem to be subject to the FDAAA according to the algorithm developed by the US National Library of Medicine. This is encouraging and highlights a willingness to give access to study re-sults for the sake of transparency and not only because it is compulsory.
Table 2Characteristics of completed phase 3 or 4 randomized clinical trials with a superiority hypothesis according to whether significant results (i.e.,p-value <0.05 or treatment effect with 95% CI not including the null value) were reported at ClinicalTrials.gov
Characteristics Categories Trials with significant
results reported (N= 844)
Trials with non statistically significant results or no treatment effect estimate orp-value reported
(N= 1979)
p-value
Phase of the study Phase 3 622 (74) 1054 (53) <0.0001
Phase 4 222 (26) 925 (47)
Intervention type Drug 675 (80) 1427 (72) <0.0001
Mixed interventions 97 (11) 231 (12)
Biological 29 (3) 115 (6)
Device 22 (3) 115 (6)
Other 21 (2) 91 (5)
Control group Placebo or no treatment 543 (64) 795 (40) <0.0001
Active treatment 301 (36) 1184 (60)
Sponsorship Industry totally or partly 744 (88) 1473 (74) <0.0001
Academic only 100 (12) 506 (26)
Countries Single country 361 (43) 1267 (64) <0.0001
Multiple countries 353 (42) 507 (26)
Not reported 130 (15) 205 (10)
Location At least one site in the USA 493 (59) 1175 (59) 0.003
No site in the USA 221 (26) 599 (30)
Not reported 130 (15) 205 (10)
Subject to the FDAAA Yes 588 (70) 1206 (61) <0.0001
No 201 (24) 732 (37)
Not reported 55 (6) 41 (2)
Centers Multicenter 581 (69) 1044 (53) <0.0001
Single center 133 (16) 730 (37)
Not reported 130 (15) 205 (10)
Sample size Median (Q1-Q3) 305 (139–541) 179 (62–405) <0.0001
Time to results first received at ClinicalTrials.gov (month)
Median (Q1-Q3) 13.0 (11.6–26.3) 16.5 (12.0–30.9) <0.0001
Data are presented as n (%) unless indicated.FDAAAUS Food and Drug Administration Amendments Act, Q1-Q3: Quartile 1-Quartile 3
Table 3Factors independently associated with reporting statistically significant results (i.e., reporting ap-value <0.05 or treatment effect with 95% CI not including the null value) for the first primary outcome posted at ClinicalTrials.gov for completed superiority clinical trials
Characteristics Adjusted OR (95% CI) p-value
Phase of the trial Phase 3 versus 4 1.68 (1.38–2.04) <0.0001
Intervention Drug versus other 1.20 (0.97–1.48) 0.10
Control group Inactive versus active 2.19 (1.83–2.61) <0.0001
Sponsorship Industry (totally or partially) versus academic 1.57 (1.22–2.03) 0.0005
FDAAA Subject versus not subject 1.15 (0.94–1.41) 0.17
Countries Multiple countries versus single country 1.58 (1.29–1.93) <0.0001
Not reported versus single country 1.50 (1.14–1.98) 0.004
Sample size For an increase of 100 patients 1.002 (0.99–1.005) 0.20
Several methodological studies have evaluated com-pliance with the FDAAA requiring posting of results for applicable trials [28–30] but few have looked at the nature of the results posted. Only one research note evaluated an association between changes in primary outcomes and reporting a significant result [31].
Our results show that, despite the FDAAA require-ment to post results from scientifically appropriate tests of statistical significance, only half of the trials with results posted reported ap-value and/or a meas-ure of treatment effect. For the other trials, we attempted to calculate treatment effect estimate and
p-values but this was not possible for 35% of trials, mainly because of insufficient reporting or because in-dividual patient data were required (i.e., for analysis of censored outcomes or repeated measurements over time). Therefore, for about one third of trials, system-atic reviewers may be unable to use the results re-ported at ClinicalTrials.gov when treatment effect estimates or p-values are not reported. Our results also suggest that the proportion of trials with signifi-cant results differs between trials reporting or not a treatment effect estimate and/orp-value. Although we could not calculate treatment effect and correspond-ing p-values for all trials not reporting these, our re-sults suggest a much lower proportion of trials with significant results when no treatment effect estimate or p-value is reported. These results may reflect a selective posting of treatment effect estimate and/or
p-value when results are statistically significant. This lack of transparency may have consequences when interpreting the results posted at ClinicalTrials.gov because physicians and decision-makers may be more likely to rely on trials with p-values already reported.
We identified some factors associated with reporting significant results at ClinicalTrials.gov. Reporting of sig-nificant results for the first primary outcome posted were more frequent for trials sponsored by industry than academic sources, which is consistent with previous studies finding that industry trials are more likely than public trials to report significant results in published ar-ticles [32, 33] and at ClinicalTrials.gov [31]. In addition, reporting of significant results was also more common for phase 3 trials and for trials with an inactive control. This finding is not surprising for trials with inactive control treatment because treatment effect estimates are expected to be higher in this situation than when the experimental intervention is compared to an active treatment.
This study has important implications. It highlights the importance of having complete results posted, including the posting of treatment effect estimate and/or p-value, to avoid any misinterpretation about
the benefits of interventions. Because of the poor compliance with these requirements, it becomes ne-cessary to improve their implementation. Systematic checking of results posted and automatic mailing to responsible parties may help improve the complete-ness of results posted. A recent article showed that sending emails to responsible parties of completed trials that do not comply with the FDAAA legal re-quirement to post results significantly improved the posting rate at 6 months [34]. In April 2014, the European Union voted to adopt the Clinical Trials Regulation, which requires the registration of all clinical trials conducted in Europe and the posting of trial summary results in the European Clinical trials Database (EudraCT) within 1 year after trial completion [35, 36]. This is a crucial step toward more transparency and this initiative should take advantage of the body of literature available for ClinicalTrials.gov and compli-ance with the FDAAA during the implementation process.
Our study has some limitations. We only looked at the first primary outcome with results posted, so our study is not representative of all results posted at Clini-calTrials.gov. For trials with no treatment effect estimate or p-value reported, we attempted to calculate the treatment effect and corresponding p-values from data reported per arm, adopting the viewpoint of sys-tematic reviewers. However, we could not do this for about one third of trials with no treatment effect esti-mate or p-value reported because of insufficient ele-ments reported or because the data were repeated measures or censored, situations for which individual participant data are necessary. Although there was no difference between trials for which we could calculate a
p-value and those with no treatment effect estimate and/orp-value, our results cannot be extrapolated to all trials with no treatment effect estimate or p-value re-ported. Finally, we focused on results reported at Clini-calTrials.gov and did not determine whether results had been published or not.
Conclusions
Appendix
Abbreviations
CI:confidence interval; FDA: Food and Drug Administration; FDAAA: Food and Drug Administration Amendments Act; ICMJE: International Committee of Medical Journal Editors; OR: Odds ratio; Q1: Quartile 1; Q3: Quartile 3; RCT: Randomized controlled trial; SD: Standard deviation; SE: Standard error
Acknowledgements
We thank Elise Diard (Centre de Recherche Epidémiologie et Statistique, Inserm U1153, French Cochrane Center) and Elodie Perrodeau, M.Sc. (Centre de Recherche Epidémiologie et Statistique, Inserm U1153, French Cochrane Center) for their help with the figure. ED and EP did not receive any compensation for their role in the study.
Funding
This study did not receive any external sources of funding.
Availability of data and materials
All data are available for academic researchers upon request.
Authors’contributions
AD and PR designed the study. EB downloaded data and managed xml files with the help of IA. EB and JS screened relevant studies. EB, JS, and CR extracted data. EB, JS, CR, and AD performed the statistical analysis. AD, EB, and PR interpreted the results. AD and EB wrote the article. All authors critically reviewed the manuscript. AD is the guarantor. All authors read and approved the final manuscript.
Competing interests
The authors declare that they have no competing interest.
Consent for publication
Not applicable. This is a research on research study.
Ethics approval and consent to participate Not applicable. This is a research on research study.
Author details
1Centre de Recherche Epidémiologie et Statistique, INSERM U1153, Paris,
France.2Centre d’Epidémiologie Clinique, Hôpital Hôtel-Dieu, Assistance Publique-Hôpitaux de Paris, Paris, France.3Faculté de Médecine, Université Paris Descartes, Sorbonne Paris Cité, Paris, France.4Cochrane France, Paris, France.5Department of Epidemiology, Mailman School of Public Health, Columbia University, New York, NY, USA.
Received: 13 September 2016 Accepted: 3 November 2016
References
1. Chalmers I, Glasziou P. Avoidable waste in the production and reporting of research evidence. Lancet. 2009;374(9683):86–9.
2. Chan AW, Song F, Vickers A, Jefferson T, Dickersin K, Gotzsche PC, et al. Increasing value and reducing waste: addressing inaccessible research. Lancet. 2014;383(9913):257–66.
Table 4Characteristics of trials with no treatment effect estimate orp-value reported at ClinicalTrials.gov and those for which p-values could be calculated
Characteristics Categories Trials with no treatment effect
estimate orp-value reported (N= 1423)
Trials with no treatment effect estimate orp-value reported for whichp-values could be calculated
(N= 929)
Phase of the study Phase 3
Phase 4
728 (51) 695 (49)
440 (47) 489 (53)
Intervention type Drug
Mixed interventions Biological Device Other 1014 (71) 148 (10) 96 (7) 97 (7) 68 (5) 676 (73) 92 (10) 55 (6) 57 (6) 49 (5)
Control group Placebo or no treatment Active treatment
516 (36) 907 (64)
347 (37) 582 (63)
Sponsorship Industry totally or partly Academic only
1055 (74) 368 (26)
674 (73) 255 (27)
Countries Single country
Multiple countries Not reported 982 (69) 292 (21) 149 (10) 672 (72) 163 (18) 94 (10)
Location At least one site in the USA
No site in the USA Not reported 822 (58) 452 (32) 149 (10) 529 (57) 306 (33) 94 (10)
Subject to the FDAAA Yes
No Not reported 843 (59) 556 (39) 24 (2) 521 (56) 390 (42) 18 (2) Centers Multicenter Single center Not reported 696 (49) 578 (41) 149 (10) 437 (47) 398 (43) 94 (10)
Sample size Median (Q1-Q3) 156 (60–378) 146 (60–372)
Time to results first received at ClinicalTrials.gov (month)
Median Q1-Q3) 17.1 (12.0–32.3) 17.8 (12.1–32.9)
3. Hopewell S, Loudon K, Clarke MJ, Oxman AD, Dickersin K. Publication bias in clinical trials due to statistical significance or direction of trial results. Cochrane Database Syst Rev. 2009;1:MR000006.
4. Ioannidis JP. Effect of the statistical significance of results on the time to completion and publication of randomized efficacy trials. JAMA. 1998;279(4):281–6.
5. Scherer RW, Langenberg P, von Elm E. Full publication of results initially presented in abstracts. Cochrane Database Syst Rev. 2007;2:MR000005. 6. Dwan K, Gamble C, Williamson PR, Kirkham JJ. Systematic review of the
empirical evidence of study publication bias and outcome reporting bias - an updated review. PLoS One. 2013;8(7):e66844.
7. Dickersin K, Min YI. Publication bias: the problem that won’t go away. Ann N Y Acad Sci. 1993;703:135–46. discussion 146–138.
8. Turner EH, Matthews AM, Linardatos E, Tell RA, Rosenthal R. Selective publication of antidepressant trials and its influence on apparent efficacy. N Engl J Med. 2008;358(3):252–60.
9. Gilbody SM, Song F, Eastwood AJ, Sutton A. The causes, consequences and detection of publication bias in psychiatry. Acta Psychiatr Scand. 2000;102(4):241–9.
10. Dickersin K. The existence of publication bias and risk factors for its occurrence. JAMA. 1990;263(10):1385–9.
11. Antes G, Chalmers I. Under-reporting of clinical trials is unethical. Lancet. 2003;361(9362):978–9.
12. Chalmers I. Underreporting research is scientific misconduct. JAMA. 1990;263(10):1405–8.
13. De Angelis CD, Drazen JM, Frizelle FA, Haug C, Hoey J, Horton R, et al. Is this clinical trial fully registered?—A statement from the International Committee of Medical Journal Editors. N Engl J Med. 2005;352(23):2436–8. 14. DeAngelis CD, Drazen JM, Frizelle FA, Haug C, Hoey J, Horton R, et al.
Clinical trial registration: a statement from the International Committee of Medical Journal Editors. JAMA. 2004;292(11):1363–4.
15. Deangelis CD, Drazen JM, Frizelle FA, Haug C, Hoey J, Horton R, et al. Is this clinical trial fully registered? A statement from the International Committee of Medical Journal Editors. JAMA. 2005;293(23):2927–9.
16. Zarin DA, Tse T. Medicine. Moving towards transparency of clinical trials. Science. 2008;319(5868):1340–2.
17. Tse T, Williams RJ, Zarin DA. Reporting“basic results”in ClinicalTrials.gov. Chest. 2009;136(1):295–303.
18. Food and Drug Administration Amendments Act of 2007 (2007). US Public Law 110–85. Washington (District of Columbia): Food and Drug Administration.
19. Jones B, Jarvis P, Lewis JA, Ebbutt AF. Trials to assess equivalence: the importance of rigorous methods. BMJ. 1996;313(7048):36–9.
20. Ware JH, Antman EM. Equivalence trials. N Engl J Med. 1997;337(16):1159–61. 21. Jakobsen JC, Gluud C, Winkel P, Lange T, Wetterslev J. The thresholds for
statistical and clinical significance - a five-step procedure for evaluation of intervention effects in randomised clinical trials. BMC Med Res Methodol. 2014;14:34.
22. Altman DG, Bland JM. How to obtain the P value from a confidence interval. BMJ. 2011;343:d2304.
23. Open Science Collaboration. PSYCHOLOGY. Estimating the reproducibility of psychological science. Science. 2015;349(6251):aac4716.
24. Hartung DM, Zarin DA, Guise JM, McDonagh M, Paynter R, Helfand M. Reporting discrepancies between the ClinicalTrials.gov results database and peer-reviewed publications. Ann Intern Med. 2014;160(7):477–83. 25. Riveros C, Dechartres A, Perrodeau E, Haneef R, Boutron I, Ravaud P. Timing
and completeness of trial results posted at ClinicalTrials.gov and published in journals. PLoS Med. 2013;10(12):e1001566. discussion e1001566. 26. Tang E, Ravaud P, Riveros C, Perrodeau E, Dechartres A. Comparison of
serious adverse events posted at ClinicalTrials.gov and published in corresponding journal articles. BMC Med. 2015;13:189.
27. Schwartz LM, Woloshin S, Zheng E, Tse T, Zarin DA. ClinicalTrials.gov and Drugs@FDA: a comparison of results reporting for new drug approval trials. Ann Intern Med. 2016;165(6):421–30.
28. Anderson ML, Chiswell K, Peterson ED, Tasneem A, Topping J, Califf RM. Compliance with results reporting at ClinicalTrials.gov. N Engl J Med. 2015;372(11):1031–9.
29. Nguyen TA, Dechartres A, Belgherbi S, Ravaud P. Public availability of results of trials assessing cancer drugs in the United States. J Clin Oncol. 2013; 31(24):2998–3003.
30. Prayle AP, Hurley MN, Smyth AR. Compliance with mandatory reporting of clinical trial results on ClinicalTrials.gov: cross sectional study. BMJ. 2012;344:d7373.
31. Ramagopalan SV, Skingsley AP, Handunnetthi L, Magnus D, Klingel M, Pakpoor J, et al. Funding source and primary outcome changes in clinical trials registered on ClinicalTrials.gov are associated with the reporting of a statistically significant primary outcome: a cross-sectional study. F1000Res. 2015;4:80.
32. Lundh A, Sismondo S, Lexchin J, Busuioc OA, Bero L. Industry sponsorship and research outcome. Cochrane Database Syst Rev. 2012;12:MR000033. 33. Djulbegovic B, Lacevic M, Cantor A, Fields KK, Bennett CL, Adams JR, et al.
The uncertainty principle and industry-sponsored research. Lancet. 2000; 356(9230):635–8.
34. Maruani A, Boutron I, Baron G, Ravaud P. Impact of sending email reminders of the legal requirement for posting results on ClinicalTrials.gov: cohort embedded pragmatic randomized controlled trial. BMJ. 2014;349:g5579. 35. Posting of clinical trial summary results in European Clinical Trials Database
(EudraCT) to become mandatory for sponsors as of 21 July 2014. [http:// www.ema.europa.eu/ema/index.jsp?curl=pages/news_and_events/news/ 2014/06/news_detail_002127.jsp]. Accessed Nov 2016
36. Europe votes for clinical trial transparency. http://www.alltrials.net/news/ europe-votes-for-clinical-trial-transparency. Accessed Nov 2016.
• We accept pre-submission inquiries
• Our selector tool helps you to find the most relevant journal
• We provide round the clock customer support
• Convenient online submission
• Thorough peer review
• Inclusion in PubMed and all major indexing services
• Maximum visibility for your research
Submit your manuscript at www.biomedcentral.com/submit