R E S E A R C H A R T I C L E
Open Access
Maternal antenatal multiple micronutrient
supplementation for long-term health
benefits in children: a systematic review
and meta-analysis
Delan Devakumar
1*, Caroline H. D. Fall
2, Harshpal Singh Sachdev
3, Barrie M. Margetts
4, Clive Osmond
2,
Jonathan C. K. Wells
5, Anthony Costello
1and David Osrin
1Abstract
Background:Multiple micronutrient supplementation for pregnant women reduces low birth weight and has been recommended in low- and middle-income countries (LMICs) to improve child survival, growth and health. We aimed to review the evidence from long-term follow-up studies of multiple micronutrient supplementation beginning in the later first or second trimester.
Methods:We searched systematically for follow-up reports from all trials in a 2015 Cochrane review of multiple micronutrient supplementation in pregnancy. The intervention comprised three or more micronutrients and the comparison group received iron (60 mg) and folic acid (400μg), where possible. Median gestation of commencement varied from 9 to 23 weeks. Primary outcomes were offspring mortality, height, weight and head circumference, presented as unadjusted differences in means or proportions (intervention minus control). Secondary outcomes included other anthropometry, body composition, blood pressure, and cognitive and lung function.
Results:We found 20 follow-up reports from nine trials (including 88,057 women recruited), six of which used the UNIMMAP supplement designed to provide recommended daily allowances. The age of follow-up ranged from 0 to 9 years. Data for mortality estimates were available from all trials. Meta-analysis showed no difference in mortality (risk difference–0.05 per 1000 livebirths; 95 % CI,–5.25 to 5.15). Six trials investigated anthropometry and found no difference at follow-up in weight-for-agezscore (0.02; 95 % CI,–0.03 to 0.07), height-for-agezscore (0.01; 95 % CI,–0.04 to 0.06), or head circumference (0.11 cm; 95 % CI,–0.03 to 0.26). No differences were seen in body composition, blood pressure, or respiratory outcomes. No consistent differences were seen in cognitive function scores. Conclusions:There is currently no evidence that, compared with iron and folic acid supplementation, routine maternal antenatal multiple micronutrient supplementation improves childhood survival, growth, body composition, blood pressure, respiratory or cognitive outcomes.
Keywords:Child, Micronutrients, Prenatal exposure delayed effects
* Correspondence:d.devakumar@ucl.ac.uk
1Institute for Global Health, University College London, 30 Guilford St, London, UK
Full list of author information is available at the end of the article
© 2016 The Author(s).Open AccessThis article is distributed under the terms of the Creative Commons Attribution 4.0 International License (http://creativecommons.org/licenses/by/4.0/), which permits unrestricted use, distribution, and reproduction in any medium, provided you give appropriate credit to the original author(s) and the source, provide a link to the Creative Commons license, and indicate if changes were made. The Creative Commons Public Domain Dedication waiver (http://creativecommons.org/publicdomain/zero/1.0/) applies to the data made available in this article, unless otherwise stated. Devakumaret al. BMC Medicine (2016) 14:90
Background
Micronutrient deficiency is believed to affect approximately two billion people worldwide, with pregnant women being at particular risk because of their high metabolic demands [1]. The World Health Organization (WHO) considers micronutrient deficiency to be of particular concern in low-income countries, where women’s diets are likely to be deficient in both quantity and quality. The im-portance of micronutrients is becoming increasingly apparent, especially in resource-poor settings in which women may enter pregnancy with multiple micronu-trient (MMN) deficiencies [2–4]. For example, 38 % of pregnant women have iron deficiency leading to anaemia [5] and 15 % have vitamin A deficiency causing night blind-ness and increasing the risk of infection [6, 7]. Impaired antenatal nutrition can affect fetal development and growth in the short term, subsequent growth and cognitive devel-opment in the medium term, and risk of chronic disease in the longer term [3]. There is good evidence that folic acid in pregnancy reduces neural tube defects and the mortality arising from them [8, 9]. While the evidence base is not substantial for iron and folic acid, a Cochrane review de-scribed a mean increase in birthweight of 57.7 g (95 % CI, 7.7–107.8 g) [10].
While there is evidence that MMN supplementation reduces the prevalence of small for gestational age (SGA) births [11], the primary rationale for recent recommenda-tions to implement routine MMN supplementation for pregnant women in developing countries is that such birth weight increments will lead to reductions in childhood stunting and mortality [12, 13]. In addition to the immedi-ate effects on health, growth in early childhood is important because of its association with adult health and human cap-ital [14]. The hypothesis of the developmental origins of health and disease proposes critical or sensitive periods in early development in which environmental influences can have lasting effects on growth and physiology [15]. In humans, these critical periods are thought to occur pre-dominantly in prenatal life and extend into early childhood. Suggested mechanisms include an interplay between envir-onment (including maternal nutritional status), genes, and hormones, in which epigenetic regulation plays a part [3, 15, 16]. Evidence for the hypothesis comes mainly from observational studies showing associations between low birthweight and adverse adult health outcomes [17], from historical events such as the Dutch Hunger Winter [18], and from animal studies [19]. Long-term follow-up of chil-dren born during trials of maternal MMN supplementation offer a potentially stronger test of the hypothesis. If MMN supplements are to be recommended for pregnant women, it is important to know whether they lead to the sustained improvements in child health predicted by an increase in birthweight. In this review, we searched for reports that followed up the trials included in the 2015 Cochrane review
[20], focusing on childhood mortality and health-related outcomes (growth, body composition, cardio-metabolic risk markers, cognition, lung function). We hypothesized that, compared with iron and folic acid, antenatal MMN supple-mentation would lead to longer-term improvements in health and survival.
Methods
Eligibility criteria
Types of report
We attempted to find all reports of follow-up of children born in the individual or cluster randomized controlled trials included in the 2015 Cochrane review. The review included 17 trials and excluded 97. The main reasons for exclusion were not meeting intervention and comparison group criteria, not assessing supplementation in a healthy population, and providing supplementation within food fortification initiatives [20].
Participants
Participants were children born in the trials in the 2015 Cochrane review [20] who had been subsequently followed up.
Intervention and comparison groups
The intervention group included women who had re-ceived multiple micronutrient supplements, defined as “containing three or more micronutrients” in pregnancy [20]. All intervention groups received iron and folic acid. For consistency, the comparison group chosen a priori was iron 60 mg and folic acid 400μg, where possible, as this regimen is generally recommended for pregnant women [21]. We planned to consider all trials together, with the possibility of subgroup examination when supplementation regimens differed. Trials with co-interventions (for example, food supplements) were eligible provided that the co-intervention was similar in both allocation arms. If a second randomization was conducted after birth, we did not include arms that received MMN supplements in the comparison group.
Outcome measures
The primary outcomes were mortality (difference per 1000 livebirths), height and weight (as continuous WHO z scores, adjusted for age and sex), and head circumfer-ence (continuous differcircumfer-ence), presented as unadjusted differences (intervention minus control). At a population level, risk differences may be more interpretable than odds ratios because they give a clearer impression of the effects of an intervention in terms of potential policy. When not reported, we calculated mean differences with 95 % confidence intervals. Mortality difference was either as described in the trial paper or follow-up report, or cal-culated from available trial profiles. Secondary outcomes
included categorical proportions of stunting (<–2zscores height-for-age), underweight (< –2 z scores weight-for-age), wasting (< –2 z scores weight-for-height) and low body mass index (BMI) (< –2 z scores BMI-for-age), descriptions of body composition (lean and fat mass, skinfold thickness), blood pressure, cognitive tests, and lung function. Cognitive and motor development were as assessed by trialists, including use of indexes such as the Bayley Mental Development Index, Bayley Psychomotor Development Index, Stanford-Binet Test, DENVER II Developmental Screening Test and Wechsler Intelligence Scale for Children. Effect modification by maternal nutri-tional status and child sex was reported when available. Birth outcomes were not considered as they had been reported previously [11, 22].
Search strategy and study selection
We searched PubMed, Web of Science and the Global Health Library for articles that included trial lead author names, location, trial number, or the given trial name (Additional file 1: Text S1). We contacted trial authors when eligibility was unclear and used a snowballing approach, searching citation lists and ‘related articles’. Study titles and abstracts were screened for eligibility by DD and JCKW independently. Differences were resolved by discussion. Full papers were obtained for potentially eligible citations. The results were assessed for multiple publications and one study was excluded. We did not as-sess reports of maternal outcomes. No exclusions were applied for age, dates of coverage, or language.
Data extraction and analysis
Publications from each trial were examined by two re-view authors (unconnected with the trial) independently (AC, BM, CHDF, DD, DO, HSS, and JCKW), using a pre-tested data extraction form. Differences were resolved by discussion. We contacted trial authors for clarifications and consolidated multiple reports from the same trial using data from the later follow-up. We used anthropo-metriczscores adjusted for age and sex (WHO reference ranges). Meta-analyses were conducted if sufficient reports were available, using the DerSimonian and Laird model. When numbers of deaths were provided for a sub-group of participants in a second age interval, we com-bined the data to produce an estimate of the mortality rate across both intervals using standard life-table tech-niques, and generated 95 % confidence intervals through a simulation approach. Outcome measures were risk dif-ferences per 1000 livebirths (mortality), difdif-ferences in an-thropometry z scores (height-for-age (HAZ) and weight-for-age (WAZ)) and absolute values (head circumference and blood pressure). We assessed heterogeneity using the I2statistic. In view of anticipated contextual heterogeneity, we used a random effects model for all meta-analyses.
Missing data were reported under attrition bias, but no further analyses were conducted. For cluster-randomised trials, we used reported cluster-adjusted estimates, irre-spective of the method employed. If the analyses had not been adjusted for cluster design effect, we used a previously reported design effect from the trial paper to inflate the variance. Analysis was conducted in Stata, version 12 (StataCorp, College Station, TX, USA).
Risk of bias
Risk of bias for each study was assessed by two review authors (unconnected with the trial) independently (AC, BM, CHDF, DD, DO, HSS, and JCKW), using a ptested data extraction form. Differences were re-solved by discussion and trial authors were contacted for clarifications. We used the same categorisation of bias of individual trials as in the Cochrane review 2015. We re-ported on bias in follow-up reports in the following cat-egories: selection, attrition, reporting, performance and detection. We evaluated reporting bias by inspection of funnel plots for the primary outcomes of mortality, weight-for-age, height-for-age and head circumference.
Sub-group analysis
We performed sub-group analyses including trials that used UNIMMAP only and trials with different iron dos-age (~30 or 60 mg) in control groups. Sensitivity ana-lyses were not conducted.
Results
Description of trials with follow-up reports
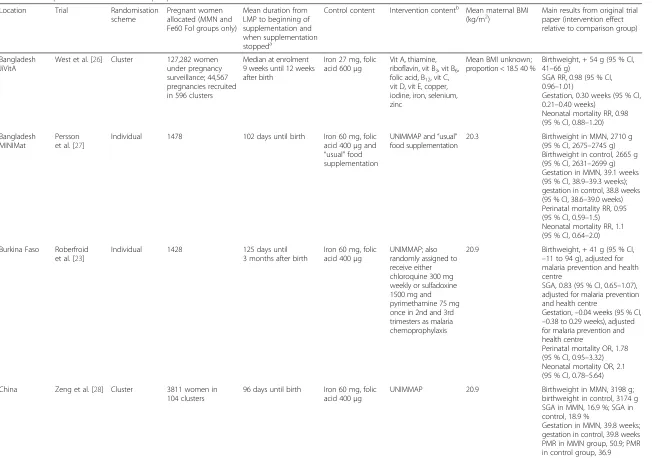
Follow-up reports were identified for nine of the trials in the Cochrane review. In total, 88,057 women were re-cruited. The trials were spread geographically: two in Af-rica [23, 24], one in the AmeAf-ricas [25], and six in Asia [26–31]. All sites were rural, with the exception of Nepal Janakpur (urban and rural) and Guinea (semi-urban). Mean ages of mothers were similar and ranged from 21.5 (Nepal Janakpur) to 25.6 years (Indonesia). Mean maternal BMI, measured at recruitment during pregnancy, ranged from 19.3 kg/m2 (Nepal Sarlahi) to 24.1 kg/m2 (Mexico). Trial characteristics, with results summarized in the way in which they were presented in the trial papers, are shown in Table 1 and have been previously described in detail [20, 32].
Six of the nine trials used the UNIMMAP supplement developed by UNICEF, the United Nations University, and WHO, and were designed to provide the recom-mended daily allowances. It contained vitamin A 800 μg, thiamine 1.4 mg, riboflavin 1.4 mg, niacin 18 mg, vitamin B6 1.9 mg, folic acid 400μg, vitamin B12 2.6μg, vitamin C 70 mg, vitamin D 5μg, vitamin E 10 mg, copper 2 mg, iodine 150 μg, iron 30 mg, selenium 65 μg, and zinc 15 mg [33]. The Bangladesh JiVitA trial used the same
Table 1Description of trials with follow-up reports
Location Trial Randomisation
scheme
Pregnant women allocated (MMN and Fe60 Fol groups only)
Mean duration from LMP to beginning of supplementation and when supplementation stoppeda
Control content Intervention contentb Mean maternal BMI
(kg/m2) Main results from original trialpaper (intervention effect
relative to comparison group)
Bangladesh JiVitA
West et al. [26] Cluster 127,282 women under pregnancy surveillance; 44,567 pregnancies recruited in 596 clusters
Median at enrolment 9 weeks until 12 weeks after birth
Iron 27 mg, folic acid 600μg
Vit A, thiamine, riboflavin, vit B3, vit B6,
folic acid, B12, vit C,
vit D, vit E, copper, iodine, iron, selenium, zinc
Mean BMI unknown; proportion < 18.5 40 %
Birthweight, + 54 g (95 % CI, 41–66 g)
SGA RR, 0.98 (95 % CI, 0.96–1.01)
Gestation, 0.30 weeks (95 % CI, 0.21–0.40 weeks)
Neonatal mortality RR, 0.98 (95 % CI, 0.88–1.20)
Bangladesh MINIMat
Persson et al. [27]
Individual 1478 102 days until birth Iron 60 mg, folic acid 400μg and
“usual”food supplementation
UNIMMAP and“usual” food supplementation
20.3 Birthweight in MMN, 2710 g
(95 % CI, 2675–2745 g) Birthweight in control, 2665 g (95 % CI, 2631–2699 g) Gestation in MMN, 39.1 weeks (95 % CI, 38.9–39.3 weeks); gestation in control, 38.8 weeks (95 % CI, 38.6–39.0 weeks) Perinatal mortality RR, 0.95 (95 % CI, 0.59–1.5) Neonatal mortality RR, 1.1 (95 % CI, 0.64–2.0)
Burkina Faso Roberfroid et al. [23]
Individual 1428 125 days until
3 months after birth
Iron 60 mg, folic acid 400μg
UNIMMAP; also randomly assigned to receive either chloroquine 300 mg weekly or sulfadoxine 1500 mg and pyrimethamine 75 mg once in 2nd and 3rd trimesters as malaria chemoprophylaxis
20.9 Birthweight, + 41 g (95 % CI,
–11 to 94 g), adjusted for malaria prevention and health centre
SGA, 0.83 (95 % CI, 0.65–1.07), adjusted for malaria prevention and health centre
Gestation,–0.04 weeks (95 % CI,
–0.38 to 0.29 weeks), adjusted for malaria prevention and health centre
Perinatal mortality OR, 1.78 (95 % CI, 0.95–3.32) Neonatal mortality OR, 2.1 (95 % CI, 0.78–5.64)
China Zeng et al. [28] Cluster 3811 women in 104 clusters
96 days until birth Iron 60 mg, folic acid 400μg
UNIMMAP 20.9 Birthweight in MMN, 3198 g;
birthweight in control, 3174 g SGA in MMN, 16.9 %; SGA in control, 18.9 %
Gestation in MMN, 39.8 weeks; gestation in control, 39.8 weeks PMR in MMN group, 50.9; PMR in control group, 36.9 NMR in MMN group, 12.4; NMR in control group, 10.7
Devakuma
r
et
al.
BMC
Medicine
(2016) 14:90
Page
4
of
Table 1Description of trials with follow-up reports(Continued)
Guinea Bissau Kaestel et al. [24]
Individual 1403 158 days until birth Iron 60 mg, folic acid 400μg
UNIMMAP; if haemoglobin concentration < 70 g/L, given additional iron 60 mg daily; all women received insecticide-treated bednets, weekly anti malarial prophylaxis and malaria treatment if needed
23.3 Birthweight, + 53.0 g (95 % CI,
–19 to 125 g)
Perinatal mortality OR, 0.82 (95 % CI, 0.53–1.26) Neonatal mortality OR, 1.18 (95 % CI, 0.66–2.11)
Indonesia Shankar et al. [29]
Cluster 31,290 women, 262 randomly assigned midwives
146 days until 90 days after birth
Iron 30 mg, folic acid 400μg
UNIMMAP Not recorded Birthweight, + 21 g (95 % CI,
–11 to 53 g)
Perinatal mortality RR, 0.90 (95 % CI, 0.79–1.03) Neonatal mortality RR, 0.90 (95 % CI, 0.76–1.06)
Mexico Ramakrishnan
et al. [25]
Individual 873 children born in the trial were subsequently randomised to receive postnatal multiple micronutrients or iron and vitamin A supplements
69 days until birth Iron 60 mg; no supplements on Sundays
Vit A, thiamine, riboflavin, niacin, vit B6,
folic acid, vit B12, vit C,
vit D3, vit E, iron, magnesium, zinc; no supplements taken on Sundays
24.1 Birthweight in MMN, 2981 g;
birthweight in control, 2977 g SGA in MMN, 10.1 %; SGA in control, 11.8 % Gestation in MMN, 39.5 weeks; gestation in control, 39.6 weeks
Nepal Janakpur Osrin et al. [30] Individual 1200 112 days until birth Iron 60 mg, folic acid 400μg
UNIMMAP; if haemoglobin concentration < 70 g/L, given extra iron 60 mg daily and anthelminthic treatment; if symptoms of night-blindness, vitamin A 2000μg
19.9 Birthweight, + 77 g (95 % CI, 24–130 g)
Gestation, 0.2 weeks (95 % CI,
–0.1 to 0.4 weeks) PMR in MMN, 49.0; PMR in control, 40.5
NMR in MMN, 30.6; NMR in control, 20.0
Nepal Sarlahi Christian et al. [34] Christian et al. [31]
Cluster 14,036 women under pregnancy
surveillance; 2007 pregnancies recruited in 169 clusters
80 days until 12 weeks after birth
Iron 60 mg, folic acid 400μg, Vit A 1000μg
Vit A, thiamine, riboflavin, vit B3, vit B6,
folic acid, vit B12, vit C,
vit D, vit E, vit K, copper, iron as ferrous fumerate, magnesium and zinc; albendazole was offered in 2nd and 3rd trimesters
19.3 Birthweight in MMN, 2659 g;
birthweight in control, 2652 g SGA in MMN, 53.8 %; SGA in control, 51.7 %
PMR in MMN group, 87.1; PMR in control group, 62.4 NMR in MMN group, 54.0; NMR in control group, 36.3
a
Data from Margetts et al. [32] b
See Additional file1: Table S1 for supplement constituents
BMIbody mass index,Fe60 Foliron 60 mg and folic acid supplement,LMPlast menstrual period,MMNmultiple micronutrient supplement,NMRneonatal mortality per 1000 livebirths,PMRperinatal mortality per 1000 livebirths,RRrelative risk,SGAsmall for gestational age,UNIMMAPUnited Nations International Multiple Micronutrient Preparation
Devakuma
r
et
al.
BMC
Medicine
(2016) 14:90
Page
5
of
micronutrients as UNIMMAP in similar doses. The sup-plement used in Nepal Sarlahi contained micronutrients in similar doses (with 60 mg iron), plus magnesium and vitamin K, but no selenium or iodine [34]. The supplement used in Mexico included iron 62.4 mg and magnesium 252 mg, and did not include copper, iodine or selenium [25]. In some cases, a comparison group of iron 60 mg and folic acid 400 μg was not available: Nepal Sarlahi included additional vitamin A [34], Mexico did not include folic acid [25], Indonesia used 30 mg iron [29], and Bangladesh JiVitA used 27 mg iron and 600μg folate [26]. Supplement constituents are shown in Additional file 1: Table S1. Supplementation was initiated in early to mid-pregnancy, with a range of median commencement gesta-tion across studies of 14 weeks (Table 1).
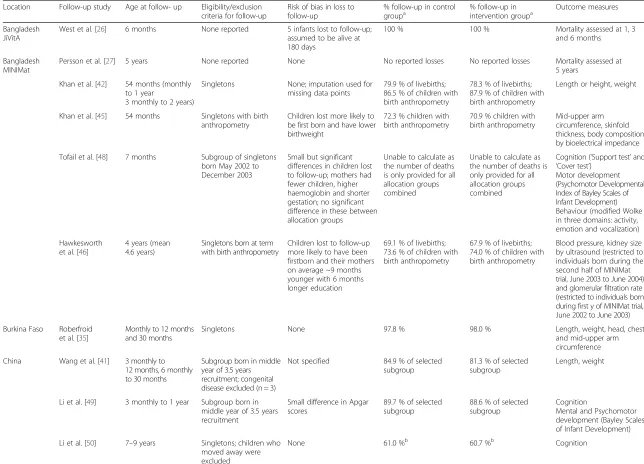
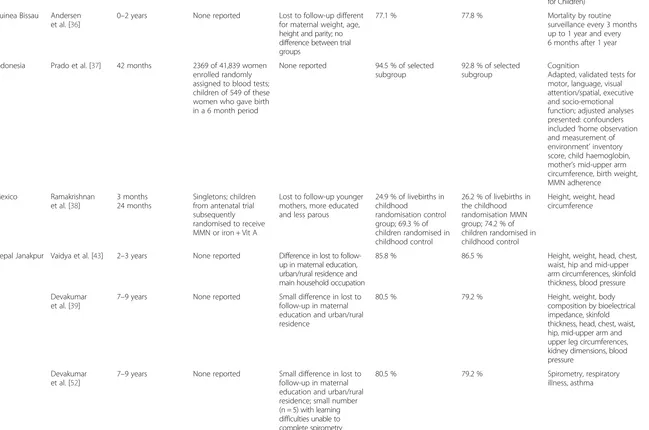
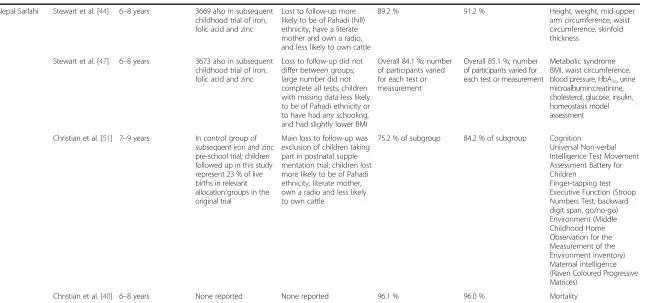
Follow-up reports
We found 20 follow-up reports (Table 2 and Additional file 1: Figure S1). We divided the findings into five gen-eral categories: mortality [26, 27, 35–41], anthropometry [35, 38, 39, 41–44] and body composition [39, 44, 45], cardiovascular [39, 43, 46, 47], cognitive [37, 48–51], and respiratory [52]. Primary publications from the Bangladesh JiVitA and MINIMat trials included follow-up mortality data and were included in the list of follow-up reports. Meta-analyses were conducted for mortality, weight, height, head circumference and blood pressure outcomes.
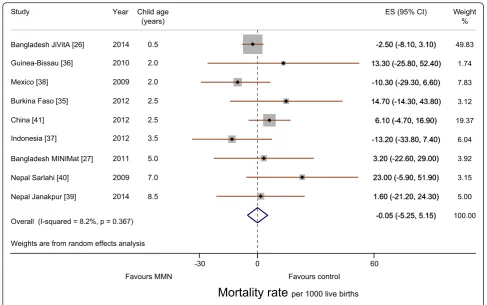
Mortality
Follow-up reports from all trials systematically recorded and reported infant/child mortality as an outcome (Table 3). Meta-analysis showed no difference between intervention and control groups (risk difference, –0.05 per 1000 live-births; 95 % CI,–5.25 to 5.15; I2, 8 %; Fig. 1). No difference by age was seen. Subgroup analysis including trials that used only the UNIMMAP supplement showed a risk differ-ence of 3.41 per 1000 livebirths (95 % CI,–4.45 to 11.26; I2, 0 %; Additional file 1: Figure S2). Subgroup analysis for trials that used 60 mg iron in control groups yielded a risk difference of 4.51 per 1000 livebirths (95 % CI,–2.91 to 11.94; I2, 0 %), and trials that used approximately 30 mg iron in the control group yielded a risk difference of 0.41 per 1000 livebirths (95 % CI, –14.76 to 15.57; I2, 62 %; Additional file 1: Figure S3).
Anthropometry
Seven reports described anthropometry (Table 4). No differences were seen in any report at the most recent follow-up for WAZ, HAZ or head circumference, nor in any secondary anthropometric outcomes. Differences were seen at younger ages in two trials. In the Burkina Faso trial, greater mean WAZ (β, 0.13; 95 % CI, 0.04 to 0.23) and length-for-agezscore (β, 0.13; 95 % CI, 0.02 to 0.24)
were seen in the multiple micronutrient supplement group, and a lower proportion were stunted at 1 year (haz-ard ratio, 0.73; 95 % CI, 0.60 to 0.87), but there was no dif-ference at 2.5 years of age [35]. In the Nepal Janakpur trial, greater mean WAZ (β, 0.14; 95 % CI, 0.00 to 0.27) was seen in the multiple micronutrient supplement group at a mean of 2.5 years, but there was no difference at 8.5 years (β, 0.05; 95 % CI,–0.09 to 0.19). Small increases were seen in head, chest, hip, and mid-upper arm circumferences at 2.5 years, but were also not present at 8.5 years [39, 43].
Effect modification by maternal BMI or child sex was not found in any report with the exception of the Bangladesh MINIMat trial, in which stunting was greater in boys in the MMN group (Males, 7.8 %; 95 % CI, 2.0 to 13.6; Females, 1.8 %; 95 % CI,–3.8 to 7.3). A test for interaction was not reported.
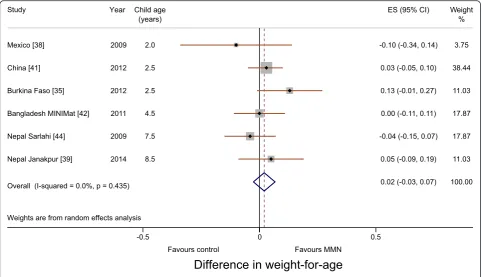
Meta-analyses for WAZ and HAZ showed no differ-ence between multiple micronutrient and 60 mg iron and folic acid groups. The differences in WAZ and HAZ were 0.02 (95 % CI, –0.03 to 0.07; I2, 0 %; Fig. 2) and 0.01 (95 % CI,–0.04 to 0.06; I2, 0 %; Fig. 3), respectively. Meta-analysis for head circumference was possible for three trials (Mexico, Bangladesh MINIMat and Nepal Janakpur) and showed no difference (0.11 cm; 95 % CI,–0.03 to 0.26; I2, 0 %; Fig. 4). Subgroup analysis including UNIMMAP trials made little difference: WAZ 0.04 (95 % CI,–0.01 to 0.09; I2, 0 %), HAZ 0.01 (95 % CI, –0.05 to 0.06; I2, 0 %), and head circumference 0.11 cm (95 % CI, –0.05 to 0.26; I2, 10 %; Additional file 1: Figure S2).
Body composition
The Bangladesh MINIMat trial found no difference in biceps, triceps, subscapular or suprailiac skinfold thick-nesses. The Nepal Janakpur trial found an increase in triceps skinfold thickness at 2.5 years (0.20 mm; 95 % CI, 0.00 to 0.40 mm) [43], but no difference was found in any skinfold thickness at 8.5 years [39]. The Nepal Sarlahi trial found no difference in triceps or subscapular skinfold thickness at 7.5 years of age. Neither the Bangladesh MINIMat nor the Nepal Janakpur trial found a difference in lean mass or fat mass measured using bio-impedance [39, 45, 53, 54].
Cardiovascular risk markers
Cardiovascular outcomes were only examined in trials from South Asia (Table 4). The Bangladesh MINIMat and Nepal Janakpur trials measured blood pressure, while the Nepal Sarlahi trial investigated metabolic syndrome (blood pressure, HbA1c, urine microalbumin:creatinine, choles-terol, glucose, insulin, homeostasis model assessment of insulin resistance). The Nepal Janakpur cohort showed a reduction in mean systolic blood pressure of 2.5 mmHg (95 % CI, 0.47 to 4.55) at 2.5 years of age, but no difference
Table 2Description of follow-up reports
Location Follow-up study Age at follow- up Eligibility/exclusion criteria for follow-up
Risk of bias in loss to follow-up
% follow-up in control groupa
% follow-up in intervention groupa
Outcome measures
Bangladesh JiVitA
West et al. [26] 6 months None reported 5 infants lost to follow-up; assumed to be alive at 180 days
100 % 100 % Mortality assessed at 1, 3
and 6 months
Bangladesh MINIMat
Persson et al. [27] 5 years None reported None No reported losses No reported losses Mortality assessed at
5 years
Khan et al. [42] 54 months (monthly to 1 year
3 monthly to 2 years)
Singletons None; imputation used for missing data points
79.9 % of livebirths; 86.5 % of children with birth anthropometry
78.3 % of livebirths; 87.9 % of children with birth anthropometry
Length or height, weight
Khan et al. [45] 54 months Singletons with birth anthropometry
Children lost more likely to be first born and have lower birthweight
72.3 % children with birth anthropometry
70.9 % children with birth anthropometry
Mid-upper arm circumference, skinfold thickness, body composition by bioelectrical impedance
Tofail et al. [48] 7 months Subgroup of singletons born May 2002 to December 2003
Small but significant differences in children lost to follow-up; mothers had fewer children, higher haemoglobin and shorter gestation; no significant difference in these between allocation groups
Unable to calculate as the number of deaths is only provided for all allocation groups combined
Unable to calculate as the number of deaths is only provided for all allocation groups combined
Cognition (‘Support test’and
‘Cover test’) Motor development (Psychomotor Developmental Index of Bayley Scales of Infant Development) Behaviour (modified Wolke in three domains: activity, emotion and vocalization)
Hawkesworth et al. [46]
4 years (mean 4.6 years)
Singletons born at term with birth anthropometry
Children lost to follow-up more likely to have been firstborn and their mothers on average ~9 months younger with 6 months longer education
69.1 % of livebirths; 73.6 % of children with birth anthropometry
67.9 % of livebirths; 74.0 % of children with birth anthropometry
Blood pressure, kidney size by ultrasound (restricted to individuals born during the second half of MINIMat trial, June 2003 to June 2004), and glomerular filtration rate (restricted to individuals born during first y of MINIMat trial, June 2002 to June 2003)
Burkina Faso Roberfroid et al. [35]
Monthly to 12 months and 30 months
Singletons None 97.8 % 98.0 % Length, weight, head, chest
and mid-upper arm circumference
China Wang et al. [41] 3 monthly to 12 months, 6 monthly to 30 months
Subgroup born in middle year of 3.5 years recruitment; congenital disease excluded (n = 3)
Not specified 84.9 % of selected subgroup
81.3 % of selected subgroup
Length, weight
Li et al. [49] 3 monthly to 1 year Subgroup born in middle year of 3.5 years recruitment
Small difference in Apgar scores
89.7 % of selected subgroup
88.6 % of selected subgroup
Cognition
Mental and Psychomotor development (Bayley Scales of Infant Development)
Li et al. [50] 7–9 years Singletons; children who moved away were excluded
None 61.0 %b 60.7 %b Cognition
Devakuma
r
et
al.
BMC
Medicine
(2016) 14:90
Page
7
of
Table 2Description of follow-up reports(Continued)
Mental development (Wechsler Intelligence Scale for Children)
Guinea Bissau Andersen et al. [36]
0–2 years None reported Lost to follow-up different for maternal weight, age, height and parity; no difference between trial groups
77.1 % 77.8 % Mortality by routine
surveillance every 3 months up to 1 year and every 6 months after 1 year
Indonesia Prado et al. [37] 42 months 2369 of 41,839 women enrolled randomly assigned to blood tests; children of 549 of these women who gave birth in a 6 month period
None reported 94.5 % of selected subgroup
92.8 % of selected subgroup
Cognition
Adapted, validated tests for motor, language, visual attention/spatial, executive and socio-emotional function; adjusted analyses presented: confounders included‘home observation and measurement of environment’inventory score, child haemoglobin, mother’s mid-upper arm circumference, birth weight, MMN adherence
Mexico Ramakrishnan
et al. [38]
3 months 24 months
Singletons; children from antenatal trial subsequently randomised to receive MMN or iron + Vit A
Lost to follow-up younger mothers, more educated and less parous
24.9 % of livebirths in childhood
randomisation control group; 69.3 % of children randomised in childhood control
26.2 % of livebirths in the childhood randomisation MMN group; 74.2 % of children randomised in childhood control
Height, weight, head circumference
Nepal Janakpur Vaidya et al. [43] 2–3 years None reported Difference in lost to follow-up in maternal education, urban/rural residence and main household occupation
85.8 % 86.5 % Height, weight, head, chest,
waist, hip and mid-upper arm circumferences, skinfold thickness, blood pressure
Devakumar et al. [39]
7–9 years None reported Small difference in lost to follow-up in maternal education and urban/rural residence
80.5 % 79.2 % Height, weight, body
composition by bioelectrical impedance, skinfold thickness, head, chest, waist, hip, mid-upper arm and upper leg circumferences, kidney dimensions, blood pressure
Devakumar et al. [52]
7–9 years None reported Small difference in lost to follow-up in maternal education and urban/rural residence; small number (n = 5) with learning difficulties unable to complete spirometry
80.5 % 79.2 % Spirometry, respiratory
illness, asthma
Devakuma
r
et
al.
BMC
Medicine
(2016) 14:90
Page
8
of
Table 2Description of follow-up reports(Continued)
Nepal Sarlahi Stewart et al. [44] 6–8 years 3669 also in subsequent childhood trial of iron, folic acid and zinc
Lost to follow-up more likely to be of Pahadi (hill) ethnicity, have a literate mother and own a radio, and less likely to own cattle
89.2 % 91.2 % Height, weight, mid-upper
arm circumference, waist circumference, skinfold thickness
Stewart et al. [47] 6–8 years 3673 also in subsequent childhood trial of iron, folic acid and zinc
Loss to follow-up did not differ between groups; large number did not complete all tests; children with missing data less likely to be of Pahadi ethnicity or to have had any schooling, and had slightly lower BMI
Overall 84.1 %; number of participants varied for each test or measurement
Overall 85.1 %; number of participants varied for each test or measurement
Metabolic syndrome BMI, waist circumference, blood pressure, HbA1c, urine
microalbumin:creatinine, cholesterol, glucose, insulin, homeostasis model assessment
Christian et al. [51] 7–9 years In control group of subsequent iron and zinc pre-school trial; children followed up in this study represent 23 % of live births in relevant allocation groups in the original trial
Main loss to follow-up was exclusion of children taking part in postnatal supple mentation trial; children lost more likely to be of Pahadi ethnicity, literate mother, own a radio and less likely to own cattle
75.2 % of subgroup 84.2 % of subgroup Cognition
Universal Non-verbal Intelligence Test Movement Assessment Battery for Children
Finger-tapping test Executive Function (Stroop Numbers Test, backward digit span, go/no-go) Environment (Middle Childhood Home Observation for the Measurement of the Environment inventory) Maternal intelligence (Raven Coloured Progressive Matrices)
Christian et al. [40] 6–8 years None reported None reported 96.1 % 96.0 % Mortality
a
Defined as total number measured as a proportion of the total number available for measurement (livebirths minus deaths), as a percentage b
The percentage excludes 1643 families who have moved out of the area
MMNmultiple micronutrient supplement
Devakuma
r
et
al.
BMC
Medicine
(2016) 14:90
Page
9
of
at 8.5 years (0.02 mmHg; –1.02 to 1.05) [39, 43]. The Bangladesh MINIMat cohort showed no difference at 4.5 years compared with a control group who received iron 30 mg and folic acid [46]. The Nepal Sarlahi trial found neither a difference in blood pressure at 7.5 years, nor a difference in other cardiovascular risk markers com-pared with a control group who received iron 60 mg and folic acid [47]. Meta-analysis of the three trials showed no difference in blood pressure: the difference in systolic blood pressure was 0.11 mmHg (95 % CI,–0.41 to 0.63; I2, 0 %), and in diastolic pressure 0.47 mmHg (95 % CI,–0.01 to 0.95; I2, 0 %; Additional file 1: Figure S4). Subgroup analysis for trials that used iron 60 mg in the control group was similar: systolic blood pressure difference 0.16 mmHg (95 % CI,–0.54 to 0.87; I2, 0 %), and diastolic 0.37 mmHg (95 % CI,–0.35 to 1.08; I2, 0 %; Additional file 1: Figure S3).
Cognitive function
The Bangladesh MINIMat, China, and Indonesia trials all assessed subgroups of children: in Bangladesh, children born in a 19-month period, at 7 months of age [48]; in China, in the middle year of the trial up to 1 year of age [49] and at 8.8 years [50]; and in Indonesia, in women assigned to blood tests and whose children were born in a 6-month time period, at 3.5 years of age [37]. The Nepal Sarlahi study administered cognitive, motor and executive function tests at 7–9 years of age. Mean cognitive scores were a little lower for the MMN group compared to iron, folic acid and vitamin A (Universal Nonverbal Intelligence Test score,–2.4; 95 % CI,–4.6 to–0.2). Results of motor and executive function tests were mixed [51]. The Bangladesh MINIMat and China trials found no difference in motor or psychomotor scores [48, 49]. The Indonesia trial found an increase in motor ability in an adjusted Table 3Mortality outcomes
Location Follow-up study Deaths in control groupa Livebirths in
control group
Deaths in
intervention groupa Livebirths inMMN group Mortality difference a
MMN–control, per
1000 livebirths (95 % CI) Bangladesh,
JiVitA
West et al. [26] 764
625 neonatal 139 at 29–180 days
14,142 741
626 neonatal 115 at 29–180 days
14,374 –2.5 (–8.1 to 3.1)b
Bangladesh, MINIMat
Persson et al. [27] 33
23 neonatal 10 post-neonatal to 5 years
612 34
25 neonatal
9 post-neonatal to 5 years
595 3.2 (–22.6 to 29.0)
Burkina Faso Roberfroid
et al. [35]
45 7 neonatal 38 post-neonatal to 30 months
644 55
11 neonatal 44 post-neonatal to 30 months
650 14.7 (–14.3 to 43.8)
Chinac Wang et al. [41] 16
16 neonatal 0 in children born in 2004
1499 20
18 neonatal
2 in children born in 2004
1469 6.10 (–3.9 to 17.3)b
Guinea Bissau Andersen et al. [36] 57
25 neonatal 9 at 29–91 days 10 at 92–365 days 13 at 366–730 days
519 65
29 neonatal 6 at 29–91 days 21 at 92–365 days 9 at 366–730 days
528 13.3 (–25.8 to 52.4)
Indonesiac Prado et al. [37] 580 infant
17 in subsample
14,053 490 infant
12 in subsample
14,373 –13.2 (–33.4 to 7.1)b
Mexicoc Ramakrishnan
et al. [38]
7
6 early deaths 1 in control group of childhood randomisation
460 4
4 early deaths
456 –10.30 (–29.30 to 6.60)
Nepal Janakpur Devakumar
et al. [39]
22 12 neonatal 6 post-neonatal 4 at 1–8 years
564 23
17 neonatal 4 post-neonatal 2 at 1–8 years
567 1.6 (–21.2 to 24.3)
Nepal Sarlahi Christian et al. [40] 54
34 before 91 days 20 at 91 days to 7 years
773 81
52 before 91 days 29 at 91 days to 7 years
872 23.0 (–5.2 to 51.3)b
a
Mortality figures given for the most recent follow-up. In the case of the Bangladesh MINIMat study, this was the trial paper b
The analysis accounts for clustering in relevant trials. Design effects of 1.15, 1.20 and 1.20 were predicted in the Bangladesh JiVitA, Indonesia and Nepal Sarlahi trials, respectively [26,29,34]; the China trial did not report a figure and we used a design effect of 1.20
c
The follow-up report described a subgroup of children; confidence intervals were created using a simulation approach, as described in more detail in the methods section
analysis expressed as a fraction of the variation of the score (0.19; 95 % CI, 0.02 to 0.37) [37]. The Bangladesh MINIMat follow-up found no difference in problem solving or behaviour [48]. In the China trial, there were no differences at 3 or 6 months, but age-adjusted scores at 1 year were higher for mental development in the MMN supplementation group (1.20 points; 95 % CI, 0.32 to 2.08: equivalent to about 6 days of age) [49]. At 8.8 years of age, there were no differences in cognitive scores compared to folic acid or to iron and folic acid groups [50]. The Indonesia trial follow-up found no difference in visuospatial and visual attention, executive functioning, language ability, or socioemotional development [37].
For completeness, we mention stratified analyses. In the Bangladesh MINIMat trial, stratification by maternal BMI, combining the early and usual food groups together, showed an increase in Psychomotor Development Index in children whose mothers had been allocated to MMN supplements and had BMI < 18.5 kg/m2 (0.22 z scores; 0.01 to 0.42; interaction term,P= 0.05) [48]. In Indonesia, MMN supplementation was associated with greater motor ability (β= 0.35zscores; 95 % CI, 0.01 to 0.69, interaction term,P= 0.04) and visual attention/spatial ability (β= 0.35; 95 % CI, 0.08 to 0.63, interaction term, P= 0.01) in chil-dren of undernourished mothers (MUAC, < 23.5 cm).
These differences were equivalent to approximately 5 months of age [37].
Respiratory
The Nepal Janakpur trial investigated lung function at 8.5 years of age. Spirometry data were obtained from 836 children, with 793 (95 %) achieving optimal results using American Thoracic Society/European Respiratory Society guidelines [55]. No difference in lung function was found between allocation groups: forced expiratory volume in the first second,–0.01 L (95 % CI,–0.04 to 0.02 L); forced vital capacity,–0.01 L (95 % CI,–0.04 to 0.02 L) [52].
Assessment of bias
Trials
The trials were considered high quality and bias was not thought to be important. There was potential selection bias in the Guinea-Bissau trial as a result of inadequately concealed allocation [24], and potential attrition bias for the Nepal Janakpur and Mexico trials, in which exclusions prior to randomization were not reported [25, 30].
Follow-up reports
The trials were powered on the primary outcomes of gestational age and birthweight (and mortality, in the
Fig. 1Forest plot showing mortality rate per 1000 livebirths (meta-analysis using a random effects model)
Table 4Anthropometry, body composition and cardiovascular results
Follow-up study
Weight difference (z scores)
% Underweight (<–2zscores)
Height difference (z scores)
% Stunted (<–2zscores)
Weight-for-height/length or BMI for age
% Wasted or low BMI (<–2z scores)
Body composition and skin fold thickness
Body circumferences
Blood pressure Other
Bangladesh MINIMat
Khan et al. [42]
Anthroa
Calculated difference: 0 (–0.114 to 0.114)
Calculated difference:– 0.01 (–0.13 to 0.11)
4.8 % (0.8–8.9) more stunting across all measurements
Calculated difference: Wt-for-htzscore, 0.01 (–0.09 to 0.11)
Khan et al. [45]
Body compa
Lean mass, 0.000 kg (–0.123 to 0.125 kg); fat mass, 0.001 kg (–0.058 to 0.061 kg); no difference in biceps, triceps, subscap or suprailiac skinfold thicknesses Calculated difference: head, 0.02 cm (–0.20 to 0.24) MUAC, 0.11 cm (–0.04 to 0.26 cm)
Hawkesworth et al. [46]
Compared to 30 mg iron control adjusted for iron intervention dummy and food intervention variables: Systolic, 0.05 (–0.71 to 0.81); Diastolic, 0.55 (–0.10 to 1.20)
No difference in kidney volumes compared to 30 mg iron
Burkina Faso
Roberfroid et al. [35]
0.13 (–0.01 to 0.27)b
Hazard ratio in 1st year of life 0.84 (0.70, 1.02)c
–0.02 (–0.18 to 0.14)bLength for age was significantly higher in the first year, but this disappeared by 30 months
Hazard ratio in 1st year of life, 0.73 (0.60–0.87)c
0.20 (0.06–0.34)b
Wt-for-ht was lower initially but higher in MMN from≥ 10 months
Hazard ratio in 1st year of life, 1.10 (0.90–1.35)c
MUAC for age z, 0.18 (–2.93 to 3.29)b
China Wang
et al. [41]
Pooled (1– 30 months) adjusted difference: 0.03 (–0.05 to 0.10)d
Pooled (1-30 months) adjusted. OR 0.95 (0.71, 1.29)d
Pooled (1–30 months) adjusted difference, 0.02 (–0.07 to 0.10)d
Pooled (1–30 months) adjusted; OR, 0.82 (0.63–1.07)d
Pooled wt-for-length (1–30 months) adjusted differ ence, 0.03 (–0.05 to 0.11)d
Table 4Anthropometry, body composition and cardiovascular results(Continued)
0.89 (0.58– 1.36)d
Mexico Ramakrishnan et al. [38]
Calculated difference:– 0.1 (–0.34 to 0.14)
Calculated difference: 0.2 (–0.08 to 0.48)
Calculated difference: Wt-for-ht–0.2 (–0.42 to 0.02)
Calculated difference: head, 0.2 cm (–0.42 to 0.82)
Nepal Janakpur
Vaidya et al. [43] 0.14 (0.00– 0.27)
37.8 % in control, 36.6 % in MMN
0.08 (–0.06 to 0.22)
60 % in control, 56.7 % in MMN
Wt-for-ht 0.12 (–0.02 to 0.26)
5.5 % in control, 6.3 % in MMN
Triceps, 0.20 mm (0.00– 0.40 mm)
Head, 0.24 cm (0.06–0.43 cm); MUAC, 0.24 cm (0.11–0.37 cm)
Systolic,
–2.5 mmHg (0.47– 4.55 mmHg); Diastolic,
–1.5 mmHg (–3.1 to 0.4 mmHg)
Devakumar et al. [39]
0.05 (–0.09 to 0.19)
Not recorded by trial group
0.02 (–0.10 to 0.15)
Not recorded by trial group
BMI for age 0.04 (–0.09 to 0.18)
Not recorded by trial group
Lean mass,
–0.05 kg (–0.43 to 0.34 kg); fat mass,–0.07 kg (–0.32 to 0.18 kg); no difference in biceps, triceps, subscapular and suprailiac skinfold thicknesses
Head, 0.18 cm (–0.02 to 0.38); MUAC, 0.04 (–0.15 to 0.23 cm)
Systolic, 0.02 mmHg (–1.02 to 1.05 mmHg); Diastolic, 0.13 mmHg (–0.93 to 1.19 mmHg)
No difference in kidney dimensions; exclusion of children with chronic or major illness made no difference
Nepal Sarlahi
Stewart et al. [44]
Calculated difference:
–0.04 (95 % CI,–0.15 to 0.07)e
Calculated difference: 0.3 % (95 % CI,–5.4 to 6.0)e
Calculated difference:
–0.02 (–0.13 to 0.09)e
Calculated difference: 3.7 % (–2.0–9.4)e
BMI for age calculated difference:– 0.04 (–0.14 to 0.06)e
Triceps: FeFol + vit A, 5.84 mm; MMN, 5.9 mm; Subscap: MMN, 4.81 mm; FeFol + vit A 4.75 mm
MUAC: FeFol + vit A, 15.4 cm; MMN, 15.4 cm
Stewart et al. [47]
Waist: FeFol + vita A, 51.27 cm; MMN, 51.22 cm
Systolic: FeFol + vit A, 95.2 mmHg; MMN, 95.5 mmHg; calculated difference, 0.29 mmHg (95 % CI,–0.65 to 1.23)d
Diastolic: FeFol + vit A, 63.9 mmHg; MMN, 64.4 mmHg;
Non-fasting glucose: FeFol + vit A,
3.91 mmol/L; MMN, 3.86 mmol/L; LDL: FeFol +
vit A, 1.89 mmol/L; MMN, 1.84 mmol/L; HDL: FeFol + vit A, 0.72 mmol/L; MMN, 0.70 mmol/L; at risk
Table 4Anthropometry, body composition and cardiovascular results(Continued)
calculated difference, 0.56 mmHg (95 % CI,–0.38 to 1.50)d
for metabolic syndrome: FeFol + vit A, 12.2 %; MMN, 11.9 %
Results are unadjusted differences unless otherwise stated. Calculated differences use results given in the paper to calculate the difference (intervention–control) in outcome and confidence intervals
HDLhigh density lipoprotein,LDLlow density lipoprotein,FeFoliron and folic acid,MMNmultiple micronutrient supplement a
Comparisons were made with the 60 mg iron, 400μg folic acid group and“usual”food supplementation b
Parity, gestation, age at measurement, age at delivery, malaria treatment, health centre c
Malaria, health centre, parity, gestational age d
Mixed linear models. Fixed effects: treatment, age, gender, birth weight, preterm, parity, feed methods, time of stay at outdoor, illness or health in last month before the interview, mother’s height, educational level, occupation, number of supplement tablets consumed, and family socioeconomic status; random effects: village and individual subject
e
We have adjusted for cluster randomized controlled trial, assuming a design effect of 1.20
Devakuma
r
et
al.
BMC
Medicine
(2016) 14:90
Page
14
of
case of the Bangladesh JiVitA Indonesia trials) [29]. Follow-up reports described power or sample size calcu-lations before data collection, with the exception of the Bangladesh MINIMat (cardiovascular) [46], Burkina Faso (anthropometry) [35] and Nepal Sarlahi (anthropometry and cardiovascular reports) follow-up publications [44, 47]. There was little statistical heterogeneity, with I2 values low for primary analyses (0–8 %). Some clinical heterogeneity was present as participants were from dif-ferent countries and ages of follow-up varied. The inter-vention was the same in most cases, but (as described above) the Bangladesh JiVitA, Mexico and Nepal Sarlahi trials used slightly different multiple micronutrient for-mulations, and the Bangladesh JiVitA, Indonesia, Mexico and Nepal Sarlahi trials used different controls. Although choice of outcomes varied from one report to another, similar methods were used to assess similar outcomes.
Selection bias
Primarily a result of inadequate randomisation and allo-cation concealment, this has been covered in the 2015 Cochrane assessment [20]. An additional potential source of bias is selection of trials from the Cochrane review that did not show an increase in birthweight associated with MMN supplementation. The Cochrane review included 14 trials in its analysis of SGA. Of the five not considered here [56–60], one showed a significant reduction in SGA (Fawzi et al. [57], Tanzania; RR, 0.79; 95 % CI, 0.70–0.89).
Supplement composition was substantially different in this trial, which compared a supplement containing eight vita-mins and no minerals with a 60 mg iron and 250μg folic acid control [57]. Meta-analysis of the trials included in our review showed an increase in birthweight of 30.2 g (95 % CI, 14.1 to 46.3), which is similar in magnitude to that found in previous meta-analyses [11, 61–63]. Simi-larly, three of the 11 trials included in the meta-analysis of neonatal mortality did not conduct follow-up studies. None of these trials showed a reduction in neonatal mor-tality. Meta-analysis of neonatal mortality rate for included trials produced an RR of 1.01 (95 % CI, 0.90 to 1.16).
Performance and detection bias
Participants and data collectors in all follow-up reports remained blind to allocation, with the exception of Guinea-Bissau, where this was not mentioned explicitly in the report.
Attrition bias
While all reports described loss to follow-up (Table 2), attrition bias was relatively small (0–29 %), except in the Mexico trial, in which just over half the children were seen at 24 months. The largest group lost were too old (>3 months) at the start of the follow-up. Excluding this group, follow-up rates were similar to those of the other reports. No important differences in loss to follow-up
Fig. 2Forest plot showing weight-for-age (meta-analysis using a random effects model)
between allocation groups were reported, with the ex-ception of China at 9 years, where study groups differed by school type, recent respiratory tract infection, mother’s occupation (farmer or other) and father’s level of educa-tion. These biases work in opposite directions and were accounted for in the analyses [50]. Where recorded, differ-ences between children retained and lost to follow-up were small. Children lost to follow-up tended to have mothers with more education (Bangladesh MINIMat, Nepal Janakpur, Mexico and Nepal Sarlahi), lower parity and younger age (Bangladesh MINIMat and Mexico), and were more likely to live in an urban location (Nepal Janakpur), have differences in ethnicity and assets (Nepal Sarlahi), and lower birthweight and shorter gestation (Bangladesh MINIMat). Maternal age, weight, height and parity also differed in Guinea-Bissau, but the directions of these effects were not reported. Although most reports did not enumerate them, losses for individual outcomes also occurred: (>20 % loss to measurement) kidney vol-ume and function in the Bangladesh MINIMat trial, body composition in the Nepal Janakpur trial, and fasting glu-cose, insulin and homeostasis model assessment in the Nepal Sarlahi trial.
Reporting bias
We could not make a definitive assessment of reporting bias as follow-up protocols were unpublished, but funnel plots for mortality, HAZ, WAZ and head circumference,
using results from the most recent follow-up report, did not suggest publication bias for the primary outcomes (Additional file 1: Figure S5).
Discussion
We found 20 follow-up reports for nine trials, covering a range of health outcomes. Nine studies reported on mortality, six on weight, six on height, and four on cog-nitive function, but there were few reports of other out-comes. Our hypothesis was not confirmed – we found no evidence that antenatal MMN supplementation, com-pared with iron and folic acid supplementation, led to improved survival, improved growth, lower blood pres-sure, or improved lung function in childhood. Potential improvements in cognitive outcomes were observed, but these were small and inconsistent and tended to be seen in subgroups.
Quality of trials and limitations of the review
The trials had low risks of bias and were generally considered of high-quality [20]. The degree of loss to follow-up was not substantial, although in some cases only subgroups were followed up. Differential loss to follow-up between intervention and control groups did not appear to be an issue, and neither did selective publication, as most trials reported null findings. The evidence on antenatal MMN supplementation comes from a large sample and a substantial number of trials,
Fig. 3Forest plot showing height-for-age (meta-analysis using a random effects model)
many of which were coordinated. The trials considered here were spread geographically, although 13 of the 20 follow-up reports were from South Asia, which may have affected generalizability. Differences between the Nepal and Bangladesh reports emphasize the fact that variation can occur within similar populations.
The main limitation was that not all trials had published reports on follow-up. We cannot be certain whether a se-lection bias exists, but we found no indication of this. Follow-up reports have published null findings, rather than positive ones. If a publication bias does exist, it would not work in this direction. None of the trials had initially set out to observe childhood outcomes. While power cal-culations were performed prior to most follow-ups, trials were powered on birth outcomes and larger sample sizes may be required to detect small differences in childhood. Functional outcomes were measured at different ages and may not be comparable. We attempted to address this by using z scores, adjusted for age and sex, as primary out-comes. This was not always possible and limits inferences from the head circumference and blood pressure findings. We tried to make comparisons as similar as possible, but our findings could be vitiated by slightly different MMN and control supplement compositions in some trials.
Mortality
Antenatal MMN supplementation was initially hypothe-sized to reduce mortality, but increases in neonatal mor-tality were suspected in some trials [64]. A meta-analysis did not find a difference in neonatal mortality overall, but raised concerns about increased early neonatal
mortality (OR, 1.23; 95 % CI, 0.95 to 1.59). The 2015 Cochrane review found a reduction in stillbirths (0.91; 95 % CI, 0.85 to 0.98, n= 15), and no effect on perinatal (0.97; 95 % CI, 0.84 to 1.12,n= 12) or neonatal mortality (0.98; 95 % CI, 0.90 to 1.07, n= 11) [20]. The reduction in stillbirths is interesting and potentially important [65]. It depended on the analytical weighting (57 %) of the study by West et al. [26] and the use of a fixed effects model, and requires confirmation. A suggestion that MMN supplementation would prevent 43,715 annual child deaths (with 90 % coverage in 34 countries most in need) followed from the Lives Saved Tool model, based on evidence that reductions in the prevalence of SGA are as-sociated with reduced stunting and subsequent child sur-vival [12]. Our analyses did not identify evidence of an effect on child mortality and do not support the assump-tions made in the Lives Saved Tool.
Anthropometry and body composition
Overall, follow-up reports did not show differences in anthropometry or body composition. A transient im-provement was seen in early life in the Burkina Faso and Nepal Janakpur trials, and there was a suggestion of in-creased stunting in Bangladesh, but these findings were not replicated in other reports. There was a consistent lack of effect on height. It is conceivable that MMN sup-plementation could have physiological effects that are not manifest in substantial anthropometric change. For example, transient greater weight in early childhood could have long-term benefits, even if not apparent in the short-term.
Fig. 4Forest plot showing head circumference (meta-analysis using a random effects model)
Cognitive development
Small improvements in mental development were seen in China [49] at 1 year but not at 9 years, cognitive score was lower in Nepal Sarlahi [51], and the Bangladesh MINIMat and Indonesia trials found improvements in subgroups of mothers with poorer nutritional status only [37, 48]. Considering the number and range of tests con-ducted, antenatal MMN supplements did not appear to lead to a consistent cognitive benefit. When found, dif-ferences tended to be small and three of the five reports involved children under 4 years, in whom cognitive tests are less reliable than in older children. Further assessment of these cohorts is warranted.
Other outcomes
Comparison of follow-ups did not confirm the impression of transiently lower systolic blood pressure at 2.5 years in the Nepal Janakpur trial, or of improved lung function in children seen in a similar trial of vitamin A supplementa-tion from Nepal Sarlahi [66]. Only one trial considered other cardiovascular risk markers and found no effects.
Inferences
On the basis of the reports we have reviewed, current evidence does not support changing the recommenda-tion for routine antenatal supplementarecommenda-tion from iron and folic acid to MMN formulations. It is possible – even probable – that the trial populations differed in their patterns of micronutrient deficiency. There was lit-tle evidence to suggest that this influenced the general findings. Although there is consistent evidence that antenatal MMN supplementation increases birth weight, none of the studies demonstrated convincingly that it benefitted offspring in terms of functional or health out-comes, and the directions and magnitudes of effect were similar for mortality and anthropometric outcomes across the study sites. The findings of the Cochrane re-view on which recent advocacy for routine antenatal MMN supplementation are based are supported by other meta-analyses that have shown an increase in mean birth-weight of 22–54 g and corresponding reductions in low birthweight and SGA. As may be expected, the erosion over time of anthropometric differences observed at birth suggests that infants of women who received antenatal MMN supplements lost an advantage over the first few years. This could be the result of numerous environmental stresses over postnatal life. No other changes in anthro-pometry, gestation or mortality were found [11, 20, 22, 61–63]. However, improvement in later health outcomes does not necessarily depend on supplementation causing an increase in birthweight (or organ size). The mecha-nisms of action are likely to be multifactorial and follow-up reports suggest other mechanisms such as the effect of vitamin A on regulation of fetal lung growth, branching
and alveolarisation [67, 68]. We also cannot rule out ef-fects emerging later in life or in the next generation. From an evolutionary perspective, supplementing mothers could potentially benefit the woman herself, the index baby, or future offspring. Antenatal micronutrient supplementation has a role in women with a deficiency-related illness, and possibly in micronutrient deficiency itself, but population supplementation may need to start earlier, either in the first trimester or pre-conception, to include the period of rapid organogenesis and genome-wide epigenetic changes that follow fertilization, and be continued into childhood [16, 69, 70]. The formulations of MMN tested may also not be the optimum ones. We cannot rule out the possibility that combinations other than the ones tested might have positive outcomes. It is possible that additional micronutri-ents, or different doses, might result in functional benefits.
The annual cost of MMN supplementation in pregnancy (at 90 % coverage) in the 34 LMICs in which it would be most useful is estimated at (International)$ 472 million [12]. If, as our review suggests, initiating antenatal MMN supplementation in early/mid-pregnancy does not lead to the anticipated improvements in childhood function or health–the main current justification for recommending it –the opportunity costs to other programmes that do lead to improvements will need to be considered.
Implications for future research
More evidence is needed, especially on cognitive devel-opment, cardiovascular risk markers and lung function, to adequately appraise the long-term effects of antenatal MMN supplementation. We recommend follow-up studies in more of the MMN trials. Further research into biological mechanisms by which an early advantage could be attenuated will help in our understanding of the intervention and in designing future trials.
Conclusions
In summary, our review of published follow-up reports has not shown persisting effects of antenatal MMN sup-plementation during childhood, compared with iron and folic acid. Phenotypic and physiological differences may arise later in life or as more research is conducted, but the current evidence base is insufficient to support routine MMN supplementation in pregnancy at a population level in low- and middle-income countries.
Additional file
Additional file 1:The search strategy, micronutrient constituents, PRISMA flow chart, sub-group analyses and funnel plots. (PDF 305 kb)
Abbreviations
BMI, body mass index; HAZ, height-for-agezscore; MMN, multiple micronutrient; SGA, small for gestational age; WAZ, weight-for-agezscore; WHO, World Health Organization
Acknowledgements
Heather Chesters helped perform the literature search.
Funding
There was no specific funding for this study. DD is supported by the National Institute of Health Research. DO is supported by The Wellcome Trust (091561/Z/10/Z). HSS receives support from Sitaram Bhartia Institute of Science and Research, New Delhi. CHDF and CO are supported by the Medical Research Council and Department for International Development.
Authors’contributions
DD and JCKW performed the literature search. AC, BM, CHDF, DD, DO, HSS, and JCKW reviewed the reports and extracted the data. DD and CO performed the analysis. DD wrote the first draft. All authors read and criticised drafts of the manuscript.
Competing interests
The authors declare that they have no competing interests.
Consent for publication
There is no individual person data.
Ethics approval and consent to participate
Not applicable. The paper is a review of published research and there was no primary data collection.
Author details
1Institute for Global Health, University College London, 30 Guilford St, London, UK.2MRC Lifecourse Epidemiology Unit, University of Southampton, Southampton General Hospital, Tremona Road, Southampton, UK.3Pediatrics and Clinical Epidemiology at Sitaram Bhartia Institute of Science and Research, B-16, Qutab Institutional Area, New Delhi, India.4Faculty of Medicine, University of Southampton, Southampton General Hospital, Tremona Road, Southampton, UK.5Childhood Nutrition Research Centre, Institute of Child Health, University College London, 30 Guilford St, London, UK.
Received: 11 February 2016 Accepted: 2 June 2016
References
1. Micronutrient deficiencies. http://www.who.int/nutrition/.
2. Fall CH, Yajnik CS, Rao S, Davies AA, Brown N, Farrant HJ. Micronutrients and
fetal growth. J Nutr. 2003;133(5 Suppl 2):1747S–56.
3. Christian P, Stewart CP. Maternal micronutrient deficiency, fetal development, and the risk of chronic disease. J Nutr. 2010;140(3):437–45.
4. Costello AM, Osrin D. Micronutrient status during pregnancy and outcomes
for newborn infants in developing countries. J Nutr. 2003;133(5 Suppl 2): 1757S–64.
5. Stevens GA, Finucane MM, De-Regil LM, Paciorek CJ, Flaxman SR, Branca F,
et al. Global, regional, and national trends in haemoglobin concentration and prevalence of total and severe anaemia in children and pregnant and non-pregnant women for 1995-2011: a systematic analysis of population-representative data. Lancet Glob Health. 2013;1(1):e16–25.
6. World Health Organisation. Global prevalence of vitamin A deficiency in
populations at risk 1995–2005. WHO Global Database on Vitamin A
Deficiency. Geneva: World Health Organization; 2009.
7. McCauley ME, van den Broek N, Dou L, Othman M. Vitamin A
supplementation during pregnancy for maternal and newborn outcomes. Cochrane Database Syst Rev. 2015;10:CD008666.
8. De-Regil LM, Fernandez-Gaxiola AC, Dowswell T, Pena-Rosas JP. Effects and
safety of periconceptional folate supplementation for preventing birth defects. Cochrane Database Syst Rev. 2010;10:CD007950.
9. Blencowe H, Cousens S, Modell B, Lawn J. Folic acid to reduce neonatal
mortality from neural tube disorders. Int J Epidemiol. 2010;39 Suppl 1:i110–21. 10. Pena-Rosas JP, De-Regil LM, Dowswell T, Viteri FE. Daily oral iron supplementation
during pregnancy. Cochrane Database Syst Rev. 2012;12:CD004736.
11. Fall CH, Fisher DJ, Osmond C, Margetts BM. Multiple micronutrient
supplementation during pregnancy in low-income countries: a meta-analysis of effects on birth size and length of gestation. Food Nutr Bull. 2009;30(4 Suppl):S533–46.
12. Bhutta ZA, Das JK, Rizvi A, Gaffey MF, Walker N, Horton S, et al. Evidence-based interventions for improvement of maternal and child nutrition: what can be done and at what cost? Lancet. 2013;382(9890):452–77.
13. Haider BA, Bhutta ZA. Multiple-micronutrient supplementation for women
during pregnancy. Cochrane Database Syst Rev. 2012;11:CD004905. 14. Victora CG, Adair L, Fall C, Hallal PC, Martorell R, Richter L, et al. Maternal
and child undernutrition: consequences for adult health and human capital. Lancet. 2008;371(9609):340–57.
15. Barker DJ, Gluckman PD, Godfrey KM, Harding JE, Owens JA, Robinson JS.
Fetal nutrition and cardiovascular disease in adult life. Lancet. 1993; 341(8850):938–41.
16. Waterland RA, Michels KB. Epigenetic epidemiology of the developmental
origins hypothesis. Annu Rev Nutr. 2007;27:363–88.
17. Barker DJ. Fetal origins of coronary heart disease. BMJ. 1995;311(6998):171–4.
18. Painter RC, Roseboom TJ, Bleker OP. Prenatal exposure to the Dutch famine
and disease in later life: an overview. Reprod Toxicol. 2005;20(3):345–52.
19. Warner MJ, Ozanne SE. Mechanisms involved in the developmental
programming of adulthood disease. Biochem J. 2010;427:333–47.
20. Haider BA, Bhutta ZA. Multiple-micronutrient supplementation for women
during pregnancy. Cochrane Database Syst Rev. 2015;11:CD004905. 21. World Health Organization. Guideline: daily iron and folic acid supplementation
in pregnant women. Geneva: World Health Organization; 2012.
22. Ronsmans C, Fisher DJ, Osmond C, Margetts BM, Fall CH. Maternal
Micronutrient Supplementation Study Group. Multiple micronutrient supplementation during pregnancy in low-income countries: a meta-analysis of effects on stillbirths and on early and late neonatal mortality. Food Nutr Bull. 2009;30(4 Suppl):S547–55.
23. Roberfroid D, Huybregts L, Lanou H, Henry MC, Meda N, Menten J, et al.
Effects of maternal multiple micronutrient supplementation on fetal growth: a double-blind randomized controlled trial in rural Burkina Faso. Am J Clin Nutr. 2008;88(5):1330–40.
24. Kaestel P, Michaelsen KF, Aaby P, Friis H. Effects of prenatal multimicronutrient supplements on birth weight and perinatal mortality: a randomised, controlled trial in Guinea-Bissau. Eur J Clin Nutr. 2005;59(9):1081–9.
25. Ramakrishnan U, Gonzalez-Cossio T, Neufeld LM, Rivera J, Martorell R. Multiple micronutrient supplementation during pregnancy does not lead to greater infant birth size than does iron-only supplementation: a randomized controlled trial in a semirural community in Mexico. Am J Clin Nutr. 2003;77(3):720–5. 26. West Jr KP, Shamim AA, Mehra S, Labrique AB, Ali H, Shaikh S, et al. Effect of
maternal multiple micronutrient vs iron-folic acid supplementation on infant mortality and adverse birth outcomes in rural Bangladesh: the JiVitA-3 randomized trial. JAMA. 2014;312(24):2649–58.
27. Persson LA, Arifeen S, Ekstrom EC, Rasmussen KM, Frongillo EA, Yunus M,
et al. Effects of prenatal micronutrient and early food supplementation on maternal hemoglobin, birth weight, and infant mortality among children in Bangladesh: the MINIMat randomized trial. JAMA. 2012;307(19):2050–9.
28. Zeng L, Dibley MJ, Cheng Y, Dang S, Chang S, Kong L, et al. Impact of
micronutrient supplementation during pregnancy on birth weight, duration of gestation, and perinatal mortality in rural western China: double blind cluster randomised controlled trial. BMJ. 2008;337:a2001.
29. Supplementation with Multiple Micronutrients Intervention Trial Study
Group, Shankar AH, Jahari AB, Sebayang SK, Aditiawarman, Apriatni M, et al. Effect of maternal multiple micronutrient supplementation on fetal loss and infant death in Indonesia: a double-blind cluster-randomised trial. Lancet. 2008;371(9608):215–27.
30. Osrin D, Vaidya A, Shrestha Y, Baniya RB, Manandhar DS, Adhikari RK, et al. Effects of antenatal multiple micronutrient supplementation on birthweight and gestational duration in Nepal: double-blind, randomised controlled trial. Lancet. 2005;365(9463):955–62.
31. Christian P, West KP, Khatry SK, Leclerq SC, Pradhan EK, Katz J, et al. Effects of maternal micronutrient supplementation on fetal loss and infant mortality: a cluster-randomized trial in Nepal. Am J Clin Nutr. 2003;78(6): 1194–202.
32. Margetts BM, Fall CH, Ronsmans C, Allen LH, Fisher DJ. Maternal
Micronutrient Supplementation Study Group. Multiple micronutrient supplementation during pregnancy in low-income countries: review of methods and characteristics of studies included in the meta-analyses. Food Nutr Bull. 2009;30(4 Suppl):S517–26.
33. UNICEF/WHO/UN. Composition of a multi-micronutrient supplement to be
used in pilot programmes among pregnant women in developing countries. New York: United Nations Children’s Fund; 1999.