World Maritime University
The Maritime Commons: Digital Repository of the World
Maritime University
World Maritime University Dissertations Dissertations
2000
The impact of the Asian economic crisis on the
regional container lines
Akanid Jintanukul
World Maritime University
Follow this and additional works at:http://commons.wmu.se/all_dissertations Part of theRegional Economics Commons
This Dissertation is brought to you courtesy of Maritime Commons. Open Access items may be downloaded for non-commercial, fair use academic purposes. No items may be hosted on another server or web site without express written permission from the World Maritime University. For more
Recommended Citation
Jintanukul, Akanid, "The impact of the Asian economic crisis on the regional container lines" (2000).World Maritime University Dissertations. 305.
WORLD MARITIME UNIVERSITY
Malmö, Sweden
THE IMPACT OF ASIAN ECONOMIC ON THE
REGIONAL CONTAINER LINES (RCL)
By
AKANID JINTANUKUL
Thailand
A dissertation submitted to the World Maritime University in partial fulfilment of the requirement for the award of the degree of
MASTER OF SCIENCE
in
SHIPPING MANAGEMENT
2000
DECLARATION
I certify that all material in this dissertation that is not my own work has been identified, and that no material is included for which a degree has previously been conferred on me.
The contents of this dissertation reflect my own personal views, and are not necessarily endorsed by the University.
Akanid Jintanukul 21 August 2000
Supervised by:Shuo Ma
Course Professor, Port- and Shipping Management World Maritime University
Assessor by: Tor Wergeland
Associate Professor, Shipping Management World Maritime University
Co-assessor by: Hercules Haralambides Professor of Maritime Economics ERASMUS University
Rotterdam, Netherlands
ACKNOWLEDGMENTS
The author would like to first and foremost gratefully praise Professor Ma Shuo, Shipping and Port Management course professor, his supervisor, for his encouragement, guidance and helpful suggestions to explore this challenging domain of knowledge. His comments have enabled the author to complete this dissertation.
Secondly, the author would like to thank C.W. Cole, lecturer in the English Department, who devoted his valuable time to making this dissertation readable.
ABSTRACT
Title of Dissertation: The impact of the Asian economic crisis on the Regional Container Lines
Degree: MSc
This dissertation is a study of the lessons learnt from the Asian economic crisis that impacted on the Regional Container Lines (RCL) on the Thailand and Singapore trade routes. It compares the repositioning solution that RCL used at that time with other possible repositioning solutions.
A brief look is taken at the correlation between the Asian economic crisis and the imports/exports in volume to/from East Asian countries, particularly in correction with the financial crisis countries that caused the imbalance of trade and the empty container movements. The impact of the Asian economic crisis on RCL is examined in terms of repositioning costs and how much this effected RCL. Benefit cost analysis and weight average analysis are used to analyse the possible repositioning solution with significant criteria such as conflict of interest, cost benefit and service specification in order to recommend to RCL how to prevent high costs by repositioning cost in the future. The Internet packages such as Interbox, SynchroNet, and Greybox are used to compare with Associated Empty Container in order to find the best repositioning solution for RCL.
TABLE OF CONTENTS
Declaration i
Acknowledgments ii
Abstract iii
Table of Contents v
List of Tables vii
List of Figures viii
List of Abbreviations ix
1. Introduction 1
1.1 Topic description 1
1.2 Scope of Topic 1
1.3 Dissertation objective 1
1.4 Difficulties encountered in the investigation 2 1.5 The approach or research method 2
2. Asian economic crisis 3
2.1 Asian economic – road to recovery 3 2.2 The impact of the Asian economic crisis on Trade 7 2.2.1 Trade development in Asia 7
2.2.2 Imbalance trade 8
2.2.2.1 World merchandise trade by region 8 2.2.2.2 Asia Imbalance trade 9 2.2.2.3 Financial crisis countries imbalance trade 10 2.3 Correlation between Asian economic and Trade development 11
4. Repositioning Solution 29 4.1 Associated Empty Containers 29
4.2 InterBox solution 32
4.3 SynchroNet solution 36
4.4 Greybox solution 40
4.5 Repositioning solution analysis 44 4.5.1 Conflict of Interest 44
4.5.1.1 Ownership and management of a container lease fleet
44
4.5.1.2 Data sharing limitation 44 4.5.1.3 Absolute neutrality and security 45 4.5.1.4 Control of equipment 45
4.5.2 Cost Benefit 46
4.5.2.1 Correction of repositioning solution in the
short-term 46
4.5.2.2 Correction of repositioning solution in the long-term
47
4.5.2.3 Cost effectiveness 48 4.5.2.3.1 Empty move transaction 48 4.5.2.3.2 Using leased containers 49 4.5.2.3.3 Interchange equipment 50 4.5.2.3.4 Cost effectiveness 51 4.5.3 Service Specification 52
4.5.3.1 Real-time information exchange and transaction
administration 52
4.5.3.2 Pooling and Analysis Capabilities 53 4.5.3.3 Cargo-Based (start-to-finish) Transaction
Recognition 53
4.6 The best repositioning solution 54
5. Conclusion 56
5.1 Conclusion 56
5.2 Recommendations 57
LIST OF TABLES
Table 1 East Asia’s performance…and prospects brighten… 6
Table 2 Trade developments in Asia, 1996-98 8
Table 3 World merchandise trade by region in 1993 and 1998 9
Table 4 Asia’s GDP and Import/Export in volume, 1993-98 12
Table 5 Thai exchange currency rate and trade imbalance in EA-5
countries 14
Table 6 RCL’ s containership fleet in Thailand and Singapore 16 Table 7 RCL’ s feeder service network in Thailand and Singapore 17
Table 8 Asia container movements 19
Table 9 Intra-Asia containerised traffic moving to/from South East Asia
19
Table 10 South East Asia and US container movements, 1996-98 20
Table 11 RCL year record (in millions of Baht) 26
Table 12 Associated empty container saving cost in 2000 31
Table 13 Reposition saving costs with InterBox in 2000 35
Table 14 Reposition saving costs with SynchroNet in 2000 38
Table 15 Repositioning saving costs with Greybox in 2000 43
LIST OF FIGURES
Figure 1 East Asia the road to recovery 4
Figure 2 Asia Imbalance trade in volume, 1996-98 10
Figure 3 EA-5 countries imbalance trade in volume, 1996-98 11
Figure 4 GDP and Imports (volume) in Asia, 1993-98 12
Figure 5 GDP and Exports (volume) in Asia, 1993-98 13
Figure 6 Thai Exchange Rate and Imbalance Trade in East Asia
economic crisis countries
14
Figure 7 RCL container movements inward to Thailand 22
Figure 8 Containers loaded and discharge in Thailand 23
Figure 9 RCL container movements inward to Thailand in 1996 and
1998
24
Figure 10 RCL container movements outward from Thailand in 1996 and
1998 24
Figure 11 Repositioning cost in 1996 and 1998 26
Figure 12 Empty/Total container movements 28
Figure 13 Repositioning saving costs for empty moves transaction in
2000
49
Figure 14 Repositioning saving costs for using leased containers in 2000 50
Figure 15 Repositioning saving costs for interchange equipment in 2000 51
LIST OF ABBREVIATIONS
BAF Bunker Adjustment Factor CAF Currency Adjustment Factor CAS Cooperative Access System CFS Container Freight Station CY Container Yard
EA5 East Asia five crisis – affected countries (World bank): Indonesia, Korea, Malaysia, Philippines, and Thailand FM Greybox Fleet Management
GDP Gross domestic product GIS Greybox interchange service GLS Greybox Logistics Services
GS Greyslot
IAS Internal Asset System ICD Inland Container Depot
ISL Institute of Shipping Economics and Logistics MISC Malaysian International Shipping Corp
MLOs Main Line Operations NIC New Industries countries NOL/APL American President Lines OOCL Orient Overseas Container Lines r Correlation Coefficients
RCL Regional Container Lines
South East Asia Brunei, Cambodia, Indonesia, Laos, Malaysia, Philippines, Singapore, Thailand, and Vietnam
TEU Twenty –foot equivalent unit THC Terminal Handling Charge
WB The World Bank
Chapter 1
Introduction
1.1 Topic description
This dissertation is based on the lessons learnt of the impact of the Asian economic crisis in mid 1997 on the Regional Container Lines (RCL). In Chapter 2 the dissertation considers the extent of the impact of the Asian economic crisis on trade in East Asian countries particular in financial economic crisis countries and the relationship between the Asian economy and Trade development. Chapter 3 considers the extent of the impact of the Asian economic crisis in container movement and how much this effected RCL. Chapter 4 analyses the possible solution to the problem of empty container movements for RCL and Chapter 5 has conclusion and recommendations.
1.2 Scope of Topic
The scope of the topic of this dissertation will focus on the impact of the Asian economic crisis on RCL in the Singapore and Thailand feeder trade routes since 90% of RCL container movement inward and outward to/from Thailand is involved in this route.
1.3Dissertation objectives
This dissertation has 4 main objectives as follows:
1. To describe, estimate and analyse the impact of the Asian economy on RCL. 2. To generate the possible alternative solutions.
3. To estimate with benefit and cost analysis each possible alternative solution. 4. To recommend the best solution to solve the problem of empty container
1.4 Difficulties encountered in the investigation.
The difficulties encountered in the investigation in this dissertation are as follows: 1. The difficulties to collect the latest data information for analysis to find the best
solution. The latest available data of RCL empty container movements is based on the latest Thailand shipping statistics from 1998. For the data of RCL empty container movements in 1999 it has to be assumed that the average growth rate decreased by 5% per annum from 1998.
2. The difficulties to forecast the possible percentage share of interchange equipment, leased container, or empty move transaction for each solution. This dissertation has to set the possible range of percentage from 10% to 50%.
1.5 The approach or research method
The approach of this dissertation to solve problems is as follows:
1. Collecting secondary data and information from the relevant year book data and various periodicals of journals and magazines.
2. Interviewing key persons related to the topic of this dissertation by email.
3. Conducting literature research in the WMU library, WMU computer room, and ISL library.
4. Consulting with experts at WMU, including visiting professors, visiting lecturers and presenters during field studies.
Chapter 2
Asian economic crisis
Chapter two describes the post Asian economic crisis that has signs of recovery in 1999 and 2000, analyses the impact of the Asian economic crisis on trade in East Asia countries particularly, in the financial crisis countries and analyses the relationship between Asian economy and Trade development.
2.1
Asian economy- road to recovery
trades of 85 US$ Billions compared with import trades of 60 US$ Billions produced higher reserves from 90 US$ Billion in Q4, 1997 to 140 US$ Billion in Q4, 1998. Contributing to confidence in currencies in the region, low interest rate and fiscal expansion have led to the beginning of recovery (The World Bank Annual Report [WB], 1999).
source : The World Bank Annual Report 1999.
However, the recovery is also fragile with external risks such as Japanese economy, US and European economies, oil price, and interest rate etc. As Masahiro Kawai and Richard Newfarmer, (2000) reported, “A Japanese recovery is crucial to the stabilization and prosperity of Asian economies but the Japanese economy has yet to emerge out of stagnation”. European economies, and US if they enter recession, Asian exports would suffer and likely cut short recovery (The World Bank Annual Report [WB], 1999). Some external risks that have quite differential consequences for the diverse national economies such as oil price. If the oil price increases it will hurt Thailand, Korea, and Japan but benefit Indonesia, Singapore and Malaysia. According to the World Bank staff (1999), estimate that oil prices are likely to rise from an average of US$ 18 per barrel to US$23 in 2000. This would impose terms of trade loss on Korea of US$5.9 billion, Thailand would loss US$1 billion. On the other hand, Indonesia and Malaysia would get benefits of US$1.6 billion and US$0.7 billion respectively.
Another external risk is interest rate. If interest rate increases are linked to floating rate foreign debt, these will have the largest gross effects on China, Korea, Indonesia, Malaysia and Thailand. However, earnings on now-substantial reserves cushion the net impacts substantially. The region’s recovery might continue, but on a lower growth trajectory (Kassum, 2000).
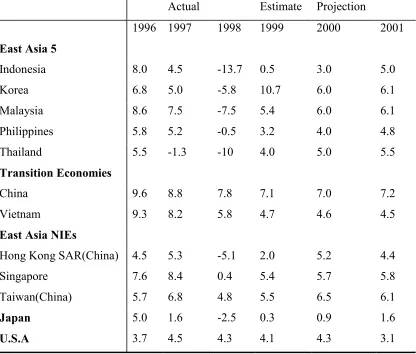
Table 1
East Asia’s performance…and prospects brighten…
Real GDP percent change
Actual Estimate Projection
1996 1997 1998 1999 2000 2001
East Asia 5
Indonesia 8.0 4.5 -13.7 0.5 3.0 5.0
Korea 6.8 5.0 -5.8 10.7 6.0 6.1
Malaysia 8.6 7.5 -7.5 5.4 6.0 6.1 Philippines 5.8 5.2 -0.5 3.2 4.0 4.8 Thailand 5.5 -1.3 -10 4.0 5.0 5.5
Transition Economies
China 9.6 8.8 7.8 7.1 7.0 7.2
Vietnam 9.3 8.2 5.8 4.7 4.6 4.5
East Asia NIEs
Hong Kong SAR(China) 4.5 5.3 -5.1 2.0 5.2 4.4
Singapore 7.6 8.4 0.4 5.4 5.7 5.8
Taiwan(China) 5.7 6.8 4.8 5.5 6.5 6.1
Japan 5.0 1.6 -2.5 0.3 0.9 1.6
U.S.A 3.7 4.5 4.3 4.1 4.3 3.1
2.2 The impact of the Asian economic crisis on Trade
The Asian economic crisis caused a huge imbalance of trade in East Asian countries particular, financial crisis countries. These countries export to the US and European countries more than import.
2.2.1 Trade development in Asia
The Asian crisis resulted in stagnation in Asia’s economic output for the first time since World War II. Japan’s GDP and EA-5 countries decreased for the first time in more than 25 years, and for some countries in the region the decline was similar to that experienced by the industrial countries during the Great Depression in the 1930s. Hongkong, China and Singapore also did not escape the Asian financial crisis.
Japan’s sluggish economy and the Asian financial crisis caused the percent of Asia’s merchandise imports to decline in 1998 by 18 percent by value and 14 percent by volume (see Table 2 Trade developments in Asia, 1996-98). Imports from North America and Western Europe declined by less than the average, while imports from regions that export mainly primary products to Asia, such as Latin America, Africa, and the Middle East, decreased by more than one quarter. Asian merchandise exports decreased by nearly 12 percent by value and 10 percent by volume in 1998 due to the sharp contraction of intra-Asian trade.
Japan declined in volume of merchandise imports by 7 percent and exports 14 percent. EA-5 also sharply declined in volume of merchandise imports to nearly 25 percent and 10 percent in exports, which caused an imbalance of trade with Western Europe and North America.
value by 20 percent and 13 percent respectively (World Trade Organization Annual Report [WTO], 1999).
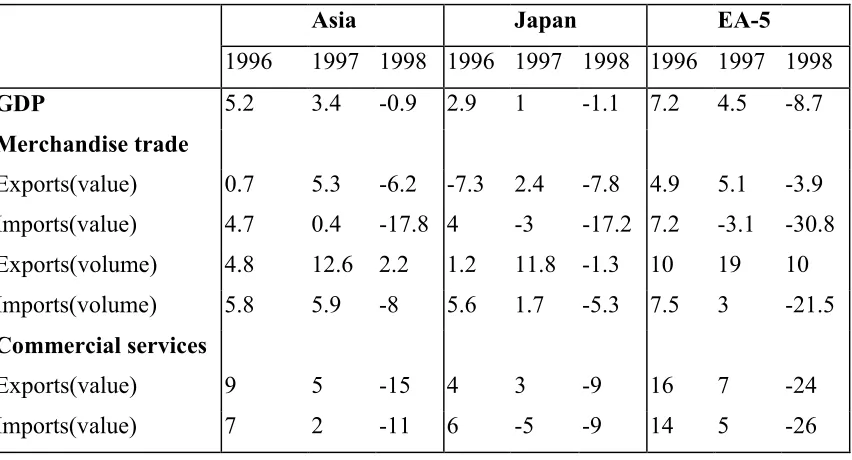
Table 2
Trade developments in Asia, 1996-98
Asia Japan EA-5
1996 1997 1998 1996 1997 1998 1996 1997 1998
GDP 5.2 3.4 -0.9 2.9 1 -1.1 7.2 4.5 -8.7
Merchandise trade
Exports(value) 0.7 5.3 -6.2 -7.3 2.4 -7.8 4.9 5.1 -3.9 Imports(value) 4.7 0.4 -17.8 4 -3 -17.2 7.2 -3.1 -30.8 Exports(volume) 4.8 12.6 2.2 1.2 11.8 -1.3 10 19 10 Imports(volume) 5.8 5.9 -8 5.6 1.7 -5.3 7.5 3 -21.5
Commercial services
Exports(value) 9 5 -15 4 3 -9 16 7 -24 Imports(value) 7 2 -11 6 -5 -9 14 5 -26
Source: World Trade Organization Annual Report 1999.
2.2.2 Imbalance trade
Imbalance trade seems to impact with East Asian countries particular, EA-5 countries more than a global.
2.2.2.1 World merchandise trade by region
a share of 43.8 in 1993 and 44.5. North America exported with a share of 16.8 in 1993 and 17. Latin America, Africa and the Middle East had export shares of less than 5 in 1993 and 1998.
Table 3
World merchandise trade by region in 1993 and 1998
1993 1998 1993 1998 Exports Imports
value
World 3636 5270 3744 5465
share
World 100 100 100 100
North America 16.8 17 19.9 21.1 Latin America 4.4 5.2 5 6.2 Western Europe 43.8 44.5 42.9 43.3
Africa 2.5 2 2.6 2.4
Middle East 3.4 2.6 3.2 2.6
Asia 26.3 24.5 23.5 19.9
Source: World Trade Organization Annual Report 1999
The Asian economic crisis also caused the Asia Merchandise trade import share to decline from 23.5 in 1993 to 20 in 1998. Western Europe, also, was the largest imports merchandise trade in the world with a share of 43 in 1993 and 1998. North America increased its import share from 19.9 in 1993 to 21.1 in 1998, and was the second largest import region replacing Asia in 1998. Latin America, Africa, and Middle East had import shares of less than 5 in 1993 and 1998.
2.2.2.2 Asia imbalance trade
percentage change increased from 5 % in 1996 to 12 % in 1997 and decreased to 2 % in 1998 (see Figure 2 Asia imbalance trade in volume, 1996-98).
Source: World Trade Organization Annual Report 1999
Figure 2
2.2.2.3 Financial crisis countries Imbalance trade
The Asian economic crisis caused more imbalances in trade in EA-5 countries than Asia. Figure 3 shows that the Annual percentage change in volume imports of EA-5 countries declined from 7.4% in 1996 to 3.3% in 1997 and –21.5% in 1998. On the other hand, the Annual percentage change in volume export of EA-5 countries increased from 9.9% in 1996 to 16.0 % in 1997 and 10.1% in 1998.
.
Asia Imbalance trade in volume, 1996-98
-10 -5 0 5 10 15
1996 1997 1998
Year
A
nnual
percent
age change
Exporters Volume
Importers Volume
Source: World Trade Organization Annual Report 1999
Figure 3
2.3
Correlation between Asia economic and Trade development
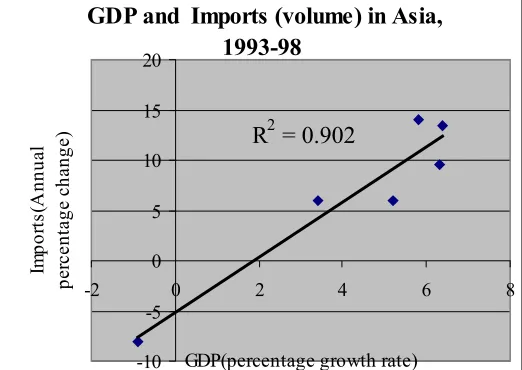
The correlation values between the Asian economic and import/export trade development in 1993- 98 almost go in the same direction of change. When the Asian economy went very sharply in recession in 1998, the GDP declined nearly 5% and both imports/exports declined in the same way. Import volume declined 14% and export volume declined 10%, see Table 4 Asia’s GDP and import/export in volume, 1993-98. From Table 4, the Annual percentage change in import/export volume shows that the imbalance in trade started to begin by 1% in 1996, 6% in 1997, and 10% in 1998
EA-5 countries imbalance trade in volume, 1996-98
-25 -20 -15 -10 -5 0 5 10 15 20
1996 1997 1998
Year
Annua
l percenta
ge
cha
n
ge
Table 4
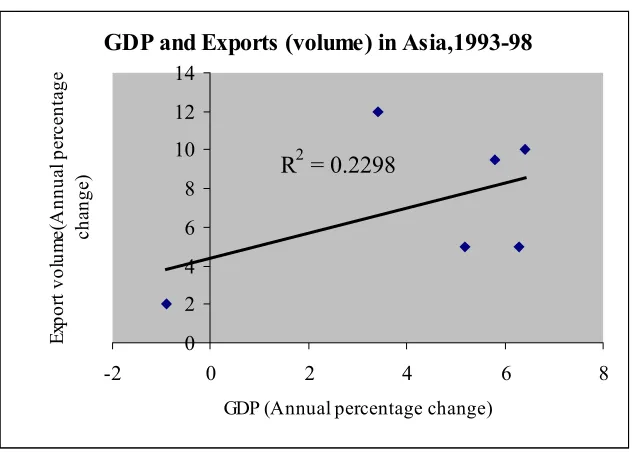
Asia’s GDP and Import/Export in volume, 1993-98
Annual
%change 1993 1994 1995 1996 1997 1998 GDP 6.3 6.4 5.8 5.2 3.4 -0.9 Import 9.5 13.5 14 6 6 -8
Export 5 10 9.5 5 12 2
Source: World Trade Organization Annual Report 1999
The regression and correlation analysis method shows that the relationship values between GDP and import volume in table 4 are very close and more confident values. When GDP go down, import volume will go down and GDP go up, the import volume will go up in the same way. Figure 4 shows that the correlation of the two parameters is depend on each other by 95% or correlation Coefficient (r) = 0.95. However, the relationship values between GDP and export volume in table 4 are less close and confident. Figure 5 shows that the correlation of two parameters is depend on each other by only 48% or correlation Coefficient (r) = 0.48.
Source: compiled data based on World Trade Organization Annual Report 1999
Figure 4
GDP and Imports (volume) in Asia, 1993-98
R2 = 0.902
-10 -5 0 5 10 15 20
-2 0 2 4 6 8
GDP(percentage growth rate)
Source: compiled data based on World Trade Organization Annual Report 1999
Figure 5
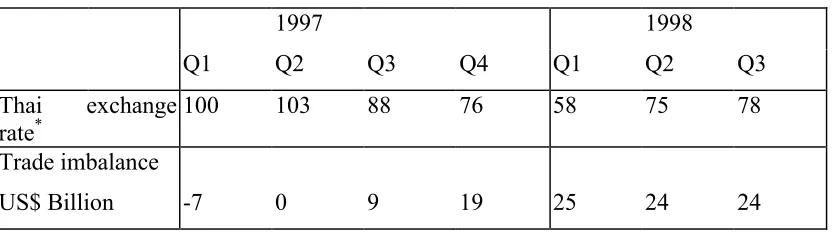
The significant variable that makes the relationship between GDP and export volume to less in their relationships is the exchange currency rate. In mid year 1997, EA 5 countries devalued their currencies by nearly 40% except Indonesia in which devalued its by more than 60% (J.P. Morgan). The consequence of a devaluation of money was a rise in net exports and producing a huge trade surplus. Table 5 and Figure 6 show the correlation values between the index of Thailand exchange rate/US dollar and trade imbalance in US$ billions for the EA-5 countries. The data in Table 5 shows that in Q1 of 1998, Thailand devalued the Thai Baht by 42 % and the trade imbalance in EA-5 countries increased to 25 US$ billion in which exports was larger than imports. The regression and correlation analysis method shows that the correlation between the Thai exchange currency rate and trade imbalance in EA-5 countries is very close and more confidence value with the Correlation Coefficient (r) = 0.91 or the two parameters are depend on each other by 91%.
GDP and Exports (volume) in Asia,1993-98
R2 = 0.2298
0 2 4 6 8 10 12 14
-2 0 2 4 6 8
GDP (Annual percentage change)
Table 5
Thai exchange currency rate and trade imbalance in EA-5 countries
1997 1998
Q1 Q2 Q3 Q4 Q1 Q2 Q3
Thai exchange
rate* 100 103 88 76 58 75 78
Trade imbalance
US$ Billion -7 0 9 19 25 24 24
January 1997 = 100, Source J.P. Morgan.
Source: World Trade Organization Annual Report 1999
January 1997 = 100, Source J.P. Morgan.
Source: World Trade Organization Annual Report 1999
Figure 6
Thai Exchange Rate and Imbalance Trade in East Asia economic crisis countries
R2 = 0.8208
-10 0 10 20 30 40
0 20 40 60 80 100 120
Thai Exchange Rates*(January 1997=100)
Im
ba
la
nc
e T
ra
de
(U
S$
B
illi
on
Chapter 3
The impact on Regional Container Lines
Chapter 2 has already explained and analyzed the impact of the Asian economic crisis which caused the rise in the imbalance in trade where exports from Asia were greater than imports to Asia. This chapter will identify the impact of the imbalance in trade to the Regional Container Lines (RCL), the feeder operating the main route between Thailand/Singapore.
3.1 Regional Container Lines (RCL) fleet and operation
Regional Container Lines (RCL) is one of the largest and best known of the common-user feeder companies operating in Asia, particularly on the Thailand and Singapore trade routes. RCL operated the first feeder containership in 1979 between Bangkok and Singapore and increased and expanded its feeder services and container liner business in intra-Asia. Currently the Bangkok-listed, but Singapore-operated, carrier offers service to 17 countries (78 destinations) with a fleet of 35 ships, including four time-chartered units, aggregating almost 30,000 TEU. According to Containerisation International’s Liner Shipping Network data, this makes it the 38th largest container carrying line in the world. Its Annual lifting amass is 1.4 millions TEU.
Sri Lanka, Taiwan, Thailand and Vietnam (Regional Container Lines [RCL], 20th Anniversary).
RCL fleet size ranges from 600 TEUs to 1500 TEUs with registries both in Thailand and Singapore. Since 1990, RCL’s policy has been to phase new ships into service approximately every one/two years (RCL, 20th Anniversary).
RCL has deployed 9 vessels, with an aggregate of almost 8,000 TEUs or 30 % of the RCL total fleet. Its fleet size on this route ranges from 600 TEUs to 1100 TEUs and the fleets average age is 10 years (see Table 6 RCL’s containership fleet in Thailand and Singapore).
Table 6
RCL’ s containership fleet in Thailand and Singapore
Vessel name TEU Reefer slot Year of build
Deployment
Anan Bhum 1018 100 1995 Singapore/Thailand Lila Bhum 740 100 1997 Singapore/Thailand Mathu Bhum 1080 100 1990 Singapore/Thailand Nanta Bhum 1080 100 1990 Singapore/Thailand
Ratha Bhum 628 60 1998 Singapore/Cambodia/Thailand Siri Bhum 540 60 1980 Singapore/Cambodia/Thailand/
Malaysia
Vira Bhum 504 30 1974 Singapore/Malaysia/Thailand Xetha Bhum 1080 60 1993 Singapore/Thailand
Yantra Bhum 1080 60 1993 Singapore/Thailand
RCL operates 6 feeder routes from Singapore/Thailand/Singapore in different frequencies such as one trip per week, two trips per week, three trips per week, or four trips per week. The total of carrying capacity is 16,000 TEUs per week (see Table 7 RCL’ s Feeder service network in Thailand and Singapore).
Table 7
RCL’ s feeder service network in Thailand and Singapore
Route Frequency Capacity Ports of call
Singapore/Thailand/ Singapore
Four a week 4*1000 Singapore, Bangkok (KlongToey), Singapore Singapore/Thailand/
Singapore
Two a week 2*1080 Singapore, Bangkok(Thai Prosperity Terminal),Singapore Singapore/Thailand/
Singapore
Four a week/ Three a week
4*570/ 1,000
Singapore, Laem Chabang, Singapore
Singapore/Thailand/ Singapore
Weekly 1*1018 Singapore, Bangkok(Siam Bangkok Port), Singapore Singapore/Thailand/
Singapore
Weekly 1*1080 Singapore, Map Ta Phut, Singapore
Singapore/Thailand Three a week 3*504/ 540/628
Singapore, Songkhla, Singapore
Source: RCL, 20th Anniversary
3.2 The impact of the Asian economic crisis on container movements
Europe trade in 1998. The imbalance trade of container movements between South East Asia and US is also very high with a 135% growth rate in 1998 and 30% growth rate in 1997.
3.2.1 Asian container movements
The Asian container movement seems to be very serious in imbalance trade as a result of the impact of the Asian economic crisis, particularly on the transpacific routes. Cargo movements from Asia to the United States increased from 4,1 mil TEUs in 1996 to 5,2 mil TEUs in 1998, but on the other hand trade, decreased from 3,5 mil TEUs to 3,3 mil TEUs. This caused an imbalance in cargo movements between the eastbound and the westbound trade routes from 584 thousand ofTEUs in 1996 to 1,9 mil TEUs in 1998 or almost 80% of the growth rate in both 1997 and 1998; it is estimated to be 2,5 mil TEUs in 2000 (see Table 8 Asian container movements). The imbalance of container movements on Asia – Europe trade routes, also increased from 558 thousand TEUs in 1996 to 777 thousand TEUs in 1998 or almost 40% of the growth rate in 1998 and an estimated 911,000 TEUs in 2000.
3.2.2 South East Asian container movements
Table 8
Asian container movements
(Thousands of TEUs)
Year Asia-USA
Asia-Europe Asia
-USA USA -Asia Imbalance %change Asia-Europe Europe-Asia Imbalance %change 1996 4104 3520 584 3142 2584 558
1997 4662 3615 1047 79.3 3290 2734 556 -0.4 1998 5221 3326 1895 81.0 3487 2710 777 39.7 1999 5466 3266 2200 16.1 3633 2713 920 18.4 2000 5838 3328 2510 14.1 3811 2900 911 -1.0
Sources: UNCTAD secretariat on the basis of data supplied by the Japan Maritime Research Institute; DRI/McGraw-Hill, World Sea Trade Service Review, various issues; Containerisation International, various issues, and other specialized sources. * Forecasts for 1999 and 2000.
Note: European trades do not include the Mediterranean.
Table 9
Intra-Asia containerised traffic moving to/from South East Asia*
(Thousands of TEUs)
1997 1998 1999 Imports
From Japan 565 454 435 From NIC 530 530 565 From China 325 310 336 Total 1420 1294 1336
Exports
To Japan 374 341 323
To NIC 630 649 667
to China 231 237 240 Total 1235 1227 1230
Imbalance Trade -185 -67 -106
Table 10 shows that the imbalance of container movement was increased from 175
thousand TEUs in 1996 to 531 thousand TEUs in 1998 or 30% growth rate in 1997 and 135% growth rate in 1998. Consequently, the Asian economic crisis caused an imbalance trade in container movements between South East Asia and the United States which was more than Intra Asia.
Table 10
South East Asia and US container movements, 1996-98
(Thousands TEUs)
1996 1997 1998 US - South East Asia 545 566 400 South East Asia - US 720 792 931 Imbalance 175 226 531
% change 29.1 135.0
Source: PIERS/Journal of Commerce (New York)
3.3 The impact of the Asian economic crisis on RCL
The Asian economic crisis caused a huge number of empty container movements on RCL, particularly in major trade route between Singapore and Thailand. In 1998, RCL had to carry the empty container movements almost 20,000 empty container boxes or 26% of the empty/total container movements. This increased from 16,451 empty container boxes or 18% of the empty/total container movements in 1996, before the Asian economic crisis. Therefore, the empty container movements caused a high repositioning cost for RCL in 1998, estimated to be 223 mil Baht or almost 2.5% of the total expense.
three consecutive months of trade surplus after 1997 of trade deficits (see ‘Leading owners report major impact of economic troubles on ports and lines’, Lloyd’s list, February 26, 1998, p.16).
Chan Tuck Hoi, executive vice-president of the RCL group, explains: ‘Inbound cargo volumes into South East Asia declined significantly and container imbalance became more acute with the result that over capacity plagued all operators during the year,’ he said. ‘This resulted in revenues being eroded and costs being increased’ (RCL, 20th Anniversary).
As Lloyd’s list reported, a company such as RCL, which is widely regarded as one of the strongest Asean intra-Asian trade feeder operators, has seen import cargoes to Indonesia, Thailand, and Malaysia shrink to levels not seen for years, but with containerised export cargoes, the picture is somewhat different. RCL, Samudra, WanHai Lines and other intra-Asian containership operators, are all reporting increased loading for cargoes out of ports such as Laem Chabang in Thailand, Port Klang in Malaysia, and various container-handling facilities across Indonesia. The weakness of the local currencies has been a temporary boon to exporters who now have a distinct advantage with cheaper goods bound for the major US and European markets (see ‘Box trades recovery under way’, Lloyd’s List, December 1999, p.11).
3.3.1 RCL empty container movements
(See Figure 7 RCL container movement inward to Thailand). This figure was compiled from data in Thailand Shipping Statistics 1996 and 1998, Office of the Maritime Promotion Commission, Ministry of Transport and Communications.
Source: compiled with data from Thailand Shipping Statistics 1994 – 1998.
Figure 7 RCL container movements inward to Thailand
Since Singapore is the hub port in the SouthEast Asia region, RCL moves container cargo from South East Asia countries to Singapore port in order to carry it via the main liner operators in the Transpacific and Asia – Europe trade routes.
During the Asian economic crisis, containers loaded in Thailand increased from 1,041 thousand TEUs in 1996 to 1,300 thousand TEUs in 1998 but containers discharged in Thailand decreased, in the opposite direction, from 963 thousand TEUs
in 1996 to 779 thousand TEUs in 1998. Consequently, it caused a rise in imbalance container movements from 78 thousand TEUs in 1996 to 521 thousand TEUs in 1998 (see Figure 8 containers loaded and discharged in Thailand). This seems to result in big trouble for container lines inward to Thailand with empty container movements. RCL also had a bad situation just like the other container lines.
Singapore 90% Other
10%
1996
Singapore 91% Others
9%
Source: compiled with data from ISL, Shipping Statistics Yearbook, 1999.
Figure 8
The empty container movements inward to Thailand was very high during the Asian economic crisis. It increased from 21,981 boxes (22% of empty/total) in 1996 to 25,003 boxes (30% of empty/total) in 1998 or increased by 14% from 1996 to 1998, particularly on the Singapore - Thailand feeder trade route. The empty container movements on the Singapore – Thailand trade route increased from 16,451 boxes (18% of empty/total) in 1996 to 19,954 boxes (26% of empty/total) in 1998 or increase by 22% from 1996 to 1998. Total container movements were reduced from 90,736 boxes in 1996 to 77,259 boxes in 1998, a reduction of 15%. On the other hand, there were almost no RCL empty container movements outward from Thailand (see Figure 9 and Figure 10 the movements of containers carried by RCL inward and outward to/from Thailand).
Containers loaded and discharged in Thailand (in thousand TEUs)
0 200 400 600 800 1000 1200 1400
1993 1994 1995 1996 1997 1998 Year
Thousa
nd of
TEUs
Source: compiled with data from Thailand Shipping Statistics 1994 – 1998.
Figure 9
Source: compiled with data from Thailand Shipping Statistics 1994 – 1998.
Figure 10
RCL container movements inward to Thailand in 1996 and 1998
0 20 40 60 80 100 Loade d 96 Empty 96 Load ed 98
emp ty 98
country T h ou san d of b oxe s Total Other Singapore
RCL container movements outward from Thailand in 1996 and 1998
0 20 40 60 80 100 Total Sing
3.3.2 Repositioning cost
The empty container movement from Singapore to Thailand as already discussed above, caused RCL to pay higher expenses for repositioning costs. It is estimated that the repositioning cost increased from 156.8 mil Baht in 1996 to 222.88 mil Baht in 1998 an increase of 66.7 mil Baht or 43% (see Figure 11 Repositioning cost in 1996 and 1998). The higher repositioning cost was almost 2.5% of RCL’s total expense in 1998.
This figure was compiled by data from Thailand Shipping Statistics 1996 and 1998, Office of the Maritime Promotion Commission, Ministry of Transport and Communications, based on the freight rate Singapore/Thailand. The basic freight rate of a 20-ft container was 4,730 Baht in 1996 and 7,470 Baht in 1998, and for a 40-ft container it was 9,890 Baht in 1996 and 12,490 Baht in 1998. The additional charges which included Bunker Adjustment Factor (BAF), Currency Adjustment Factor (CAF), Terminal Handling Charge (THC), Container Yard Charge or CY charge and Container Freight Station Charge or CFS charge, was 53.04% of the basic freight rate in 1996, and 10.59% of the basic freight rate in 1998.
Source: compiled data from Thailand Shipping Statistics 1996 and 1998, Office of the Maritime Promotion Commission, Ministry of Transport and Communications.
Figure 11
Table 11
RCL year record (in millions of Baht)
1996 1997 1998
Total revenues 7,066 9,552 10,542 Total Expenses 6,356 10,321 10,251 Pre-tax profit/loss 710 -770 291 Net profit 706 -1,109 285 Earnings/loss per share 31.95 -31.16 4.51 Total shareholders
equity 4,982 4,923 5,012 Total assets 14,081 23,752 19,555
Source: RCL Group
Repositioning cost in 1996 and 1998
0 5000 10000 15000 20000 25000
1996 1998 Year
B
oxes
0.00 50.00 100.00 150.00 200.00 250.00
M
il Ba
ht Empty container
(Boxes)
However for the worst situation, RCL has been doing better than other lines because it has emerged as a stronger and fitter company. According to Chan Tuck Hoi, executive vice-president of RCL, “RCL took immediate action to deal with the harsher and new operating environment created by the Asian currency crisis and that the company was now fitter and trimmer to take advantage of new opportunities and expand the service network”.
According to Kua Phek Long, chairman of RCL, this action included hedging the company’s foreign currency exposure, thereby avoiding the worst effects of the slide in the value of the local Thai baht and Singapore dollar against the US dollar. In addition to the usual controls being placed on salaries, fleet operating costs and administrative expenses, the chairman highlighted the company’s investments in improving its telecommunications and data management systems and training programs. In particular, this consisted of improved data processing in the areas of container booking, preparation of shipping documents, container control and terminal operations, as well as integration of marketing information with clients’ databases for enhanced service (RCL, 20th Anniversary).
Source: complied with data from Containerisation International Yearbook data, and Thailand Shipping Statistics 1994 – 1998.
Figure 12
Empty/Total container movements
0 5 10 15 20 25 30
1994 1996 1998
Year
% World
Thailand
Chapter 4
Repositioning solution
Chapters 2 and 3 have already explained and analyzed the Asian economic crisis which caused the huge imbalance on trade between Asia - North America, and Asia – Europe. Imbalance trade between these areas resulted in many container liners and feeder operations getting in to trouble since they had to move empty containers to where there was a shortage and had to pay extra expense for the repositioning cost. RCL also has a problem with empty container movements as do other liner.
This chapter will generate a possible repositioning solution for RCL to solve the problem of empty containers on the Singapore and Thailand feeder routes and use cost/benefit analysis to find the best solution.
4.1 Associated Empty Containers.
RCL solved the empty container movement problem by joining the Associated Empty Container which is the group of Main Line Operations (MLOs) and fellow feeder carriers carried container on the South East Asia trade routes and faced with the same problem of empty container movements after the Asian economic crisis. The associated members include the Malaysian International Shipping Corp (MISC), American President Lines (NOL/APL), Maersk, Orient Overseas Container Lines (OOCL), Advance Container Lines, Pacific Eagle Lines and Gemartrans.
As Chalermkiat T. Paiboon, Asst. Regional Marketing Manager of RCL, June 2000, confirms empty positioning from Singapore is still going on today just like what was happening 10 years ago. Currently, the cost of empty positioning is around US $.180-210 per 20ft container and US $330-370 per 40ft container. However, many shipping lines are now trying to solve this problem by offering very low rates. Presently freight rates for laden containers is around US$.50 /teu plus THC in Thailand. Chalermkiat stresses that with the emergence of Port Klang, now many lines start to move to Malaysia because of cheaper port operation costs compared with Singapore. In this way, many lines have their empty stock at Port Klang and they sometimes move their empties by rail from Port Klang direct to Bangkok and Lad Krabang (container depot ICD, 25 km east of Bangkok) with low cost (approximate US$. 150/teu) but small volume. Normally the maximum capacity of a train is 30 teus per trip and no space guaranteed by the rail operator. In case they can solicit a laden box, they will remove empties due to better pay.
The associated empty equipment repositioning on behalf of the MLOs and fellow feeder carriers seems to be a good solution at this time because RCL can save repositioning costs of around US$.130-160 per 20ft container and US$280-320 per 40 ft container. To move empty containers by rail from Port Klang directly to Bangkok and Lad Krabang, RCL can save repositioning costs of only US$30-60 per 20ft container and US$180-220 per 40ft container excluding expense from Singapore to Malaysia. So, the benefit of saving empty container movement cost by rail is less than the associated empty equipment repositioning on behalf of the MLOs and fellow feeder carriers.
Assuming the empty container movement decreased from 1998 with an average growth rate of 5% per annum because of increase in the Thai GDP as already discussed in chapter 2 and 3. RCL will save repositioning costs of around 376-439 thousand US$ in 2000, if their empty containers were carried by MLOs and fellow feeder carriers only 10% of the total empty container movements. If RCL can join the Associated Empty Container to 50%, RCL will save repositioning costs of around 1.9-2.2 mil US$ (see Table 12 Associated empty container saving costs).
Table 12
Associated empty container saving costs in 2000
Possible joining 10% 20% 30% 40% 50% Empty container 20ft
(Boxes) 857 1715 2572 3430 4287
Empty container 40ft (Boxes)
943 1887 2830 3774 4717
Repositioning saving costs
(thousand US$)
376-439 751-878 1127-1317 1503-1756 1878-2195
Source: compiled data from Thailand shipping statistics 1998 (office of The Maritime Promotion Commission, Ministry of Transport and Communication) and RCL group.
this route. The empty container lines will get a benefit from a lower repositioning cost, as already discussed above, and the shipping lines that offer to carry empty containers will get a benefit from better utilization in their load factor.
RCL do not have to pay a fee to a broker for finding other shipping lines to carry empty containers from Singapore to Thailand in order to reduce repositioning costs. In the case of Internet packages such as InterBox, SynchroNet or Greybox to provide information for matching interchange equipment, RCL have to pay fee for each matching equipment as will be discussed later.
However there is no guarantee that this solution will be good in the long term, since shipping lines will not be happy to carry empty containers, with low revenue when the market is good. They want to carry loaded boxes with higher revenue. As Chan said, “Although the movement of empty containers on behalf of MLOs pays less than loaded boxes, RCL’s lean cost base means that a marginal rate of return is still manageable on this traffic”. In the Longer – term though, the company has seen an equalisation process taking place in the price paid by MLOs for the relay of empty and loaded feeder boxes as making a further positive contribution to the company’s fiscal performance.
4.2 InterBox solution
InterBox is an on-line marketplace, accessible via the Internet, where shipping lines, leasing companies, and other container users can trade container availability to reduce operating costs by increasing container logistics efficiency. On the InterBox exchange, members post or search for offers that meet their needs (deficit or surplus), then create binding contracts to interchange equipment, leased container, or empty moves transaction. (http://www.Interbox.com).
containers. The secure system enables members to control with whom they do business by setting their own priority status of fellow members and rigorous contracting disciplines are a key to the Interbox regime. Members provide details of their surplus and demand locations, and, once logged on, other members registering a reciprocal matching requirement can activate a contact within moments (Tim Power, VP of marketing IAS, 1999).
The benefit of InterBox to RCL is as follows. Firstly, RCL will get a benefit from the open wide range of container owners and operators comprising deep-sea lines; leasing companies; regional, short sea and cabotage operators; and domestic Intermodal carriers. InterBox covers both global and regional markets, including positioning requirements within the US and intra Asian markets. The major users are CMA-CGM Group, HLX-Hub Group, Hapag-Lloyd, Hamburg Sud, Matson Intermodal, Mitsui OSK Lines, Mark VII Transport, OT Africa Line, P&O Nedlloyd, Riss Intermodal, Sea-Land (Domestic), Triton and Textainer (IAS, 1999). So, it is a good opportunity for RCL to find matching equipment with other variety members.
for RCL because it can use a wide open range market to respond to their need. Therefore, RCL has already invested heavily in new equipment and IT system in the beginning of 2000, so it can use InterBox to improve utilization in the IT system to get opportunities and marketplace via the Web. As Tanthuwanit Sumate, president of the RCL Group, (1999) says “RCL has made investment in developing an e-commerce customer service called ‘BHUM’ net”. To use InterBox connect via the Web is very simple. As Blair, (2000) says all that is needed is a computer connected to the internet and a password – no client server software is necessary to install as in the case of some competitors. InterBox also enables a user control order/bid process, which ensures that the economics of any transaction are driven to the natural market level, giving both the container supplier and receiver the best possible deal.
Thirdly, InterBox can save repositioning costs for RCL through IAS which generates its revenue on the basis of successful transactions. It charges around US$20 for each particular deal. A ‘nominal’ monthly access fee is also applicable for use of the exchange database (Timothy J Power, vice president of IAS). The pricing of moving containers depends on an agreement between InterBox and its members. The system allows for on-line offer/counter offer negotiation, so, it is purely dependent on the market (Blair Peterson, Commercial vice president of IAS)
leased containers 10% of the total empty container movement and 2.1-2.4 mil US$ for leased containers 50% (see table 13 A leased container). In the case of RCL using empty moves transaction, it has to pay a fee of US$ 20 for each box and negotiate a price of empty moves with other lines, currently around US$50/box. RCL will save repositioning costs of around 339-403 thousand US$ for 10% of the total empty container movement and 1.7-2 mil US$ for 50% (see table 13 B Empty moves transaction). In the case of RCL using execute interchange program with other lines. RCL will save repositioning costs of around 429-493 thousand US$ for 10% of the total empty container movement and 2.2-2.5 mil US$ at 50%(see Table 13 C Execute interchange program).
Table 13
Repositioning saving costs with InterBox in 2000
A. Leased container
Possible Leasing 10% 20% 30% 40% 50% Leased container 20ft/year
(Boxes)
857 1715 2572 3430 4287
Leased container 40ft/year (Boxes)
943 1887 2830 3774 4717
Fee charge 20US$/container (Thousand US$)
36 72 108 144 180
Leased container costs (Thousand US$)
13 26 39 53 66
Repositioning saving costs
B Empty moves transaction Possible empty move
transaction
10% 20% 30% 40% 50%
Empty container 20ft (Boxes)
857 1715 2572 3430 4287
Empty container 40ft
(Boxes) 943 1887 2830 3774 4717
Fee charge 20US$/Boxes (Thousand US$)
36 72 108 144 180
Empty moves transaction
(Thousand US$) 90 180 270 360 450
Repositioning saving costs (thousand US$)
339-403 679-806 1019-1209 1359-1612 1698-2015
C. Execute Interchange program
Possible Interchange 10% 20% 30% 40% 50% Empty container 20ft
(Boxes) 857 1715 2572 3430 4287
Empty container40ft (Boxes)
943 1887 2830 3774 4717
Fee charge (20US$)/boxes
(Thousand US$) 36 72 108 144 180
Reposition saving costs
(thousand US$) 429-493 859-986 1289-1479 1719-1973 2148-2465 Source: compiled data from Thailand shipping statistics 1998 (office of The Maritime Promotion Commission, Ministry of Transport and Communication), RCL and InterBox information.
4.3 SynchroNet solution
Founded in 1996, SynchroNet Marine, Inc. the premier business-to-business container exchange, delivers solutions that use innovative and database technology to help carriers reduce the costs of empty positioning and the need for box leases
(http://www.synchronetmarine.com). SynchroNet’s secure and neutral on-line
SynchroNet offering comprises three distinct services, International Service, AsiaMax and US overland, (see ‘The SynchroNet solution’, container Management Supplement, March 2000, P.S6-S10).
The heart of the SynchroNet advantage is the Cooperative Access System TM (CAS), a sophisticated, highly secure database engine developed by SynchroNet. This engine is used to regularly combine and analyze confidential container flow and imbalance data from different international carriers to recognize every opportunity for controlled cooperation that exists among potential partners. SynchroNet’s CAS software connects users to their own segments of a dynamic, real-time system to review, select and manage high volumes of controlled container exchange among a broad range of partners (http://www.synchronetmarine.com).
SynchroNet is acting as a facilitator, the ‘deal’ itself is actually between the two carriers directly. It has 35 international shipping lines involved, which together represent 40% of the world’s fleet. Mark Kadar, vice president of Mercer Management Consulting feels that SynchroNet is offering a more distinctive system than its competitors because it is not just posting bulletin-board information. It is receiving data, analysing it and reporting back to the carriers where their problems actually are (see ‘Synchro-savings’, Containerisation International, August 1999, P.65-67).
movements, RCL will save repositioning costs of around 412-475 thousand US$. In the case of RCL can exchange container with its members at 50%, they will save repositioning costs of around 2.1-2.4 mil US$.
Secondly, RCL will gain from the interchange of equipment with other lines through Internet with a simple connection. It is easy to get started with BHUM net in which RCL have already invested in the beginning of 2000, as already discussed above. SynchroNet need only an Internet connection and email facility (Container Management Supplement, March 2000, p. S6). So, RCL can use SynchroNet for added value with their IT network system. With the data pooling technology of SynchroNet, RCL can view all potential available interchange opportunities.
In 1999, SynchroNet through its client server database provided a relational database (SQL) that matched over 85 thousand containers globally, giving an industry saving of over US$ 25 mil (Ron, June 2000).
Table 14
Repositioning saving costs with SynchroNet in 2000
Possible Interchange 10% 20% 30% 40% 50% Empty container 20ft
(Boxes)
857 1715 2572 3430 4287
Empty container 40ft (Boxes)
943 1887 2830 3774 4717
Fee charge (US$30)/Boxes (thousand US$)
54 108 162 216 270
Repositioning saving costs (thousand US$)
412-475 823-950 1235-1425 1647-1900 2058-2376
Source: compiled data from Thailand Shipping Statistics 1998 (office of The Maritime Promotion Commission, Ministry of Transport and Communication), RCL and SynchroNet information.
best protocol with multiple partners and multiple opportunities visible at 100% of the time (Ron, June 2000). In the case of RCL having a surplus in Singapore, and a deficit in Bangkok, at the same time, the CAS will recognise a surplus and deficit of RCL and the system also recognises that Maersk has a need of equipment in Singapore and their routes via Bangkok. In this case, both companies would select the deal because it would save RCL from having to empty position these units to Bangkok, while Maersk could secure the necessary containers to move cargo to Bangkok, thus avoiding the probability of positioning or leasing units in Singapore. SynchroNet is also quick to respond. In such a case where RCL wants to cancel the agreed booking, RCL can cancel the selected deal and indicate the reason in the “If Cancelled, please provide reason below”. The CAS imbalance field for Singapore would then change automatically.
Fourthly, RCL will gain by interchanging its equipment with other lines through SynchroNet in which it has 35 international shipping lines involved, which together represent 40% of the world’s fleet (Stig Sevaldsen, VP of SynchroNet Marine, 1999). SynchroNet’ s aim is to develop the product as a trading system effectively operated by the shipping lines themselves. It should be noted that Interbox and Greybox provide a great value service to a leasing company’s customer.
Nonetheless, SynchroNet seems to be useful for deep-sea operators more than short sea. The SynchroNet concept is to balance the correction of both the origin and destination imbalance without empty position (http://www.synchronetmarine.com). Since the Asian economy causes container lines carry its empty container only in one direction from Singapore to Thailand, so, it is difficult to interchange equipment in order to balance both Singapore and Thailand. Anyway SynchroNet is one that provides email to solve the complicated repositioning.
RCL gets a container from Maersk line from Singapore to Bangkok, Maersk line can reduce its reposition cost, but RCL shall encounter a container deficit in Bangkok immediately because there will be no RCL’s container flow into Thailand. Ron Fuentes says, however, that all units are tracked by SynchroNet, all units are 100% contracted to be back to the customer in a fixed time period as well as cost and penalties if lost or damaged.
4.4 Greybox solution
Greybox provides to all shipping lines a computerized trading environment via its electronic Bulletin Board offering a secure and neutral brokerage service. This service proactively assists members in identifying interchange opportunities with its unique matchmaking capability. Greybox co-ordinates all terms and conditions of Membership via an addendum to Transamerica Leasing ’s master lease contract which regulates the terms and conditions for Members, as both suppliers and users of Greybox interchanges. The Greybox service also includes a comprehensive tracking and billing administration (http://www.tradexonline.com).
match available vessel space (slots) with the need to position empty containers with members.
Secondly, RCL will gain from the fully managed administrative process of GLS’s network. As Paul Crinks, 1999, VP of GLS says the company’s ability to fully manage the administrative process is extremely important. “Once the match between clients has been made it is seamless for them as we did the tracking, invoicing, collection, etc, and delivery to the contributing line’s preferred drop-off point. GLS’s network of dedicated service centres has also been expanded, the company functioning out of eight offices located in New York, Chicago, London, Singapore, Hong kong, Auckland, Brisbane and Sydney. Currently, a team of 20 persons is dedicated to the company’s activities worldwide” (see ‘Greybox refined’, Containerisation International, September 1999, P.75-77). Crinks says “The main benefit of Greybox over Interbox or SynchroNet is that we as well as having systems employed on-line and available to our customers. We also have people in place to deal directly with our customers if they prefer not to use the systems provided” (S. Fletcher, June 2000).
ways to use in order to reduce the repositioning cost and the cost benefit will be compared later.
Table 15
Repositioning saving costs with Greybox in 2000
A. Interchange program when supplying equipment
Possible Interchange 10% 20% 30% 40% 50% Empty container 20ft 857 1715 2572 3430 4287 Empty container 40ft 943 1887 2830 3774 4717 Fee charge (US$50)/Boxes
(thousand of US$)
90 180 270 360 450
Receive US$1/20ft and
US$2/40ft per day 11 22 33 44 55
Repositioning saving costs (thousand US$)
386-450 773-900 1160-1350 1547-1800 1933-2250
B. Interchange program when using equipment
Possible Interchange 10% 20% 30% 40% 50% Empty container 20ft 857 1715 2572 3430 4287 Empty container 40ft 943 1887 2830 3774 4717 Fee charge (US$50)/Boxes
(thousand of US$) 90 180 270 360 450
Pay US$1.3/20ft and US$2.3/40ft per day
13 26 39 53 66
Repositioning saving costs (thousand US$)
362-426 725-852 1087-1278 1450-1704 1812-2130
C. Greyslot.
Possible Greyslot 10% 20% 30% 40% 50% Empty container 20ft 857 1715 2572 3430 4287 Empty container 40ft 943 1887 2830 3774 4717 Fee charge (US$10)/Boxes
(thousand of US$) 18 36 54 72 90
Empty move(US$50)/boxes (thousand of US$)
90 180 270 360 450
Repositioning saving costs
4.5 Repositioning solution Analysis
Repositioning solution analysis will be discussed in terms of conflict of interest, cost benefit and service specification as follows.
4.5.1 Conflict of Interest
Conflict of Interest for RCL as follows will be analysed in terms of the conflict between ownership and management of a container lease fleet, data sharing limitation, absolute neutrality and security, and control of equipment.
4.5.1.1 Ownership and Management of a container lease fleet
Greybox and InterBox are possible to come into conflict with the ownership and management of a container lease fleet, since both products have provided leasing service to a leasing company’s customer (Sevaldsen, VP of SynchroNet Marine, 1999). InterBox has strict rules to control their members (Tim Power, VP marketing of InterBox, 1999) and Greybox has their ability to fully manage the administrative process (Crinks, VP of Greybox Logistics Services, 1999). RCL does not like more control of management in their equipment since more control by strict rules of Interbox or more takes care of control by Greybox with the chance of conflict occurring between RCL management and the management of a container lease fleet. Associated Empty Container and SynchroNet do not provide leasing services.
4.5.1.2 Data Sharing Limitation
Access System or CAS to provide data pooling that helps users to view all potential available interchange opportunities. RCL seems to gain from data sharing with SynchroNet more than with Greybox, InterBox, and Associated Empty Container.
4.5.1.3 Absolute Neutrality and Security
Associated Empty Container with MLOs and fellow feeder carriers is only an agreement among liners, who want to reduce their repositioning costs and improve their load factor caused by the Asian economic crisis, to carry empty containers at a lower price than loaded boxes. Some liners compete on the same trade route but get both benefits of a win-win situation. When they join agreements in same association. Greybox was support by Transamerica world’s largest lessor of marine containers and intermodal freight equipment. So, their interest is in the leasing business, while, InterBox was operated by International Asset System or IAS-based in San Francisco and has a mission to develop an internet–based, business-to-business solution. SynchroNet is a San Francisco–based, wholly owned subsidiary of SynchroNet Marine AS of Norway. It is a private, venture-funded company that has one simple aim–to use innovative Internet and database technologies to help carriers reduce their empty repositioning costs. SynchroNet and InterBox seem to give more absolute neutrality and security than Greybox and Associated Empty Container.
4.5.1.4 Control of equipment
strict rules to control their members to return equipment back to a customer in a fixed time period, as well as cost and penalties to be paid if lost or damaged. They have full control and visual contact with the units in their system. Compared with Associated Empty Container, RCL can fully control its equipment by loading its empty containers on behalf of MLOs.
4.5.2 Cost Benefit
Cost Benefit as follows analysed in terms of RCL can solve the problem of repositioning cost for the short-term and long-term with cost-effective solutions.
4.5.2.1 Correction of repositioning solution in the short-term
Since the Asian economic crisis caused an imbalance of trade in which Thailand exported more than it imported, empty container movement inward from Singapore to Thailand was only a one way direction, as already discussed in chapter 3. Containers loaded in Thailand increased from 1,041,000 TEU in 1996 to 1,300,000
TEU in 1998 but containers discharged in Thailand decreased, in the opposite direction, from 963,000 TEU in 1996 to 779,000 TEU in 1998. Consequently, increase of loaded in Thailand but a decrease in discharged caused by the rise in empty container movements from 78,000 TEU in 1996 to 521,000 TEU in 1998. The empty container movement from Singapore inward to Thailand was very high, increasing from 18% of empty/total in 1996 to 26% of empty/total in 1998. The total container movement was reduced from 90,736 boxes in 1996 to 77,259 boxes in 1998, or a reduction of 15%. Many shipping lines have the same problem with a very low load factor, almost 20%, but RCL has a better load factor than other shipping lines inward from Singapore to Thailand with 32%. On the other hand, there was almost no RCL empty container movement outward from Thailand.
problem of empty container movement, since the liners will get more revenue from loading empty containers inward from Singapore to Thailand and want to improve its load factor that was very low during Asian economic crisis. While leasing and interchange equipment with other lines seems to be less possible to solve the problem because almost every line has the same bad situation with empty containers on similar trade route.
Associated Empty Container, Interbox with empty moves transaction, and Greyslot seem to be better to correct the repositioning solution for RCL in the short-term period.
4.5.2.2 Correction of repositioning solution in the long-term
Empty container movement has been the problem of RCL not only during the Asian economic crisis but also before and after the Asian economic crisis. As
The empty container movements will change to the opposite direction, from Thailand to Singapore trade route.
For correction of repositioning solution in the long-term, Interbox with a variety of different flexible products such as leasing container, empty moves transaction, or interchange program should be a better solution for RCL to solve the problem in the long term period than other solutions, since Interbox offers more opportunities and a flexible method for RCL to solve empty container movement problems. Greybox is also good at solving the problem in the long-term with leasing containers and empty move transactions, while SynchroNet offers only an interchange program with liners, and Associated Empty Container can solve only empty move transactions with its members.
4.5.2.3 Cost effectiveness
The Cost effective analysis as follows compares saving repositioning costs for RCL when using empty move transaction, leased container, and interchange equipment with associated empty container, Interbox solution, SynchroNet solution, and Greybox solution.
4.5.2.3.1 Empty move transaction
1,788,000, and Interbox saves US$ 1698,000(see Figure 13 Repositioning saving cost in empty move transaction in 2000).
Source: compiled data from Thailand Shipping Statistics 1998, RCL, GreyBox Logistics Services information, and Interbox information.
Figure 13
4.5.2.3.2 Using leased containers
InterBox can save repositioning costs more than Greybox when RCL uses leased containers in 2000. In the case of using leased containers to 10%, InterBox will save US$ 417,000, Greyboxsaves US$ 362,000 (see 4.2 InterBox solution and 4.4 Greybox solution). In the case of using leased containers to 30%, InterBox will save US$ 1,250,000, Greyboxsave US$ 1,087,000. In the case of using leased containers to 50%, InterBox will save US$ 2,083,000, Greyboxsaves US$ 1,812,000 (see Figure 14 Repositioning saving costs for using leased containers in 2000).
0 500 1000 1500 2000
thousand US$
10% 20% 30% 40% 50%
Possible empty move transaction
Repositioning saving costs for empty
moves transaction in 2000
Interbox
GreyBox
Source: compiled data from Thailand Shipping Statistics 1998, RCL, Greybox Logistics Services information, and Interbox information
Figure 14
4.5.2.3.3 Interchange equipment
InterBox will save repositioning costs more than SynchroNet when RCL uses Interchange equipment in 2000, but not too much. In the case of using Interchange equipment to 10%, InterBox can save US$ 429,000, SynchroNet saves US$ 412,000 (see 4.2 InterBox solution and 4.3 SynchroNet solution). In the case of using
Interchange equipment to 30%, InterBox can save US$ 1,289,000, SynchroNet saves US$ 1,235,000. In the case of using Interchange equipment to 50%, InterBox can save US$ 2,148,000, SynchroNet saves US$ 2,058,000 (see Figure 15 Repositioning saving costs for interchange equipment in 2000).
0 500 1,000 1,500 2,000 2,500
thousand US$
10% 20% 30% 40% 50% Possible using leased container
Repositioning saving costs for using leased containers in 2000
Source: compiled data from Thailand Shipping Statistics 1998, RCL, InterBox information and SynchroNet information.
Figure 15
4.5.2.3.4 Cost effectiveness
To compare saving costs between different solution above, we can see that Interchange equipment with InterBox can save more than other solutions. While InterBox (using leased containers), SynchroNet (Interchange equipment), empty move transaction by Associated Empty Container with members, or using leased container with Greybox and other solutions save RCL less than Interchange
equipment with InterBox. Anyway, empty move transaction with Interbox can save less than other solutions. Figure 16 shows an example of RCL cost effectiveness using various solutions where the percentage of interchange equipment, leased containers, or empty move transaction is 30% of total RCL empty container movements.
0 500 1000 1500 2000 2500
Thousand US$
10% 20% 30% 40% 50% possible Interchange equipment
Repositioning saving costs for interchange
equipment in 2000
Source: compiled data from Thailand Shipping Statistics 1998, RCL, InterBox information, SynchroNet information and Greybox information
Figure 16
4.5.3 Service specification
Service specification as follows analyses in terms of real-time information exchange and transaction administration, pooling and analysis capabilities, and cargo-based (start-to-finish) transaction recognition that will benefit RCL to solve repositioning costs.
4.5.3.1 Real-time Information exchange and transaction administration
InterBox, Greybox, and SynchroNet have the same concept to use a real-time on line communication to access a dynamic, global business-to-business exchange where they can source and reposition containers, search and post surplus or deficit containers, or search and post container vessel slot capacity. They complete transactions directly through a real-time bid/ask offer/counter offer process in an on-line marketplace. While associated empty container is less in real-time information
RCL Cost effectiveness in 2000
0 200 400 600 800 1000 1200 1400 Inter box( Interc hange equ ip.) Inter box( leased con.) Sync hroN et(Int ercha
nge e quip.
)
Asso ciated
Emp ty C
ontaine r Grey box( lease d co n.) Grey box( empty move .) Inter box(
empty mo ve.)
Solutions
Thousand US$