DEMOGRAPHIC RESEARCH
A peer-reviewed, open-access journal of population sciences
DEMOGRAPHIC RESEARCH
VOLUME 38, ARTICLE 45, PAGES 1359–1388
PUBLISHED 18 APRIL 2018
http://www.demographic-research.org/Volumes/Vol38/45/ DOI: 10.4054/DemRes.2018.38.45
Research Article
Adolescent contraceptive use and its effects on
fertility
David Antonio S´anchez-P´aez
Jos´e Antonio Ortega
c
2018 S´anchez-P´aez & Ortega.
This open-access work is published under the terms of the Creative Commons Attribution 3.0 Germany (CC BY 3.0 DE), which permits use, reproduction, and distribution in any medium, provided the original author(s) and source are given credit.
1 Background 1360
2 Data and methods 1362
2.1 Data 1362
2.2 The model 1364
2.3 Estimation 1365
3 Results 1367
4 Discussion 1376
5 Acknowledgments 1378
References 1379
Adolescent contraceptive use and its effects on fertility
David Antonio S´anchez-P´aez1
Jos´e Antonio Ortega2
Abstract
BACKGROUND
Adolescent reproductive health is part of internationally agreed development goals. Un-married adolescents are not commonly included in global monitoring of contraceptive use despite the more severe consequences of unintended childbearing for them.
OBJECTIVE
We document levels and trends of contraceptive prevalence and demand for married and sexually active unmarried adolescent women aged 15–19 in Latin America and sub-Saharan Africa. We estimate the effect of adolescent contraceptive use and marital status on fertility and the impact of meeting current demand.
METHODS
We propose a fertility model informed by the proximate determinants framework separat-ing adolescents by marital status. Linear Mixed Model estimates are based on aggregate data from 120 DHS surveys for 34 developing countries.
RESULTS
Increasing contraceptive prevalence has already reduced adolescent fertility by 6.8% in Latin America and 4.1% in sub-Saharan Africa. Meeting the total demand for contracep-tives of unmarried adolescents would lead to an additional decrease in fertility of 8.9% and 17.4% respectively.
CONCLUSIONS
Contraceptive demand and prevalence are generally higher for sexually active unmarried adolescent women than for those married. Increasing prevalence has already had an im-pact in declining fertility, but there is a potentially larger effect if high levels of unmet need are eliminated, particularly in sub-Saharan Africa. Such reduction would have a significant impact on adolescent health.
1Doctoral Program in Economics, Department of Economics and Economic History, University of Salamanca,
Spain. Email:[email protected].
CONTRIBUTION
We provide evidence of the importance of contraceptive use of unmarried sexually active adolescent women in explaining trends in adolescent fertility. We estimate the poten-tial effect of meeting the contraceptive needs of married and unmarried adolescents on unintended childbearing.
1. Background
Total demand and contraceptive use are fundamental measures of access to Sexual and Reproductive Health and Rights (SRHR). Universal access to Sexual and Reproductive Health (SRH) by 2030 corresponds to targets 3.7 and 5.6 of the United Nations Sustain-able Development Goals (SDGs), and it is also recognized in target 5.B of the Millennium Development Goals (UN 2015). In fact, indicator 3.7.2 of the SDGs explicitly refers to Adolescent Birth Rate. Expansion of contraceptive use in most impoverished countries is also the goal of the Family Planning 2020 global partnership (Family Planning 2020 2015). Not leaving adolescents behind is explicit in the Global Strategy for Women’s, Children’s and Adolescents’ Health of the Every Woman Every Child global movement (Every Woman Every Child 2015). Following international practice, the key measure of adolescent fertility is the age-specific fertility rate for women aged 15 to 19 (UN 2013). At present, about sixteen million young women between ages from 15 to 19 give birth every year, and three million undergo unsafe abortions, making pregnancy and childbirth the leading cause of death for teenage girls (Advocates for Youth 2013). Approximately 11% of global births occur to adolescent women, 95% of them in developing countries (Vogel et al. 2015; WHO 2011).
Despite the mention to universal access, global monitoring of these aims has cen-tered on women married or in-union (UN 2016; UNFPA 2010). As a result, groups with special needs, such as sexually active unmarried adolescent women, are often left out of sight. Based on available global data on contraceptive use of adolescents, we bring into the debate the specific effect of contraception of sexually active unmarried adolescents on adolescent fertility. It is a factor of increasing importance to the extent that marriage is postponed with an increasing gap between sexual initiation and marriage (Blanc and Way 1998; Clark, Koski, and Smith-Greenaway 2017). Contraceptive use is therefore key to avoid unintended childbearing, which makes up a proportion between 50% and 90% of births to adolescent women, depending on the country (Neelofur-Khan and WHO 2007; Sedgh, Singh, and Hussain 2014). Still, most of teenage childbirths take place within marriage3 mainly because many married adolescents want to have children. In
3In this article, when we refer to ‘marriage’ or ‘married adolescents,’ we include both formal marriage and
this respect, an increasing age at marriage could be the most critical factor in postponing adolescent childbearing (ICRW 2014; UN 2013).
While unmarried adolescents have a higher unmet need for contraceptives than mar-ried women of their same age (Blanc et al. 2009; MacQuarrie 2014; UN 2014), many of them do not make use of contraceptive methods due to lack of access (Chandra-Mouli et al. 2014; Greene and Merrick 2015). This happens despite the fact that the consequences of unwanted conceptions are more severe for them: unintended childbearing, unsafe abor-tion, maternal and child mortality, school dropout, reduced earning potential, and lower educational achievements for the present and the next generation (Hindin et al. 2016; Neelofur-Khan and WHO 2007; Santhya and Jejeebhoy 2015; UN 2013; WHO 2010). In this respect, changing contraceptive behavior seems more achievable than changing sexual behavior in adolescents (ICRW 2014).
Unintended pregnancies to unmarried adolescents are also precipitating factors of early marriage in many societies. An indicator of this is the proportion of first births to married adolescents occurring less than eight months after marriage: The incidence of postconception marriage measured in this way among women aged 20–24 years giving birth before they are 20 years old ranges between 10% and 40% in Latin America and Africa (UN 2013). Early unions are more likely to result in the gender-based health and human rights violation of forced marriage (Banerji, Martin, and Desai 2008; UNICEF 2001, 2005; WHO 2011) and reinforce gender inequality (Raj and Boehmer 2013).
Many demographers analyze the role of contraception in reducing fertility through the proximate determinants framework (Bongaarts 1978, 2015). In this framework, con-traception is one of the intermediate behavioral factors influencing childbearing, the oth-ers being marriage or sexual exposure, abortion, and lactational postpartum infecund-ability. Standard applications of the framework take as inputs contraceptive prevalence and the contraceptive method mix, and based on published average rates of contraceptive failure impute a reduction factor of fertility due to contraception at the population or the age-specific level. Bongaarts (2017) provides an alternative method based on estimat-ing empirically the reduction in fertility due to changes in contraceptive prevalence usestimat-ing fixed-effects panel regression. We follow a similar empirical approach while focusing on adolescent fertility and separating adolescents according to marital status: Earlier formu-lations of the proximate determinants are based on married women only. Since Stover (1998), most studies include data on all sexually active women, but all sexually active women are grouped together. This is not satisfactory for our purposes since married and sexually active unmarried adolescents have very different behavior regarding contracep-tive use and demand, sexual activity, and fertility.
Despite the policy consensus on its importance, until recently not many studies have focused on adolescent contraceptive use and fewer on unmarried sexually active ado-lescents (Hindin and Kalamar 2017). WHO has contributed to fill that gap providing survey-specific country-sheets for 58 countries on adolescent contraceptive use that com-pare married adolescents and those sexually active unmarried (WHO 2016), and the DHS program has produced a monograph focusing on unmet need for young women 15–24 (MacQuarrie 2014). Loaiza and Liang (2013) and MacQuarrie (2014) show that women aged 15–19 tend to have the highest levels of unmet need for contraception and the lowest proportion of demand satisfied. Our purpose is to quantify the childbearing consequences of adolescent contraceptive use and nonuse in developing countries based on the available evidence. We first analyze contraceptive use and total demand for contraceptives of both married and unmarried adolescents and estimate the effect of such contraceptive use and total demand on fertility. In doing so, we highlight the role that increasing prevalence has had in reducing fertility and estimate the potential effect of satisfying total demand by eliminating current unmet need for contraception. This knowledge can be helpful in reaching better-informed decisions regarding SRHR policy.
2. Data and methods
2.1 Data
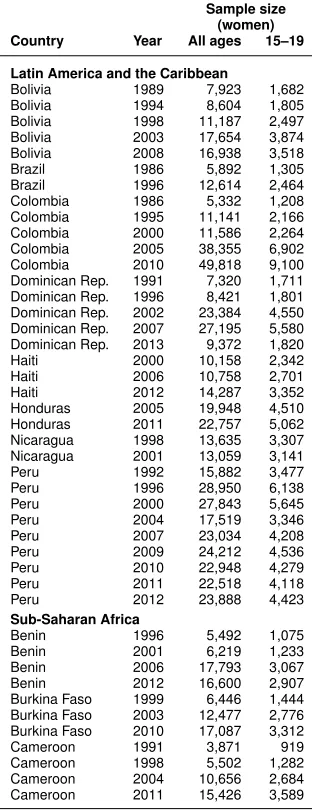
WHO 2016; Bongaarts 2017). We use aggregate information from DHS surveys carried out in developing countries between 1986 and 2015 and contained in the STATcompiler database (DHS Program 2015). We obtain data on contraceptive use, unmet need, and total demand for contraceptives of adolescent women aged 15–19, both married and sex-ually active unmarried women, proportions of sexsex-ually active adolescents, and adolescent fertility measured by the age-specific fertility rate (ASF R) 15–19 in the three years prior to the survey. In order to focus in trends over time, we restrict our analysis to coun-tries with complete data for at least two surveys. Since almost all councoun-tries fulfilling these conditions are located in Latin America and the Caribbean (LAC) and sub-Saharan Africa (SSA) and there is insufficient or no coverage of developing countries in Asia or Northern Africa, we restrict the sample to countries in these two regions. The final sample contains 120 DHS surveys from 34 countries.4 Table A-1 lists the included surveys
to-gether with their respective sample sizes (see Appendix). Data manipulation, estimation, and manuscript edition are carried out in R (R Core Team 2017).5
We first perform descriptive data analysis comparing contraceptive use and total demand of married and sexually active unmarried adolescents. Total demand for ceptives is calculated as the sum of contraceptive prevalence and unmet need for contra-ception. Unmet need is defined as the share of fecund and sexually active women who have an unmet need for family planning in percentage terms. The numerator includes all pregnant women whose pregnancies are unwanted or mistimed at the time of conception; postpartum, amenorrheic women who are not using family planning and whose last birth is unwanted or mistimed; and all fecund women who are neither pregnant nor postpartum amenorrheic and who either do not want any more children (unmet need for limiting) or wish to postpone births for at least two years or do not know when or if they want another child (unmet need for spacing) but are not using any contraceptive method (UN 2014).
It would have been desirable to have separate estimates of fertility for married and sexually-active unmarried adolescents. Unfortunately, STATcompiler does not provide such data: Only the age-specific fertility rate for all women 15–19 is available. Since not all women aged 15–19 are sexually active, the conventionalASF Runderestimates the risk of childbearing. We have therefore adjusted for exposure based on information on time at last sexual intercourse, excluding unmarried women not having had sex in the last year.
4Countries included are Benin, Bolivia, Brazil, Burkina Faso, Cameroon, Colombia, Congo, Congo D.R., Cote
d’Ivoire, Dominican Republic, Ethiopia, Gabon, Ghana, Guinea, Haiti, Honduras, Kenya, Lesotho, Liberia, Madagascar, Malawi, Mali, Mozambique, Namibia, Nicaragua, Nigeria, Peru, Rwanda, Sierra Leone, Tanzania, Togo, Uganda, Zambia, and Zimbabwe. Kazakhstan was the only Asian country that met our requirements but was excluded from the final sample for the reasons given in the text.
5broom(Robinson 2017) andtidyverse(Grolemund and Wickham 2017; Wickham 2017) for
2.2 The model
The idea of the proximate determinants framework is to include the behavioral variables that determine fertility so that the role of socioeconomic determinants would necessar-ily happen through the impact in some of the proximate determinants (Bongaarts 1978). Baschieri and Hinde (2007) provide confirmation of such hypothesis in Egypt, finding that once the proximate determinants are included, the importance of socioeconomic variables in a fertility model based on microdata vanishes. Changes in the proximate determinants of fertility, such as marriage and contraceptive prevalence, should therefore provoke direct changes in fertility. The classic proximate determinants framework cap-tures this in the equationASF R=Cm×Cc×Ca×Ci×AF. For a given age-group, this equation links the potential fecundity,AF, to the actualASF Rthrough a set of reduction factors connected to marriage,Cm; contraception,Cc; abortion,Ca; and postpartum in-fecundability,Ci(Bongaarts 1978; Bongaarts and Potter 1983). Stover (1998) criticizes this classic model, suggesting the use of sexual activity rather than marriage to indicate exposure, a point subsequently adopted by Bongaarts (2015). While this recognizes that not only married women contribute to fertility, it is yet simplistic for our purposes since it treats all sexually active women alike. Precisely our point is that there are differences in the proximate determinants, and specifically in the use of contraception, between married and unmarried sexually active adolescents. Figure 1 highlights the gaps in contraceptive prevalence and total demand. We therefore want to work with both groups separately.
Separating the contribution to fertility of married and unmarried women is in line with the Princeton model of fertility (Coale and Watkins 1986). This project produces joint estimates of total fertility,If, as a weighted average of married and unmarried fer-tility,IgandIh, using as weights the proportion married,Im. Since the purpose is not to model the impact of contraceptive use or sexual exposure it just proposes the decomposi-tion:If =Ig×Im+Ih×(1−Im).
• M U: Proportion of married or in-union adolescent women currently using a con-traceptive method among those exposed:M U = M1−·CP MN EX, whereM is the propor-tion of married or in-union adolescents, andCP M is the proportion of married or in-union women using any contraceptive method.
• M N: Proportion of married or in-union adolescent women currently not using any contraceptive method among those exposed:M N =M·(1−1−N EXCP M).
• U N: Proportion of sexually active unmarried adolescent women currently not us-ing any contraceptive method among those exposed:U N =(1−M)·(1−1−N EXCP U)·SAU, whereCP U is the proportion of not married women not using any contraceptive method.
• U U: Proportion of sexually active unmarried adolescent women currently using
any contraceptive method among those exposed:U U =(1−M1−)·CP UN EX·SAU.
By definition, these four proportions add up to 1. To avoid multicollinearity, in our analysis we use the fertility of married women not using contraception as the reference category. The coefficients for the rest of proportions indicate to what extent fertility is lower when the share in these other groups increases. In the model proposed, we expect all coefficients to be negative, regardless of the country-specific averages:
ABREit=β0+β1M Uit+β2U Nit+β3U Uit+i+δit, (1)
whereABREit corresponds to the adolescent birth rate among adolescent women ex-posed asABREit= 1−ABRN EXitit.
2.3 Estimation
ABREit=β0Xit+i+δit, (2)
whereABREitis our variable of interest,βthe vector of coefficients,Xitthe vector of regressors, i the country-specific random-effect, andδitthe observation-specific error term. The linear model estimate that does not take the unbalanced panel structure into account provides inconsistent variance estimates to the extent that the variance of the random-effects is different from 0. We have tested such restriction based on the exact LR test (Scheipl, Greven, and Kuechenhoff 2008) with p-values very close to zero, indicating the need to use LMM estimation.
For LMM estimation to be consistent, there should not be correlation between the random-effects and the regressors. This will not always be the case. In our specific ex-ample, for instance, we find a correlation between the random fertility effects and contra-ceptive prevalence: Beyond the possible causal effect of higher contracontra-ceptive prevalence on fertility, contraceptive use provides a signal of whether this is a high or low fertil-ity country. One of the possible reasons why this could occur is a connection between the unmet need for contraception and the cultural or structural factors in the country. There are different methods to estimate consistently in the presence of such correlation, including fixed-effects estimation or the inclusion of the country-specific means of the regressors as additional covariates in an extended mixed-effects LMM model (Snijders and Berkhof 2008). We adopt the latter approach, generally called within-between or Mundlak’s specification (Bell and Jones 2015; Dieleman and Templin 2014). While both methods provide identical estimates for the coefficients, the random effect specification has several advantages over fixed-effects, including the measurement of heterogeneity among countries, the possible inclusion of country-specific time-invariant covariates, or the possibility of applying the model to nations absent in the sample. It is appropriate in our case, given our focus on inference about theβcoefficients. It is possible to formally test for correlation between the regressors and the random-effects with a Hausman-type test corresponding to the LR test of the general model containing the means versus the null model of regular LMM estimation. We report the results of both models. When the null of no correlation is rejected, the only consistent estimate of the causal effects is pro-vided by the extended LMM model. When the null is not rejected at the 5% level, both estimates are consistent and our preferred model would be the regular LMM model. The preferred model in model tables is indicated by boldface, and the p-value of the Mundlak test is provided in the last row.
All the observed variables are measured with an error since they originate in a sam-ple survey, and they are subject to sampling error. In the case of contraceptive prevalence and demand, approximate confidence intervals have been calculated based on the Wilson method (Agresti and Coull 1998) and displayed in Figure 1.6Measurement error also has
potential effects on regression estimates. Note that measurement errors are correlated by design for the different variables: A sample with more unmarried women using contra-ceptives than in the population would likely have a lower proportion of married women and, most likely, lower fertility than the standard sample. While there are no general insights about the possible estimation bias induced (Carroll et al. 2006), it is reassuring that we would not expect sampling errors to be correlated among different countries or over time. This approach has been proven enough to eliminate bias in some particular cases (Buonaccorsi 2010: 371). Rindfuss et al. (2015) also provide empirical evidence that even when univariate distributions might be biased due to nonresponse or sampling error, regression estimates might not be affected.
Based on the preferred model and in order to interpret the policy relevance of the results, simulations of the effect on fertility rates of contraceptive prevalence are provided in the following scenarios:
• What would the levels of fertility be if contraceptive prevalence remains at the levels of the first available survey? This case indicates the effect of increasing levels of contraceptive prevalence in the sample.
• What would be the levels of fertility if total demand for contraceptives has been satisfied? Since adolescents in developing countries and, in particular, those un-married, face high levels of unmet need, this simulation provides an idea of the potential impact of meeting total demand.
3. Results
Panel (a) of Figure 1 displays the contraceptive prevalence for both sexually active un-married and un-married or in-union adolescent women at the latest DHS survey. In most countries, contraceptive prevalence is higher for unmarried women, implying the impor-tance of bringing contraceptive methods to them so that they can decide when to begin childbearing and when to get married. Thus, contraceptive prevalence for unmarried adolescents in LAC countries is 60.3% on average while in SSA countries it is lower at 38.6%.
Panel (b) of the same figure highlights even more significant differences in total de-mand for contraceptives. While levels of dede-mand for married adolescents varies widely among countries, total demand for unmarried adolescents is high almost everywhere, with an average of 84.7% and 80% for LAC and SSA countries, respectively. This implies that levels of unmet need for contraception are higher for sexually active unmarried
cents, indicating specific problems of access to SRHR for them. Thus, unmet need for single adolescents is 24.4% and 41.4% on average in LAC and SSA respectively.
Figure 1: Contraceptive prevalence and total demand for contraceptives for
adolescent women by marital status in the latest DHS survey
(a) Prevalence (b) Total demand
0 25 50 75 100 0 25 50 75 100
Peru 2012 Colombia 2010 Honduras 2011−2012 Nicaragua 2001 Dominican Rep. 2013 Brazil 1996 Bolivia 2008 Kenya 2014 Zambia 2013−2014 Namibia 2013 Congo 2011−2012 Zimbabwe 2010−2011 Rwanda 2014−2015 Malawi 2010 Lesotho 2009 Haiti 2012 Gabon 2012 Madagascar 2008−2009 Ethiopia 2011 Ghana 2014 Cameroon 2011 Tanzania 2010 Uganda 2011 Liberia 2013 Congo D.R. 2013−2014 Cote d'Ivoire 2011−2012 Togo 2013−2014 Benin 2011−2012 Sierra Leone 2013 Mali 2012−2013 Burkina Faso 2010 Mozambique 2011 Guinea 2012 Nigeria 2013
Percentage
Sur
v
e
y
Marital Status Married or in-union Unmarried, sexually active
Figure 2: Trends of contraceptive prevalence and total demand for contraceptives for adolescent women by marital status
Togo Uganda Zambia Zimbabwe
Mozambique Namibia Nigeria Rwanda Sierra Leone Tanzania
Kenya Lesotho Liberia Madagascar Malawi Mali
Congo D.R. Cote d'Ivoire Ethiopia Gabon Ghana Guinea Nicaragua Peru Benin Burkina Faso Cameroon Congo Bolivia Brazil Colombia Dominican Rep. Haiti Honduras
1990 2000 2010 1990 2000 2010 1990 2000 2010 1990 2000 2010
1990 2000 2010 1990 2000 2010 0 25 50 75 100 0 25 50 75 100 0 25 50 75 100 0 25 50 75 100 0 25 50 75 100 0 25 50 75 100 Year P ercentage women 500 1000 1500 2000 Marital Status
Married or in-union Unmarried, sexually active
Variable
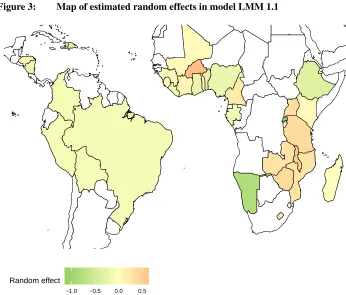
Regarding our fertility model, three different estimates appear in Table 1. The first two are LMM regressions, and the last is a linear model. The p-value of the Hausman-type test between LMM 1.1 and LMM 1.2 is 3e-04; therefore, only LMM 1.1 is consistent and the inclusion of country-specific means is necessary. It is worth noticing the change of sign ofM Uit among LMM 1.1 and LMM 1.2, with the expected sign in LMM 1.1 once bias is corrected. This variation of the sign is in line with the explanation given above: There is a correlation between the country-specific random effects and M Uit since countries where the proportion married is high at adolescence are countries that have higher fertility irrespective of the causal mechanism of contraceptive use. For this reason, it is necessary to test for endogeneity and adopt a solution such as using LMM 1.1. Figure 3 maps the distribution of the random effect in the countries of our sample. It highlights that SSA countries have higher variance than LAC countries that are all more alike. An additional model is estimated, including region as a covariate. The estimated coefficient for region, 1.956, indicates slightly higher fertility in sub-Saharan Africa. However the coefficient is very close to zero as indicated by a p-value of 0.94, meaning it cannot be rejected that the coefficient is zero: The difference between SSA and LAC lies in the variance, not in the mean.
Table 1: Model estimates forABRE, adolescent birth rate for exposed women (births per thousand exposed women)
LMM 1.1 LMM 1.2 LM 1
Intercept 342.584∗∗∗ 428.059∗∗∗ 375.367∗∗∗ (25.787) (19.383) (16.714)
MUit –60.630 125.461∗ 276.064∗∗∗
(106.309) (69.392) (56.275) UNit –256.046∗∗∗ –192.752∗∗∗ –109.621∗∗∗
(54.586) (44.775) (41.378) UUit –490.514∗∗∗ –440.670∗∗∗ –347.411∗∗∗
(39.206) (34.158) (33.882)
MUi 382.785∗∗∗
(133.793)
UNi 181.864∗∗
(84.222)
UUi 210.505∗∗∗
(69.054)
BIC 1,281.014 1,285.658 1,319.857
Log likelihood –618.963 –628.466 –647.960
Num. obs. 120 120 120
sigma 34.161 35.446 54.472
sigma. RE 34.448∗∗∗ 43.182∗∗∗ Mundlak test (p-value) 0.000
Figure 3: Map of estimated random effects in model LMM 1.1
−1.0 −0.5 0.0 0.5
Random effect
Note: Based on contraceptive prevalence and proportions of married or sexually active adolescents, positive values correspond to countries with adolescent fertility higher than expected.
To better evaluate the meaning of the previous results, we present the model fit for
ABREtogether with the relevant simulations in Figure 4. The two simulations highlight respectively the effect that unmarried adolescent contraceptive use has already played in the reduction of adolescent fertility and its potential role if unmet need for contraception was eliminated. In the first simulation, namedSimCP, the contraceptive prevalence for unmarried adolescents remains at the value of the first available survey. The second scenario, denoted bySimTD, answers the question of what would fertility be if unmet need by unmarried adolescents was eliminated with contraceptive prevalence equal to total demand.
declines are due to increasing contraceptive prevalence from levels at the first available survey. In some countries like Kenya, Namibia, or Uganda, most of the fall is due to higher contraceptive prevalence. In others, like Bolivia, Brazil, Colombia, Ghana, or Peru, it makes a substantial contribution. In contrast, it has made little impact on the ob-served decline in countries with low contraceptive prevalence for unmarried adolescents. The average effect as a percent of observed levels in surveys after the first is 6.8% for LAC countries and 4.1% for SSA countries. The average contribution is higher in LAC where prevalence has increased faster. If contraceptive prevalence had not increased over time,ABREwould be higher according to the difference between the predicted average in theSimCPscenario and the model fit. The average difference is 16.9 and 8 births per thousand exposed women in LAC and SSA respectively.
Figure 4: Adolescent birth rate for exposed women: Model fit and simulations under stalled contraceptive prevalence for unmarried adolescents (SimCP) and met total demand for unmarried adolescents (SimTD) scenarios
Togo Uganda Zambia Zimbabwe
Mozambique Namibia Nigeria Rwanda Sierra Leone Tanzania
Kenya Lesotho Liberia Madagascar Malawi Mali
Congo D.R. Cote d'Ivoire Ethiopia Gabon Ghana Guinea
Nicaragua Peru Benin Burkina Faso Cameroon Congo
Bolivia Brazil Colombia Dominican Rep. Haiti Honduras
1997 2014 1987 2012 1991 2014 1999 2010
1997 2011 1991 2014 1989 2014 2010 2015 2008 2013 1996 2010
1988 2015 2004 2009 1985 2014 1991 2009 2000 2010 1995 2013
2007 2013 1993 2013 2000 2011 2000 2012 1987 2015 2005 2012
1998 2001 1991 2013 1995 2013 1999 2010 1990 2012 2005 2011
1988 2009 1986 1996 1985 2011 1990 2014 2000 2012 2005 2011
320 360 400 150 200 250 200 225 250 275 300 250 300 350 400 150 200 250 300 350 50 100 150 200 250 200 250 300 350 100 200 300 240 280 320 360 100 150 200 250 300 200 250 300 350 400 450 200 250 300 350 100 150 200 250 250 300 350 400 100 150 200 250 300 350 300 330 360 390 200 300 400 500 100 150 200 250 300 350 360 390 420 100 200 300 200 250 300 350 200 250 300 350 400 250 300 350 400 450 250 300 350 400 450 100 150 200 250 160 200 240 280 100 200 300 300 400 300 400 500 600 400 450 500 550 175 200 225 250 275 300 150 200 250 300 350 400 200 250 300 350 400 100 150 200 Year Prediction
Simulation Fitted Observed SimCP SimTD
At this point, we only have dealt with the effect of meeting the demand of unmarried adolescents: This has, in general, a higher impact than meeting the demand of married adolescents, given that the fertility reduction connected to their contraceptive use is larger (see Table 1). Moreover, levels of unmet need and total demand are higher for them since many married adolescents expect to have children. The contribution of meeting the total demand for married adolescents would be an additional 3.5% reduction in LAC and 2.9% reduction in SSA.
4. Discussion
Internationally agreed goals on SRHR emphasize achieving universal access to contracep-tion, and our analysis corroborates that a focused perspective is needed so adolescents, and in particular those unmarried sexually active, are not left aside in global monitoring. The situation of lack of access is particularly intense for them: A vast majority of unmar-ried sexually active adolescents have a demand for family planning, which is larger than demand by married adolescents. Levels of unmet need are also larger for those unmarried sexually active.
Through the simulations, it is possible to infer the two sides of the problem at the same time: There would have been higher adolescent fertility if contraceptive use had not increased over time, and there is still a strong potential reduction of adolescent fertility by satisfying current demand levels. Our analysis shows that increasing levels of contra-ceptive use by sexually active unmarried adolescents play an important role in explaining the reductions observed in adolescent fertility in many countries. While meeting the de-mand for family planning of both married and unmarried adolescents reduces adolescent fertility, the impact of meeting the demand is higher for the latter. These effects are siz-able: Meeting the demand of both groups would decrease fertility by a 12.4% in LAC and 20.3% in SSA. There is a substantial literature on the negative consequences of ado-lescent pregnancy and childbearing regarding maternal and child mortality, unintended pregnancy, unsafe abortion, educational dropout, and lower incomes (Hindin et al. 2016; Neelofur-Khan and WHO 2007; Santhya and Jejeebhoy 2015; UN 2013; WHO 2010). In this context, lowering the incidence of adolescent pregnancy by satisfying current de-mand levels could avoid many of these adverse outcomes and the subsequent reduction of well-being for this and the next generation. Strengthening health systems to meet the needs and priorities of unmarried adolescents should, therefore, be a priority.
need. We estimated throughSimTDthe potential reduction in fertility of satisfying unmet need. Furthermore, some findings show that adolescents are less likely to change their patterns of sexual activity than their contraceptive practice (ICRW 2014). Meeting their contraceptive needs can, therefore, avoid unintended pregnancies and unsafe abortions.
The effect on fertility of increasing contraceptive use is larger for unmarried women than for married women signaling that the former are not willing yet to begin childbear-ing. Indeed, our estimations show a higher impact of contraceptive use on fertility, in the order of almost four to one, in the case of sexually active unmarried women.
Standard demographic models, such as the proximate determinants framework and the Princeton model, are, from the perspective of this research, too simple. The sharp differences in behavior among adolescents according to marital status indicate the need to analyze them separately. We have done this by broadening the proximate determi-nants framework in the spirit of the Princeton model while making explicit the role of contraceptive use and controlling for sexual exposure. Due to the significant adverse consequences of adolescent childbearing in countries with high rates, such as most of SSA and LAC, it is key not to leave any group aside – in particular, those unmarried sexually active. Our results on the importance of contraceptive prevalence are in line with the imputed reductions based on contraceptive prevalence in applications of the de-mographic determinants framework (Bongaarts and Potter 1983; Bongaarts 2015). The difference is that we are estimating the effect instead of imputing it, a similar approach to Bongaarts (2017). In that paper it is argued, based on fixed-effects regressions, that the impact of contraceptive prevalence on fertility is not different in sub-Saharan Africa to other regions. This is in line with our findings, but we have found a large heterogene-ity in the estimated random-effects in SSA that is not found in LAC. This suggests that there are other factors at play in the African case beyond contraceptive prevalence. Singh, Bankole, and Darroch (2017) look at the impact of contraceptive prevalence on fertility in SSA by means of similar scenarios to the ones devised in this paper using a proximate-determinants like accounting framework. They find that fertility would increase 35% in SSA if contraceptive prevalence were set to zero and that satisfying current unmet need for modern methods would further reduce fertility by an average of 22% for all women aged 15–49. Our estimates for adolescents aged 15–49 are of comparable magnitude based on a different approach.
Regarding the limitations of our study, we have not explicitly addressed the effec-tiveness of contraceptive methods used by adolescents. Using more efficient methods in combination with condom use for the prevention of sexually transmitted diseases would imply a higher public health impact. There is also no information on induced abortion, which would have made the estimates more robust.
con-trol and measurement of the fertility reduction effect of contraceptive use for the different groups of women in different countries. However, not all surveys report information for unmarried women. In this regard, and for our current purposes, it is enough to use ag-gregate data. Nevertheless, we intend to use individual-level data in future research to more precisely estimate differences in fertility according to marital status and contracep-tive use. This can also avoid some of the shortcomings of aggregate indicators, replacing them for more accurate ones. One such case is the measurement of the proportion sexu-ally active. The standard definition of sexual activity is based on intercourse in the last four weeks; nonetheless, this is not the relevant concept from the perspective of fertility, in which a more prolonged period would be desirable, in particular for unmarried women (we consider all married adolescents are exposed). Singh, Bankole, and Darroch (2017) extend it to three months. Our operational definition is based on sexual exposure in the last year, assuming that patterns of contraceptive prevalence are similar than for those sexually active in the previous four weeks.
An additional concern regards data availability. Many countries are still not reporting on demand for contraceptives, sexual activity, and other SRH dimensions for unmarried adolescents, as is the case of many Asian countries. Lack of data makes the adoption of well-informed policy decisions more difficult, and it might mean that special needs such as those of sexually active unmarried adolescents are not addressed.
5. Acknowledgments
References
Advocates for Youth (2013). The sexual and reproductive health of young people in low
and middle income countries. Washington, D.C.: Advocates for Youth.
Agresti, A. and Coull, B. (1998). Approximate is better than ‘exact’ for interval estima-tion of binomial proporestima-tions. The American Statistician52(2): 119–126. doi:10.1080/
00031305.1998.10480550.
Banerji, M., Martin, S., and Desai, S. (2008). Is education associated with a transition
towards autonomy in partner choice? A case study of India. Paper presented at the
IUSSP seminar on changing transitions to marriage: Gender implications for the next generation, New Delhi, India, September 10–12, 2008.
Baschieri, A. and Hinde, A. (2007). The proximate determinants of fertility and birth intervals in Egypt: An application of calendar data. Demographic Research16(3): 59–96.doi:10.4054/DemRes.2017.16.3.
Bell, A. and Jones, K. (2015). Explaining fixed effects: Random effects modeling of time-series cross-sectional and panel data. Political Science Research and Methods
3(1): 133–153.doi:10.1017/psrm.2014.7.
Blanc, A. and Way, A. (1998). Sexual behavior and contraceptive knowledge and use among adolescents in developing countries. Studies in Family Planning29(2): 106– 116.
Blanc, A., Tsui, A., Croft, T., and Trevitt, J. (2009). Patterns and trends in adolescents’ contraceptive use and discontinuation in developing countries and comparisons with adult women. International Perspectives on Sexual and Reproductive Health35(2): 63–71.doi:10.1363/ipsrh.35.063.09.
Bongaarts, J. (1978). A framework for analyzing the proximate determinants of fertility.
Population and Development Review4(1): 105–132.doi:10.2307/1972149.
Bongaarts, J. (2015). Modeling the fertility impact of the proximate determinants: Time for a tune-up. Demographic Research33(19): 535–560. doi:10.4054/DemRes.2017. 33.19.
Bongaarts, J. (2017). The effect of contraception on fertility: Is sub-Saharan Africa different? Demographic Research37(6): 129–146. doi:10.4054/DemRes.2017.37.6.
Bongaarts, J. and Potter, R. (1983). Fertility, biology, and behavior: An analysis of the
proximate determinants. New York: Academic Press.
Carroll, R., Ruppert, D., Stefanski, L., and Crainiceanu, C. (2006). Measurement error
in nonlinear models: A modern perspective. Boca Raton: Chapman.
Chandra-Mouli, V., McCarraher, D., Phillips, S., Williamson, N., and Hainsworth, G. (2014). Contraception for adolescents in low and middle countries: Needs, barriers, and access. Reproductive Health11(21): 1–8.doi:10.1186/1742-4755-11-1.
Clark, S., Koski, A., and Smith-Greenaway, E. (2017). Recent trends in premarital fertil-ity across sub-Saharan Africa. Studies in Family Planning48(1): 3–22. doi:10.1111/ sifp.12013.
Coale, A. and Watkins, S. (1986).The decline of fertility in Europe. New York: Princeton University Press.
DHS Program (2015). STATcompiler. [electronic resource]. Rockville: The DHS Pro-gram Demographic and Health Surveys.http://www.statcompiler.com/en.
Dieleman, J. and Templin, T. (2014). Random-effects, fixed-effects and the within-between specification for clustered data in observational health studies: A simulation study.PLoS One9(10): e110257. doi:10.1371/journal.pone.0110257.
Every Woman Every Child (2015). The global strategy for women’s, children’s and
adolescents’ health 2016–2030: Survive, thrive, transform. New York: United Nations.
Family Planning 2020 (2015). FP 2020 commitment to action 2014–2015. [electronic resource]. Washington, D.C.: FP2020. http://2014-2015progress.
familyplanning2020.org.
Galecki, A. and Burzykowski, T. (2013). Linear mixed-effects models using R. New York: Springer.
Gipson, J. and Hindin, M. (2008). Having another child would be a life or death situation for her: Understanding pregnancy termination among couples in rural Bangladesh.
American Journal of Public Health 98(10): 1827–1832. doi:10.2105/AJPH.2007.
129262.
Greene, M. and Merrick, T. (2015). The case for investing in research to increase access
to and use of contraception among adolescents. Seattle: Alliance for Reproductive,
Maternal, and Newborn Health.
Grolemund, G. and Wickham, H. (2017).R for data science. Sebastopol: O’Reilly.
Gurr, B. (2014). Reproductive justice: The politics of health care for Native American
women. New Brunswick: Rutgers University Press.
Hindin, M., Tuncalp, O., Gerdts, C., Gipson, J., and Say, L. (2016). Monitoring adoles-cent sexual and reproductive health. Bulletin of the World Health Organization94(3): 157–232.doi:10.2471/BLT.16.170688.
Hindin, M. and Kalamar, A. (2017). Country-specific data on the contraceptive needs of adolescents. Bulletin of the World Health Organization95(3): 166. doi:10.2471/blt. 16.189829.
ICRW (2014).Understanding the adolescent family planning evidence base. Washington, D.C.: International Center for Research on Women.
Kirby, D. (2011). Sex education: Access and impact on sexual behaviour of young peo-ple. New York: Expert Group Meeting on Adolescents, Youth, and Development; United Nations, Population Division, Department of Economic and Social Affairs.
http://www.un.org/esa/population/meetings/egm-adolescents/p07 kirby.pdf.
Kothari, M., Shanxiao, W., Head, S., and Abderrahim, N. (2012). Trends in adolescent reproductive and sexual behaviors: A comparative analysis. Calver-ton: ICF International (DHS Comparative Reports 29). https://www.dhsprogram.
com/pubs/pdf/CR29/CR29.pdf.
Leifeld, P. (2007). texreg: Conversion of statistical model output in R to LaTeX and HTML tables.Journal of Statistical Software55(8): 1–24.doi:10.18637/jss.v055.i08.
Loaiza, E. and Liang, M. (2013). Adolescent pregnancy: A review of the ev-idence. [electronic resource]. New York: United Nations Population Fund (UNFPA). https://www.unfpa.org/sites/default/files/pub-pdf/ADOLESCENT%20
PREGNANCY UNFPA.pdf.
MacQuarrie, K. (2014). Unmet need for family planning among young women: Levels and trends. Rockville: ICF International (DHS Comparative Reports 34).
https://www.dhsprogram.com/pubs/pdf/CR34/CR34.pdf.
Morris, J. and Rushwan, H. (2015). Adolescent sexual and reproductive health: The global challenges.International Journal of Gynaecology and Obstetrics131(S1): S40– S42.doi:10.1016/j.ijgo.2015.02.006.
Neelofur-Khan, D. and WHO (2007). Adolescent pregnancy: Unmet needs and un-done deeds: A review of the literature and programmes. [electronic resource]. Geneva: World Health Organization. http://apps.who.int/iris/bitstream/10665/43368/
1/9241593784 eng.pdf.
Polis, C., Bradley, S., Bankole, A., Onda, T., Croft, T., and Singh, S. (2016). Typical-use contraceptive failure rates in 43 countries with Demographic and Health Survey data: Summary of a detailed report. Contraception 94(1): 12–17. doi:10.1016/j. contraception.2016.03.011.
R Core Team (2017). R: A language and environment for statistical computing: R version 3.4.0 patched. [electronic resource]. Vienna: R Foundation for Statistical Computing.
https://www.R-project.org.
Raj, A. and Boehmer, U. (2013). Girl child marriage and its association with national rates of HIV, maternal health, and infant mortality across 97 countries. Violence Against
Women19(4): 536–551. doi:10.1177/1077801213487747.
Rindfuss, R., Choe, M., Tsuya, N., Bumpass, L., and Tamaki, E. (2015). Do low survey response rates bias results? Evidence from Japan. Demographic Research 32(26): 797–828.doi:10.4054/DemRes.2015.32.26.
Robinson, D. (2017). broom: Convert statistical analysis objects into tidy data frames: R package version 0.4.2. [electronic resource]. https://CRAN.R-project.org/
package=broom.
Santhya, K. and Jejeebhoy, S. (2015). Sexual and reproductive health and rights of ado-lescent girls: Evidence from low- and middle-income countries.Global Public Health
10(2): 189–221. doi:10.1080/17441692.2014.986169.
Scheipl, F., Greven, S., and Kuechenhoff, H. (2008). Size and power of tests for a zero random effect variance or polynomial regression in additive and linear mixed models.
Computational Statistics and Data Analysis52(7): 3283–3299. doi:10.1016/j.csda.
2007.10.022.
Sedgh, G., Singh, S., and Hussain, R. (2014). Intended and unintended pregnancies worldwide in 2012 and recent trends. Studies on Family Planning45(3): 301–314.
doi:10.1111/j.1728-4465.2014.00393.x.
Senanayake, P., Nott, J., and Faulkner, K. (2001). Adolescent sexual and reproductive health: The challenge for society. Human Fertility 4(2): 117–122. doi:10.1080/
1464727012000199401.
Singh, S., Bankole, A., and Darroch, J. (2017). The impact of contraceptive use and abortion on fertility in sub-Saharan Africa: Estimates for 2003–2014. Population and
Development Review43(S1): 141–165.doi:10.1111/padr.12027.
Stover, J. (1998). Revising the proximate determinants of fertility framework: What have we learned in the past 20 years? Studies in Family Planning29(3): 255–267.
UN (2013). Adolescent fertility since the International Conference on Population and
Development (ICPD) in Cairo. New York: United Nations, Department of Economic
and Social Affairs, Population Division.
UN (2014). World contraceptive use. New York: United Nations, Department of Eco-nomic and Social Affairs, Population Division.
UN (2015). Transforming our world: The 2030 agenda for sustainable development. [electronic resource]. New York: United Nations, UNGA Resolution. http://www.un.
org/ga/search/view doc.asp?symbol=A/RES/70/1&Lang=E.
UN (2016). Trends in contraceptive use worldwide. New York: United Nations, Depart-ment of Economic and Social Affairs, Population Division.
UNFPA (2010).How universal is access to reproductive health? A review of the evidence. New York: United Nations Population Fund (UNFPA). http://www.unfpa.org/sites/ default/files/pub-pdf/universalrh.pdf.
UNICEF (2001). Early marriage: Child spouses.Innocenti Digest1(7): 1–28.
UNICEF (2005). Early marriage: A harmful traditional practice: A statistical
explo-ration. New York: United Nations Children’s Fund (UNICEF).http://www.unicef.org/
publications/files/EarlyMarriage12.lo.pdf.
Vogel, J., Pileggi-Castro, C., Chandra-Mouli, V., Nogueira, V., Souza, J., Chou, D., and Say, L. (2015). Millennium development goal 5 and adolescents: Looking back, moving forward. Archives of Disease in Childhood100(S1): S43–S47. doi:10.1136/ archdischild-2013-305514.
WHO (2010). Position paper on mainstreaming adolescent pregnancy in efforts to make
pregnancy safer. Geneva: World Health Organization (WHO).
WHO (2011). WHO guidelines on preventing early pregnancy and poor reproductive
outcomes among adolescents in developing countries. Geneva: World Health
Organi-zation (WHO).
WHO (2016). Adolescent contraceptive use. [electronic resource]. Geneva: World Health Organization. http://www.who.int/reproductivehealth/adol-contraceptive-use.
Wickham, H. (2017). tidyverse: Easily install and load the ‘tidyverse’: R package version 1.2.1. [electronic resource].https://CRAN.R-project.org/package=tidyverse.
London: Chapman: 3–33.
Xie, Y. (2015).Dynamic documents with R and knitr. Boca Raton: Chapman.
Appendix
Table A-1: DHS surveys included in the analysis
Sample size (women) Country Year All ages 15–19
Latin America and the Caribbean
Bolivia 1989 7,923 1,682 Bolivia 1994 8,604 1,805 Bolivia 1998 11,187 2,497 Bolivia 2003 17,654 3,874 Bolivia 2008 16,938 3,518 Brazil 1986 5,892 1,305 Brazil 1996 12,614 2,464 Colombia 1986 5,332 1,208 Colombia 1995 11,141 2,166 Colombia 2000 11,586 2,264 Colombia 2005 38,355 6,902 Colombia 2010 49,818 9,100 Dominican Rep. 1991 7,320 1,711 Dominican Rep. 1996 8,421 1,801 Dominican Rep. 2002 23,384 4,550 Dominican Rep. 2007 27,195 5,580 Dominican Rep. 2013 9,372 1,820 Haiti 2000 10,158 2,342 Haiti 2006 10,758 2,701 Haiti 2012 14,287 3,352 Honduras 2005 19,948 4,510 Honduras 2011 22,757 5,062 Nicaragua 1998 13,635 3,307 Nicaragua 2001 13,059 3,141 Peru 1992 15,882 3,477 Peru 1996 28,950 6,138 Peru 2000 27,843 5,645 Peru 2004 17,519 3,346 Peru 2007 23,034 4,208 Peru 2009 24,212 4,536 Peru 2010 22,948 4,279 Peru 2011 22,518 4,118 Peru 2012 23,888 4,423 Sub-Saharan Africa
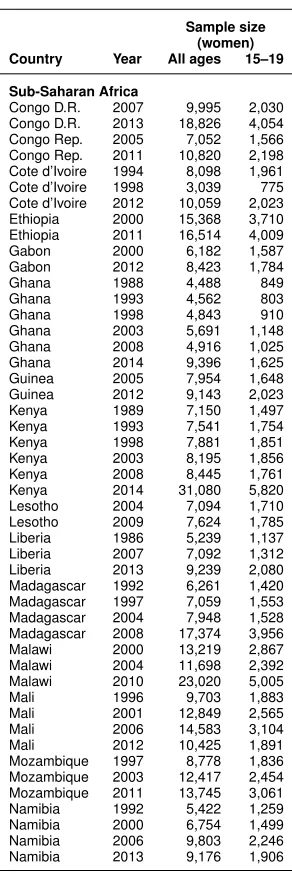
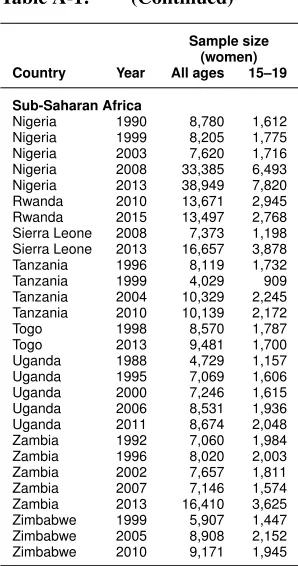
Table A-1: (Continued)
Sample size (women) Country Year All ages 15–19
Sub-Saharan Africa
Congo D.R. 2007 9,995 2,030 Congo D.R. 2013 18,826 4,054 Congo Rep. 2005 7,052 1,566 Congo Rep. 2011 10,820 2,198 Cote d’Ivoire 1994 8,098 1,961 Cote d’Ivoire 1998 3,039 775 Cote d’Ivoire 2012 10,059 2,023 Ethiopia 2000 15,368 3,710 Ethiopia 2011 16,514 4,009 Gabon 2000 6,182 1,587 Gabon 2012 8,423 1,784
Ghana 1988 4,488 849
Ghana 1993 4,562 803
Ghana 1998 4,843 910
Table A-1: (Continued)
Sample size (women) Country Year All ages 15–19
Sub-Saharan Africa