World Maritime University
The Maritime Commons: Digital Repository of the World
Maritime University
World Maritime University Dissertations Dissertations
2000
Analysis of Kenya's transport system as service
provider and gateway to the Northern Corridor
Beatrice Nyamoita
World Maritime University
Follow this and additional works at:http://commons.wmu.se/all_dissertations Part of theEconomics Commons
This Dissertation is brought to you courtesy of Maritime Commons. Open Access items may be downloaded for non-commercial, fair use academic purposes. No items may be hosted on another server or web site without express written permission from the World Maritime University. For more information, please [email protected].
Recommended Citation
Nyamoita, Beatrice, "Analysis of Kenya's transport system as service provider and gateway to the Northern Corridor" (2000).World Maritime University Dissertations. 200.
WORLD MARITIME UNIVERSITY
Malmö, Sweden
ANALYSIS OF KENYA’S TRANSPORT SYSTEM AS
SERVICE PROVIDER AND GATEWAY TO THE
NORTHERN CORRIDOR
By
BEATRICE NYAMOITA
Republic of KenyaA dissertation submitted to the World Maritime University in partial fulfilment of the requirements for the award of the degree of
MASTER OF SCIENCE
in
SHIPPING MANAGEMENT
2000
ii
DECLARATION
I certify that all the material in this dissertation that is not my own work has been identified, and that no material is included for which a degree has previously been conferred on me.
The contents of this dissertation reflect my own personal views, and are not necessarily endorsed by the University.
……… 21 August, 2000
Supervised by:
Professor Patrick Donner
Associate Professor, Shipping Management World Maritime University.
Assessor:
Professor Shuo Ma
Course Professor, Port and Shipping Management World Maritime University.
Co-assessor:
Mr Gerhardt Muller
iii
ACKNOWLEDGEMENTS
I wish to express my sincere thanks to Carl Duisberg-Gesellschaft Germany (CDG) for their generous sponsorship of the fellowship that enabled me to undertake my studies at the World Maritime University. My gratitude to Mr Francis Ogeto and John Mecha of Alpha Impex Company for nominating me to the World Maritime University and their continued advice, support and encouragement, during my studies and research of this dissertation.
My heartfelt and sincere appreciation to my course Professor Shuo Ma for his guidance throughout the study period and the assessment of this dissertation. Gratitude to professors Bernard Francou and Tor Wergeland for their selfless efforts to impart knowledge to the class and Professor Patrick Donner for his effort in class and guidance throughout the course and in the supervision of the dissertation and other members of staff who gave their contribution in one way or another.
I register my appreciation to all those colleagues that I met at the World Maritime University who turned out to be my best friends, for having known you made my life bearable, knowing you was my pleasure.
I wish to pay my tribute to my family for being there for me, the enthusiasm and tolerance and continuous advice and encouragement made my life easy during my studies away from home. Not to forget is my very special friend and companion P. Freddy for the great encouragement, sacrifice and care. To all of you, your love and the memories I carried of you made life bearable.
iv
ABSTRACT
Title of dissertation: Analysis of Kenya’s transport systems as service provider and
gateway of the Northern Corridor
Degree: MSc
This dissertation is a study of the transport systems in Kenya (Port, Rail and Road). The study seeks to look at how these systems are run in relation to offering transport services to the satisfaction of the users. A brief look is given on the current operating environment, the various institutions charged with giving services are identified, and throughput of the port is given and compared with other ports that are potential threats. The author has examined the capacities of these modes and what they offer to the domestic and landlocked countries. Analysis is made of the shippers’ expectations of the service providers as critical factors in choosing a particular transport mode.
The study identifies drawbacks in the transport system, and customs and other factors that have hindered the smooth flow of information and cargo to and from the owners rendering the systems uncompetitive. In particular, the customs clearance of goods as a way of simplifying procedures is highlighted. Particular analysis has been made of factors that may influence the cargo owner or carrier to opt for another port and the concept of multimodal transport is introduced to help in networking rather than working in isolation as a solution to offering efficient and expedited services to the users.
Conclusions are made in the last chapter as well as recommendations on the suitable measures that could be undertaken to improve these systems in order to give Kenya a competitive edge in the transport industry.
v
TABLE OF CONTENTS
Declaration ii
Acknowledgements iii
Abstract iv
Table of Contents v
List of Tables vi
List of Figures vii
List of Abbreviations viii
1 Introduction 1
1.1 Aim of study 2
1.2 Scope and methodology 3
1.3 Current operating environment 4
2 Preview of the Transport and Port systems 5
2.1 Transport infrastructure 6
2.2 Port infrastructure and equipment 7
2.3 Cargo throughput 8
2.3.1 Total cargo traffic 8
2.3.2 Dry bulk cargo 9
2.3.3 Transit traffic 10
2.3.4 Container traffic 11
2.3.5 Port productivity 13
2.3.6 Inland clearance depots 14
2.4 The Rail network 15
2.4.1 Sharing of facilities and use of block trains 17
2.4.2 The rail tracker system 17
2.4.3 Inland waterways/marine services 18
vi
2.6 Air transport 19
2.7 The Kenya pipeline 20
2.8 The Northern Transit Corridor Agreement 20
2.9 The Kenya Revenue Authority 22
3 Analysis of what the shippers expect of the service providers
3.1 The port users’ satisfaction 23
3.2 Concept of transport 24
3.3 Frequency and flexibility 25
3.4 Reliability 26
3.5 Door to door services 27
3.6 Time 27
3.7 Costs for transport 28
3.8 Safety and security 28
3.9 Environmental impact 29
3.10 Government policies 30
3.11 Value added services 30
3.12 Technology 31
4 The drawbacks in the Port, Rail and Road systems
4.1 The port of Mombasa 33
4.1.1 Management of the Port 33
4.1.2 Cargo handling equipment 34
4.1.3 Pilferage and lack of security 36
4.1.4 Surcharge and delays 37
4.1.5 Stuffing and stripping 38
4.1.6 Communication 39
4.2 Customs 39
4.2.1 Customs bond 40
vii
4.2.3 Customs clearance 41
4.2.4 The Customs long room 42
4.2.5 The Central distribution office 42
4.2.6 Customs verification 42
4.2.7 The Automated system for Customs Data 43
4.3 The Police convoy system 43
4.4 Diversion of transit goods 44
4.5 The Road 45
4.5.1 The axle load limit 46
4.6 The railway and inland waterway 47
4.6.1 Infrastructure 48
4.6.2 Locomotives and rolling stock 49
4.6.3 Human Resource 50
5 Cost Comparison of Port, Road and Rail
5.1.1 Port charges 52
5.1.2 Customs and Shore handling charges 53
5.2 Stevedoring charges 54
5.3 Transit time 55
5.4 Turnaround time 57
5.5 Road freight rates 58
5.6 The Rail freight rates 60
5.7 Clearing and Forwarding Costs 64
5.8 Container related costs 65
5.8.1 Container demurrage charges 65
5.8.2 Container deposits 66
5.9 Multimodal transport 67
viii
References 76
List of Tables
Table 1 Total cargo traffic 9 Table 2 Dry cargo traffic in the three ports 9
Table 3 Transit traffic 11
List of Figures
Figure 1 Dry Bulk 10
ix
List of Abbreviations
ACIS Advanced Cargo Information System
ASYCUDA Automated System for Customs Data
BIF Bond In Force
CFAs Clearing and Forwarding Agents
Dar Dar es Salaam.
DRC Democratic Republic of Congo
EARH East African Railways and Harbours EARC East African Railway Co-operation
EDI Electronic Data Interchange
HGV Heavy Goods Vehicles
ICD Inland Container Depots
IDA International Development Agency
IMF International Monetary fund
KNSL Kenya National Shipping Line
KPA Kenya Ports Authority
KRA Kenya Revenue Authority
KRC Kenya Railways Corporation
Ksh. Kenya Shilling
KTA Kenya Transport Association
MSA Mombasa
MT Metric tons
MTO Multimodal Transport Operator
NCTA Northern Corridor Transit Agreement
NVOMTO Non Vessel Operating Multimodal Transport Operator
RORO Roll on Roll off
x
THA Tanzania Harbours Authority
TRC Tanzania Railways Corporation
TTCA Transit Transport Co-ordination Authority
UNCTAD United Nations Commission of Trade and Development
URC Uganda Railways Corporation
US$ United States Dollar
1 CHAPTER 1
INTRODUCTION
Kenya, a transit country in the East African region is endowed with a coastal line that has a natural harbour serving the land-locked countries of Uganda, Burundi, Rwanda and Democratic Republic of Congo (DRC). Kenya serves the Northern Corridor, after the 1985 Northern Corridor Transit Agreement (NCTA) on trade was established. The port of Mombasa has gained the status as the gateway to the northern corridor countries providing shipping activities and has extended its services to the customers by the opening up of the Inland Clearance Depots in Nairobi, Kisumu and Eldoret towns.
The Kenya-Uganda railways were built a hundred years ago with the aim of opening up the East African hinterlands for trade. Today, the rail network, together with road transport have turned out to be the major modes of transport in the region. They (road and rail) account for about 70 % of the total cargo transported within the region and 94 % of the passengers ferried, while 30 % of cargo is carried either by air, pipeline or sea. (The East African, 1999).
2
railways serving a wide area extending to Uganda, Rwanda, Burundi, Northern Tanzania and the Democratic Republic of Congo.
1.1 Aim of study
The fast developments in industry and technology in the countries of the northern corridor have outgrown the capacity of the Kenyan infrastructure. This has led to violation of the maximum load limit and hence the collapse of the roads and this in turn has contributed to a strain on the budget allocation and extra costs are passed to vehicle owners through road and petrol levies. Over-dependence on road and rail transport has exposed traders to losses due to the climatic (El nino) changes that set in and destroyed the infrastructure. There are slow but on-going rehabilitation projects to improve the infrastructures. Seaports have been developed with the hope that they will be able to generate income and become sustainable. There are many problems associated with how these infrastructures are run and these have in turn affected shipping activities.
The purpose of this study is to analyse the transport systems in Kenya and the problems, which have hindered the ‘flawless and seamless’ flow of cargo to the consignees in Kenya, and the countries served by the northern corridor. These problems could threaten the port of Mombasa, as the gateway of the northern corridor since these may prompt the shipper/ the cargo owner to opt to use other routes. This could be because the shipper is not satisfied with the quality of services of the port, the documentation procedures and problems encountered while moving this cargo to the final destination either by using road or rail.
3
consignee by use of Multimodal Transport Operators. These systems cannot work in isolation to sustain and satisfy the needs of the customers.
1.2 Scope and methodology
This study has been developed through the analysis of the data that was collected from different organisations charged with offering transport services. The author availed herself of the annual reports of the rail and port institutions and literature developments in transport (sea, road and rail) in Kenya. In addition to materials from the library, the author made research on journals, periodicals and daily national newspapers on issues affecting the port and transport industry to the users’ satisfaction. Data was also collected from field studies in transport and logistics companies, shipping companies in as well as seminars and lectures conveyed/conferred at the World Maritime University. Computer spreadsheet method was used where necessary to make comparisons of statistical data.
Though the study was successful, the author was faced with problems of accessibility to statistical data of relevant information from Durban in South Africa to compare the road and rail costs and transit times, having made several attempts by email and fax. The different representatives approached for information were not willing to give data freely, especially the tariff, as this is seen to be a threat to their businesses on their competitors and, therefore, the ones who volunteered asked that the tariff should not be publicised.
4
what the shippers expect of transport operators in relation to different parameters that will influence the modal choice.
Chapter four takes up the analysis of the drawbacks in the port, road and rail and customs procedures described as ‘bottlenecks’ that have hindered the smooth flow of information and cargo with a view to discuss measures that could facilitate the movement of cargo.
Chapter five analyses the costs that are incurred in moving both the domestic and transit cargo from the ports through the road/rail or combined to the destinations in comparison with the ports of Durban and Dar es Salaam. Analysis is made of the inland transport costs as compared with those of Tanzania, Kenya’s major competitor. The study looks at ways by which these transport sectors can reduce costs by combining the transport services and hence the concept of multimodal transport and multimodal transport operator is introduced. The last chapter gives the author’s conclusions and recommendations that could facilitate trade and cargo movement.
1.3 Current operating environment
CHAPTER 2
PREVIEW OF THE TRANSPORT AND PORT SYSTEMS
The ports in East Africa continue to play a significant role in the movement of exports and imports and thus opening up the region to international trade following the liberalisation of economies of the countries in the region.
Uganda has a major port under the Uganda Railways Corporation (URC) on the shores of Lake Victoria (Port Bell). Ferry services on Lake Victoria provide intermodal transport from the ports of Mombasa and Dar es Salaam to Port Bell in Uganda. Lake Services increasingly play a major role in the movement of transit cargo with Lake Victoria serving both the northern and southern corridors.
Mombasa and Dar es Salaam are the two ports serving the East African region, the hinterlands of Kenya, Tanzania, Uganda, Rwanda, Burundi, the north-eastern part of the Democratic Republic of Congo, Zambia and Malawi. The port of Mombasa serves Uganda, Rwanda, Burundi and DRC, while Dar es Salaam serves the same countries including Zambia. Some Zambian cargo moves through the port of Durban in South Africa giving the port of Dar es Salaam competition, while the other upcoming ports of Beira and Nacala give competition on Malawi based cargo.
The ports of Mombasa and Dar es Salaam serve the hinterlands by networks of land transport systems, mainly road and rail and to some extent lake services and pipeline that take cargoes to their final destinations. 70 % of the imports and exports through the port of Mombasa are hauled over road, while 80 % of the total imports into Uganda are moved into the country by road. This clearly shows that inland transport is important to the shipping industry. This means that the status of the road and rail networks have a great effect on the quality of intermodal services the ship owners could give to the customers. The conditions in the hinterlands have an effect on the turnaround time and therfore, efficient utilisation of resources.
2 .1 Transport infrastructure
The first jetty at Kilindini was to be used mainly for the discharge of materials imported for the building of the railway line (then known as Uganda railways) through Kenya to Uganda. When the rail line construction was taking place in Kenya, there was need for a port to discharge materials for construction. Development of port facilities followed in earnest as dictated by demand. The port of Mombasa can be classed as a multi-purpose port that has no special area for handling transit cargo. The port ownership and cargo handling operations are vested in the organisation.
from the port is largely dependent on both the rail and road transport modes. If these aspects are incapacitated in any way this will interfere with the movement of cargo from the port.
2.2 The Port infrastructure and equipment
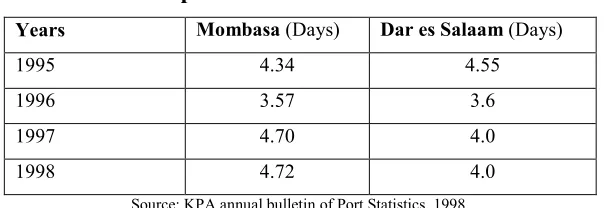
The port of Mombasa is under the management of the Kenya Ports Authority (KPA) a parastatal body of the government of Kenya. Under the KPA Act (cap.391), KPA is mandated to maintain, operate, improve and regulate the ports situated on the eastern coast of Kenya. The port of Mombasa is furnished with up to date equipment and facilities. It has a natural harbour, so the berths do not need to be dredged too often. It has well established quays and capability of handling ships of all kinds and sizes. In 1998, the port handled 1564 deep-sea vessels, all ships, were on international voyages each with average port days of 4.28 per ship.
The port of Mombasa has the following facilities,
13 deep - water general cargo berths, 3 deep - water container berths forming a fully-fledged container terminal with capacity to handle 250,000 TEUs per year.
one berth with conveyor belts for handling soda ash.
Bulk oil jetties.
Berths for handling cement, bulk molasses and tallow, edible oils and other bulk liquids.
The port of Durban is a full service, general cargo port and handles 20 % of the total traffic in South Africa. The port handles 5,000 commercial vessels yearly and brings into South Africa 26 million tons of cargo. The port of Durban being a hub port has 57 deep-water berths serviced by 21 terminals and 8 of these are container berths. The container terminals handle about 880,000 moves yearly making 14 moves per hour compared to Mombasa port that is currently making 5 moves per hour. Durban does a lot of transhipment to both ports of Dar es Salaam and Mombasa while some cargo discharged at Durban, if ferried through inland transport, is destined to the Land-locked countries served by both Tanzania and Kenya. The port operates the passenger, container, RO-RO, break-bulk and timber terminals and the rest are privately operated.
2.3 Cargo throughput
Throughput of cargo at the port of Mombasa has been, generally speaking, a function of the economic situation of the countries that use this port, the performance of the inland transport and how competitive it is in comparison with the other ports in the same region.
2.3.1 Total cargo traffic
between 1993 and 1998. Mombasa port handled a total of 8.5 million tonnes of cargo in 1998 against 8.44 million tonnes handled in 1997, this reflects an increase of 1.4%.
Table 1
Total cargo traffic (1993 – 1998)
YEAR TRAFFIC(DWT) CHANGE%
1993 7,997,000
1994 8,345,000 4.35
1995 7,973,000 -4.46
1996 8,694,000 9.04
1997 8,442,000 -2.9
1998 8,559,304 1.39
Source: KPA annual bulletin of port statistics, 1998
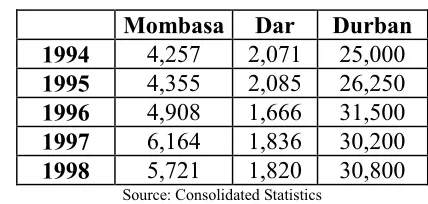
2.3.2 Dry bulk cargo
For the past five years, the port of Mombasa handled an average of 5 million metric tonnes of dry bulk cargo while the port of Dar es Salaam handled an average of 1.8 million metric tonnes and Durban handled 28.5 million metric tonnes in the same period.
Table 2
Dry Cargo Traffic in the three ports (‘000) Metric tonnes
Mombasa Dar Durban
1994 4,257 2,071 25,000
1995 4,355 2,085 26,250
1996 4,908 1,666 31,500
1997 6,164 1,836 30,200
1998 5,721 1,820 30,800
Source: Consolidated Statistics
Figure 1 2.3.3 Transit traffic
Transit traffic is increasingly becoming a major component of total port throughput. The port enjoys a large percentage of the market share of the transit traffic generated in the region over the other competing ports. When it comes to handling of transit cargo, in case of general cargo the transit cargo is stacked in the sheds separately from the local cargo. There are no dedicated facilities for the containerised transit cargo.
Transit cargo declined due to civil war/instability in the Democratic Republic of Congo and the embargo that was imposed on Burundi. Transit cargo was 1.13 million tonnes in 1998 compared to 1.34 million tonnes in 1997. A decline of 15.7% or 0.21 million tonnes was recorded (see appendix 1 for full details to different countries).
Transit traffic had grown rapidly through the port for the last five years reaching its peak at 2.8 million tonnes in 1996 compared to 1.9 million tonnes in 1995. There was, however, a decline of approximately 53 % in 1997. This was because goods landing in Mombasa had to pass through Uganda and Rwanda, which were viewed by DRC as hostile because of the presence of their troops in the nation. This gave the Ports of Dar es Salaam, Beira and Durban a favourable position with regard to cargo moving to DRC.
0 10,000 20,000 30,000 40,000
Value'000
1994 1995 1996 1997 1998
Year Dry bulk
Uganda, which imports goods through the port of Mombasa and sells in Central Africa, had to cut down imports owing to the fall in business in these countries.
Table 3
Transit traffic (1993-1998)
YEAR TRAFFIC(MT)
Mombasa
CHANGE%
1993 1,126,431
-1994 1,710,342 51.84
1995 1,936,787 13.24
1996 2,837,197 46.49
1997 1,342,554 -52.68
1998 1,126,832 -16.01
Source: KPA annual bulletin of port statistics, 1998
Amongst the transit countries, Uganda is a major user of the port of Mombasa accounting for about 23 % of the port’s total transit traffic. This is likely to increase in future due to the country’s continued recovery from the effects of war. Ugandan traffic through the port of Mombasa rose from 303,200 tonnes handled in 1991 to over one million tonnes in 1995. The Uganda traffic through the port of Mombasa still stands at one million metric tonnes compared to 95 000 metric tonnes through the port of Dar es Salaam though there are rumours that Ugandan traffic through Dar es Salaam increases by 10,000 tonnes a month.
2.3.4 Container traffic
116,537 TEU in 1998. Transhipment was at 13,263 TEU, a drop of 8,138 TEU from the 1997 figure. The increase in container traffic through the port can be associated with growth of containerisation in East Africa.
Table 4
Container Traffic (1993 – 1998)
YEAR TRAFFIC(DWT) CHANGE %
1993 144,137
-1994 160,293 11.2
1995 200,537 25.1
1996 217,028 8.2
1997 230,698 6.3
1998 248,451 7.7
Source: KPA Annual Bulletin of Port Statistics, 1998
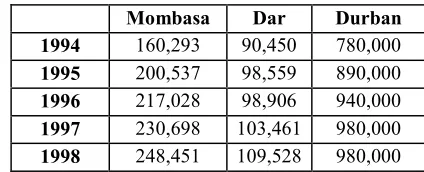
A comparison made on container traffic between the port of Mombasa and the ports of Durban and Dar es Salaam, shows that, in 1998, the port of Durban handled about 80,000 TEUs a month, while Mombasa and Dare es Salaam handled on average 20,000 TEU and 9,000 TEU a month respectively. The container traffic in Durban has increased rapidly over the years and this is because the port has a better availability of equipment and a capacity to handle one million TEUs in a year while Mombasa has a capacity to handle 250,000 TEU in a year.
Table 5
Comparison of Containerised Cargo
Mombasa Dar Durban
1994 160,293 90,450 780,000
1995 200,537 98,559 890,000
1996 217,028 98,906 940,000
1997 230,698 103,461 980,000
Figure 2
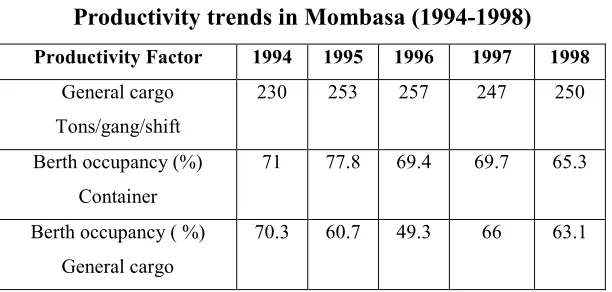
2.3.5 Port productivity
The productivity of a port is very much dependant on several factors, among them are the number of people that are employed in a gang, the type of cargo handled, the condition of the storage area, the stowage factor and the type of cargo that is being handled. The major indicators for productivity will in this case be the gang productivity.
The gang output for both general and containerised cargo has an average of 247.4 tons per gang per shift. The container productivity in Mombasa has gone down and it stands at 5 moves per hour compared to Dar es Salaam with an average of 9 moves per hour and 14 moves per hour for the port of Durban. There are, however, promises that the container moves will be improved to 10 moves per hour in Mombasa. The results are yet to be realised.
Table 6 below shows different productivity factors at the port of Mombasa for the berth occupancy for both general cargo and containerised cargo.
0 500 1,000
'000 MT
1994 1995 1996 1997 1998
Year
Containerised Cargo
Table 6
Productivity trends in Mombasa (1994-1998)
Productivity Factor 1994 1995 1996 1997 1998
General cargo Tons/gang/shift
230 253 257 247 250
Berth occupancy (%) Container
71 77.8 69.4 69.7 65.3
Berth occupancy ( %) General cargo
70.3 60.7 49.3 66 63.1
Source: KPA Bulletin of Port Statistics, 1998.
2.3.6 Inland clearance depots
In recent years the port of Mombasa has developed rail served Inland Clearance Depots (ICDs) in Nairobi with a capacity of 180,000 TEU per annum, Kisumu with a capacity of 15,000 TEU per year and Eldoret towns of Kenya. These depots are connected to the main port by road and rail. The aim of these extensions was KPA’s need to bring its services closer to the port users from the hinterlands upcountry and the landlocked countries with the dire need to cut down costs of transport.
The ICDs offer services similar to the main port but they are mainly for the distribution and consolidation of cargo. The forecasted economic benefits of these ICD’s are:
To hold in custody any container loads that were not cleared or moved to the stacking pack.
For storage of empty containers and to carry out repairs of these containers.
To ease congestion at the main port by serving the Western Kenya region, Northern Tanzania, Uganda, Rwanda, Burundi, northern DRC and southern Sudan.
Help reduce container dwell time.
To reduce transport costs and increase competition.
Market the port of Mombasa and save port users travelling time and expenses.
It is surprising that despite the fact that these depots are well known to most people, most customers prefer to clear their cargo from the main port.
2.4 The rail network
When the East African Community collapsed, Kenya Railways Corporation (KRC) was formed as a parastatal organisation for the provision of rail and marine services. The railage of goods and passengers in Kenya is still under the monopoly of KRC, following its constitution under the KRC Act ch.397, more than two decades since KRC took over from the defunct East African Railway Corporation (EARC) in 1978. The company is currently legally exempt from the provisions of the State Corporation’s Act.
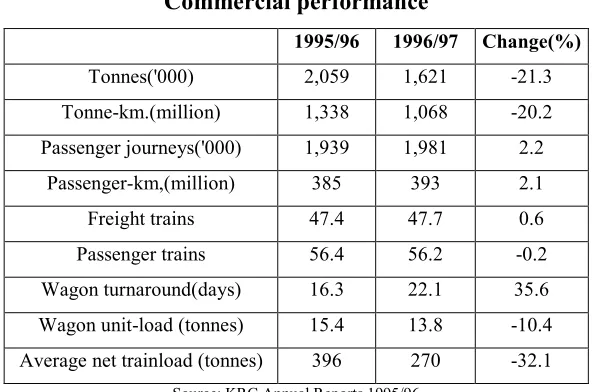
Performance of the rail transport sub sector is dependent on the management of KRC that has been greatly criticised as a ‘money-guzzling’ organisation. This is based on the argument that the corporation freight tonnage has drastically fallen over the years and stood at 1.6 million tonnes per year in comparison to 4 million tonnes reported in 1990/91. Passenger volumes have reduced as a result of the increased competition from the bus operators. In an attempt to survive, the corporation has been restructuring the work force to maintain a productive workforce of about 8,400, which now stands at 14,900.
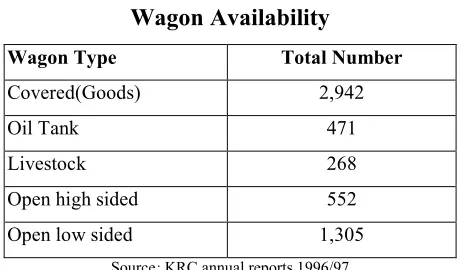
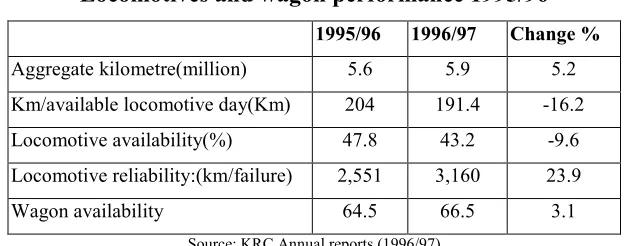
It has a network of 2,114 km of track centred on the main route from Mombasa to Nairobi and Uganda. The main line is 1083 km from Mombasa via Nairobi to Malaba linking Uganda Railways. Principal lines are Nakuru to Kisumu 216 km and Voi to Taveta 128 km. There are minor branch lines to Nanyuki 235 km, Nyahururu 77 km, Solai 42 km, Kitale 64 km and Yala/Butere 69 km. There are 198 locomotives in total both mainline and shunting locomotives, in the fleet run by the Kenya Railways. Of these, 44 are inconsequential having been stabled because repairs are very expensive and the wagon turnaround currently stands at 28 days.
Table 7 Wagon Availability
Wagon Type Total Number
Covered(Goods) 2,942
Oil Tank 471
Livestock 268
Open high sided 552
Open low sided 1,305
Source: KRC annual reports 1996/97
There are a lot of inefficiencies that can be associated with its inflexibility, poor management, ageing infrastructure as well as short-comings in the maintenance programmes of its rolling stock of both line and equipment and is, therefore, on the verge of collapse. These are discussed in depth in the preceding chapters.
Railways are Insteel (K) Limited, Roofing (U) Limited, MetalBox (K) Limited, Galsheet (K) Limited, Mukwano, Transami and freight forwarders.
The KRC implementation of the UNCTAD’s advanced cargo information system (ACIS) programme of the rail tracker system has 15 remote data capture terminals installed throughout the network to track cargo movements.
2.4.1 Sharing of facilities and the use of block trains
KRC and Uganda railways have worked out an operating system between the two corporations detailing the operational working relationship between them. The interchange of wagons and locomotives, hire charges and bias for setting transit tariffs are outlined.
KRC operates block trains from Mombasa to Kampala (Uganda). This is where a full load is moved all the way as a whole unit without breaking it or marshalling. This ensures faster transit times and easy monitoring of the train. Running of block trains also facilitates faster wagon turnaround and better utilisation of resources.
2.4.2 The rail tracker system
2.4.3 Inland waterways/ marine services
Lake Victoria is an important conduit for transit traffic to and from the landlocked countries. In Uganda, maritime transport services, provided under the Uganda Railways Corporation (URC), contribute 40% of the local revenue to the corporation. The wagon ferries on Lake Victoria are used for both cargo and passenger transport.
The Railway Corporation also governs the network via Kisumu onto Lake Victoria, an inland waterway, by wagon ferries tapping the market. The wagon ferries on Lake Victoria link Kisumu and Mwanza to Port Bell in Jinja. According to the annual report, (KPA p.8, 1997), the lake Victoria business is loss making with limited capacity. Both the passenger and cargo ferries are on the decline and, as a result, there is a small drop in the earnings on the waterway business. The ferries do not have sailing that are guaranteed on a time schedule, hence unreliability/inflexibility of this service. There is ongoing consultancy with International Development Agency (IDA) to see how the business can be sustained.
2.5 The road transport
Most transport users have turned to the road system as the rail network is on the verge of collapse. Road transport, being of a recent origin, is being used on a large scale and is the backbone of the country’s transport system for the carriage of high value general cargo. It plays a major role of complementing other modes, by distributing and collecting cargo to and from consignees/consignors not directly connected to rail or inland waterway. Most traders prefer to use the road because of the amenity en route and its quicker transit time.
own trucks for transport and trade. The truckers are under an umbrella organisation of the Kenya Transport Association (KTA). The main road network is about 151,585 kilometres, of which 8,600 kilometres is tarmacked, 27,000 kilometres is gravel and the rest is earth. 12 % of the total network are international/trunk roads, 14% are primary roads and 67 % are secondary and minor roads while 1% are special purpose roads. The major routes are Mombasa to Isebania to Mwanza and Birahamulo through Tanzania to Rwanda (1864) kilometres and Burundi (2156) kilometres with a transit time of 20 days. Another route that has a good potential and could be cost effective if well developed is the road /rail from Mombasa to Kisumu and Kemondo bay to DRC, Rwanda and Burundi, giving good intermodalism options.
The main routes for road transport from the port of Mombasa to the hinterlands and land-locked countries are Mombasa-Malaba-Kampala (mostly known as the great north road), Mombasa-Busia-Kampala, Mombasa-Isebania, through Tanzania to Rwanda and Burundi.
2.6 Air transport
Air transport is used for the high value and sensitive cargo as part of the logistics management and just-in-time inventory. The high cost of this type of transport is compensated by the low inventory that is kept in store, which reduces money locked in working capital.
a fully computerised freight terminal managed by Kenya Airfreight Handling Limited, a subsidiary of Kenya airways.
2.7 The Kenya pipeline
This is a parastatal body of the government of Kenya that was founded in 1973. The main objective was to establish an oil pipeline network. It pumps 66671cu.metre/minute through Mombasa to Nairobi, Nairobi to Eldoret and Sinendent to Kisumu at 2500 cu.metre/minute. Kenya Pipeline charges a client tariff, a return on capital for reinvestment. It also offers Oil Marketing companies a mode of transporting petrol products.
2.8 The Northern Corridor Agreement
International law, through the relevant United Nations conventions, provides the land-locked countries with the rights of access to and from the sea, as there is a need for these countries to safeguard their security and their domestic markets. There was a need for arrangements for co-operation between land-locked countries and transit countries both formal and bilateral as well as regional transit agreements and this is what brought about the Northern Corridor Transit Agreement (NCTA).
NCTA was signed in Bujumbura, Burundi in 1985 and thereafter ratified in 1986. The signing of this agreement took into account other regional arrangements like the Preferential Trade Area that was transformed into the Common Market for East and Southern Africa (COMESA) treaty recently. Transit Transport Co-ordination Authority (TTCA) programs are in total harmony with other regional and intergovernmental organisations and COMESA.
The right for the member states to transit through the territories of other member states.
Identification of transit routes and facilities.
The use of maritime port facilities.
Customs controls, documentation and procedures.
Transit transport operations by road and rail.
Handling of dangerous goods.
Assistance of foreign transit agencies and employees of member states.
Third party motor vehicle insurance.
This agreement expresses the good will and commitment to a regional approach in facilitating the smooth flow and cost effective movement of transit goods along the northern corridor. So far, the agreement has improved allocation of resources, and competition among the regional trade community. Activities of different players, governments, and donors from private sector have been facilitated through co-ordination.
NCTA addresses such main issues as the free competition from other member states by promoting market oriented policies and practices and restructuring of the transit transport sector within the northern corridor. It offers a framework for mobilisation of resources for the rehabilitation and maintenance of transit transport infrastructure within member states.
sorting out issues pertaining to logistics of transit cargo along the northern corridor and finally to the simplification of transit documentation.
2.9 The Kenya Revenue Authority
CHAPTER 3
ANALYSIS OF THE SHIPPERS’ EXPECTATIONS OF SERVICE PROVIDERS
3.1 The port users’ satisfaction
Although ports have existed as gateways of countries, beyond this, their role is to provide services to their customers. Such services will imply efficient and productive cargo transfer to and from a ship. One of the ways of achieving this is by the port management to maintain high levels of efficiency at work and their equipment. The major port users will consist of shipping lines, importers, exporters, or CFAs as their representatives, who will expect effective and efficient operations in the port because these factors will affect the final costs of cargo.
The port is therefore expected to have an operational aim to give a sufficient level of services at the lowest cost. This service level will include ship and inland transport handling rate, cargo handling at the port and better port charges and protection of the goods against theft.
Due to changing technologies, the ports should adapt to these changes to maintain their efficiency and their customers. It can be noted that port capacity and efficiency can be achieved by standardisation and maintenance of cargo handling equipment to meet the demands of various types of ships and carrying out of periodic technical surveys of equipment procurement to assess if old equipment should be done away with or replaced by modern and efficient ones.
3.2 Concept of transport
important to note that the goods are of little or no value unless they are available at the right place, at the right time and in the right form.
Transport plays an important role in facilitating trade even though it bears a heavy cost. There are effective requirements of quality and management of quality services. In the past, the transport companies were production oriented and a minute number of them have made efforts to make their services focused on the customer and the market. Today, we can see that companies are requiring more specialised logistics solutions. Companies are working hard to increase the speed of throughput and to reduce unnecessary use of resources. This implies that the suppliers have to make more frequent deliveries in small quantities and perform these deliveries on short notice. This is a challenging task to the transport providers.
The major functions of transport, as will be discussed here, will include the flow of information in connection with the transport and the physical movement of goods, that ensures that goods are moved to their destinations. This is where transport costs are accounted for and customer care is catered for.
The input involves transport directly from the customer (sometimes using a freight forwarder as an agent) to the ship’s terminal. Multimodal transport may not always satisfy the customer/shipper; the fact that there are shifts from one mode of transport to another may mean that the goods will take a longer time to reach the customer.
service paying no due regard to the time consumed on the way. On the other hand, time may be a critical factor when choosing the transport mode to use. Some customers will make more demands than others will and this means that they are willing to pay for the services. It is important to see to it that the customers, who demand less service, should pay less. A transport provider must be able to meet the different needs of the different customers.
Mueller states that any shipper makes tradeoffs between price and delivery speed. If the shipper needs an urgent delivery the next day, he is willing to pay a higher price for expedited service, whether by air or over- the- road. Service quality, however, is what the shipper is least likely to be willing to trade off. The quality of service and its reliability is what most shippers would wish to have (Mueller, 1999).
3.3 Frequency and flexibility
Individual customers will require a high degree of flexibility of transport service to meet their needs and supply and distribution of goods will need to adapt to these processes. If road haulage can be improved in Kenya, given that it is in the hands of private operators, it would meet the Just-in-time and door-to-door services could be provided to the customers.
Road transport moves cargo daily from the port, so if the port was to be operational both day and night it would ease congestion at the port. Rail transport, on the other hand, does not offer attractive transport choices to destinations over the northern corridor since the availability of this transport is poor, giving road transport a stronger edge. If the rail transport can improve the services by increasing regularity and using less time, it will have improved economic effects. First of all, it will save the time for ship turnaround and give the customer an improved transport package.
Frequent departures of a transport mode will satisfy or impress the shippers. In this case, if the service is well co-ordinated with connecting services and offer high frequencies of departures, the services would be flexible and, therefore, increase the capacity of transport. It can be seen that some transport modes are neither reliable nor flexible, they have poor connectivity. A shipper will want to use the most reliable and flexible mode in terms of price, schedule, delivery speed, frequency and route.
3.4 Reliability
From the author’s point of view of the road and rail networks in Kenya, the rail service is a less reliable service provider when compared to road services. Because of the slow wagon turnaround and poor schedules, which are not available to meet the customer’s, demands, delays are rampant giving an impression of low reliability. Rail reliability can be increased by the Kenya Railway Corporation making agreements with truckers to move more cargo/offer substitute transport in case problems arise, or by them purchasing more wagons.
3.5 Door-to-door services
capacity has not, and with no lines having been extended to the customers as yet, road haulage still takes the lead in offering door-to-door services in Kenya. The customer would therefore prefer to buy road transport because of the assurance of his goods being at his doorstep when he requires them. It is important to note at this juncture that customer satisfaction encompasses complete door-to-door service including positioning the cargo units, trucking, cargo handling, insurance, customs clearance, administration and cargo information.
3.6 Time
The value of time has greatlyincreased in this era. It is often said that time is money, therefore, a saving in time always constitutes a saving in money. The customer would demand that the goods reach him at the right time so that they do not lose their value. The road haulier can more easily give such an assurance, given that the truckers can easily access the customer’s premises. The nature of rail network will consume time because of double handling of the cargo to the customers’ doorstep by trucks.
Transport costs can be minimised or reduced by reducing the railage or haulage time, or minimising the turnaround time at the port through speeding up of both the customs and documentation procedures and reducing the hinterland lead time. Other ways that a good transport time would be achieved is by using standard containers. In addition, improving the shore and cargo handling equipment and systems, improving the handling time at port and working more hours in the day, will also achieve a better transport time.
products etc, most customers would prefer to use the road haulage because it is a fast mode.
3.7 The costs for transport
Customers demand the right cost of transport service and if, for instance transport time is longer for rail than road, it is expected that the cost for rail will be lower than the cost for road transport. Most customers who are price sensitive will be the ones who have low value cargo and they are also less sensitive to the transit time. They will tend to look for the cheapest mode of transport. However, rail services may not be able to accommodate all the customers owing to its diminishing infrastructure as discussed in chapter 4.
Cost constraints may force most customers to consider the option of changing between different modes of transport. Some customers prefer to use rail for the long haulage and road to the interior, to distribute the costs economically between the two modes, where road is often considered to be the more expensive mode. The costs may be cheaper or higher when switching between these two modes of transport.
3.8 Safety and security
Damage to cargo can occur during shifting of cargo from one mode to another. This is common with rail cargo owing to its inflexibility. The efforts that can be made to reduce the damage may have an impact on time and costs since expensive handling equipment will have to be purchased and this will make the combined transport less attractive. Customers expect that the damage caused to the cargo is minimised by an improved quality of handling and that cargo handling becomes less exposed to human error.
Security, on the other hand, raises the question of how safe the customer’s cargo is on the road or rail or even at the port. There have been many recorded incidents of short landed cargo, pilferage and theft, on the highways more than the railways. The customer will expect that his cargo be in the right form/condition/amount. Theft is rampant at the interstate checkpoints and especially when cargo documents are not in the right order and hence the cargo has to be withheld for a longer time till the right documents are processed. This is discussed further in the next chapter.
3.9 Environmental impact
People are becoming more and more serious and strict on the environment in which they dwell. Road haulage pollutes the environment both in terms of noise and air by emitting wastes. The carriage of dangerous cargo in these modes may have an impact on the environment if an accident occurred. Kenya and countries around the Great Lakes region are not very conscious about the environment, although there are set regulations on the carriage of dangerous goods, especially on the road network. The costs for carriage of these goods will be higher because of the danger they may pose to nature and environment.
would be more cost effective if they were well developed because it is friendlier to the environment because it has less emissions that pollute the air, lower energy consumption and a lesser increase of infrastructure in comparison to road.
3.10 Government policies
The government’s decision to increase capacity on the road or rail requires a lot of investments. One thing to note is that the deterioration of the road and rail networks is due to the poor management of the structures as well as the lack of capital to maintain these transport systems. The government collects petrol levy from the users but it has not been able to maintain these networks, nor is it accountable for the money. The rail on the other hand has never expanded even with the need for customers to use it. If the government were to get funds to maintain these transport systems it would take a long time to recover capital for these investments which have a poor return on investments. The interest rates would cover a large portion of the annual costs of these systems.
3.11 Value added services
“…The shipper is demanding value added services” (Mueller 1999 p.381). The satisfaction of the customer relies on the `value for money ´ or the quality for cost. Value added means the value newly created due to an economic activity. The ultimate customer service level is the one that will give the customer maximum value added. (Ma, 1999). To provide value added services, the shipper will expect the transport operator to give such services as sorting of goods, storing and labelling them, consolidation of services, warehousing, logistics planning and intermodal inland co-ordination between different players, for instance the shipping lines, road and rail carriers etc.
convenience, which means taking care of the complete transport from the time the customer calls for transport until the final delivery at the receiver’s end. Customer satisfaction should comprise a full door-to-door transport including positioning of cargo units, trucking, cargo handling, insurance, customs clearance, administration and information.
3.12 Technology
The shipper will demand to get information on the state of the cargo routing, transit routes etc. This will be effective if the technology is implemented in such a way that it is able to track cargo movement from the port through the different modes to the customer. The rail tracker system is quite effective in tracking the movement of cargo through the rail. The customers can access through their computer networks and be able to see where their cargo is. The road tracker network has not been implemented yet in Kenya and this has made it difficult for the customers to know the status of their cargo.
Today, there is an advanced use of communication technology for moving information from one place to another. This ranges from phone, fax, e-mail, Internet and Electronic Data Interchange (EDI). The customers expect that these services would be extended to the customs for clearance of goods as soon as they arrive at the port.
CHAPTER 4
DRAWBACKS IN THE PORT, ROAD AND RAIL SYSTEMS
The chapter examines the drawbacks in all the systems from port, rail and road systems and ineffective ways in handling of cargo. Transport corridors are important for the countries, especially those with the disadvantage of being land-locked. Slow growth of foreign trade in East Africa is responsible for the slurred growth of services. The fact that there are modern ships with high speed and a high carrying capacity of goods enhances external trade. A large amount of money has been invested in many projects whose goals are to enhance transport corridors.
4.1 The Port
The problems at the port of Mombasa seem to be as old as the port itself. As the Port of Mombasa strains to keep hold of its long enjoyed position as East Africa’s star port, there are still many issues to be resolved. These range from ageing equipment, inefficient management, corruption, lack of maintenance policies and spare parts and inefficiency that have influenced the transit time, the costs in transport and the customer’s expectations, which have threatened to drive away business further south.
4.1.1 Management of the port
communication.
The government, however, removed KPA from the Corporation Act giving KPA management a free hand in handling its day to day operations. This has, however, not worked well because major decisions concerning the authoritys’ operations and management are still made within the central government. This has weakened KPA’s ability to adjust to the fast growing forces of change in the market.
4.1.2 Cargo handling equipment
The maintenance of equipment is very important for the port. It is important to note that the condition of the equipment at the port has been a major concern. The port faces many deficiencies of equipment in the capacity and the productivity of this cargo handling equipment. This has led to vessel delays and longer dwell time of cargo that on most occasions leads to congestion of the port.
The port of Mombasa uses old and outdated ship to shore gantry cranes in the handling of cargo. This equipment often breaks down and the replacement or refurbishment of the cranes has been an issue of contention in the port. Taking of preventive measures other than basic measures to maintain the equipment is crucial. There is an overly low supply of equipment and spare parts, which are expensive and this slows down the work. Basic levels of maintenance of the equipment have resulted in congestion. The frequent failure of equipment has in turn had an effect on dwell time and productivity. The operations in the handling of containers in the port are slow and inefficient. One major concern is the container handling equipment that has slow speed. This has forced some vessels to use their own gear to discharge cargo at the berths near the container terminal, causing delay.
comes to capacity. The port has old inventory of equipment whose performance is low because of age. Because of inadequate numbers, it is difficult for the port to service the equipment under increasing port business.
A comparison of the productivity levels of the ports of Mombasa, Dar es Salaam and Durban reveal the following:
Table: 8
Comparison of Productivity levels
Productivity Factor MSA performance
MSA target Dar Durban Recommended
Berth occupancy 64 % - 55 % 50 % 50 %
Dwell time 22 Days 10 36 days 3 days 3 days
Moves/SSG/hour 5 15 9 14 25
Lifts/ship hour 13 20 13 25 25
Source: Consolidated from THA and KPA bulletins, 1998
When there is need for cargo handling operations, especially when transferring cargo from either the quays or yards and loading into trucks or rail wagons, there is always a shortage of equipment.
The labour force is faced with challenges as a high degree of technical expertise and skills bear a yardstick in measuring their productivity and efficiency. Gangs, who do not have good skills for the specialised maintenance and operation of the equipment, usually perform the cargo handling. The dockers have very little motivation to work and they are not well supervised and organised. This has affected the way they handle the equipment and barring the way the port equipment is performing.
the dwell time is 10 days and containers are stacked three high. In 1997 and 1998 the cargo through the container terminal was 230,698 TEU and 248,451TEU, which gives a utilisation level of 92% and 94% respectively. The recent utilisation explains why there have been high levels of congestion as can be seen in the port by the containers being stacked in non-specialised areas.
The procedures at the port of Mombasa are very slow and ineffective. The movement of cargo from the port to road transport requires 23 steps of processing documents, ranging from discharge to the shed, billing and collection of revenue, and delivery of cargo to the gate. These steps exclude the customs procedure, which has 24 steps of its own, as will be seen later in this chapter. The procedures lengthen cargo dwell time, increase the charges at the port and also increase the probability of damage to and pilferage of cargo.
Repetitive checking of papers and cargo by different authorities is very common involving physical verification, checks and cross checking of these documents, which consumes a lot of resources and time. This is because of the lack of information flow between the port users.
4.1.3 Pilferage and lack of security
The management at the port, coupled with political interference with operations of KPA, has played a major role in the decline of services and overall credibility. These range from the inadequate system of security, to ineffective handling etc. Reports have indicated that in 1995, KPA received Ksh 80 Million worth of claims lodged by shippers while the claims for missing cargo between 1991 to 1995 was US$ 2.7 million (Liganga, 1998, 7).
corrupt officials and thieves’, intent on lifting valuables from the containers. Customs officials verify containers by seeing what has been declared and ensuring that import duties, sales tax and other duties payable to the government are correct. A merit ‘men of ill’ tend to have, is when during verification, security seals are broken, goods checked and the seals are replaced by Customs. These entities will notice this lax security and take full advantage of it, after all, the only evidence of security is the seal. It is worth mentioning at this juncture that apparently officials undertake no such verification at the port of Dar es Salaam. It is also very easy for businessmen and officials to collude and falsify documents to have the goods smuggled out of the port. This happens when there is collaboration with the security that arranges to smuggle the goods out of the port without the right papers.
The problem gets worse when the port authority does not help the shipper by giving supporting documents to the loss or damage to get compensation from the insurance. The above problems can be solved if KPA embarks on computerisation and tracking of cargo and containers. The computerisation of the port that started some time ago is still not complete.
The ‘sandwiching’ of cargoes, that is, storing of both general cargo and containers at the same place at the port makes it difficult for the cargo to be traced or monitored. At the port the containers will be found packed in the available space almost everywhere amongst other general cargoes. This makes it easier for the cargo to either be damaged or be pilfered without it being tracked.
4.1.4 Surcharges and delays
This has led to persistent calls by the shippers and other players in the industry to improve the operations.
To press for efficiency in cargo handling at the port, shipping lines introduced a delay surcharge. This surcharge is aimed at helping them recover losses caused by delays. The delay in berthing ships is attributed to the long time it takes to discharge cargo. Congestion, however, is attributed to damaged road infrastructure, the rains and on going rehabilitation of some of the berths. The core problem, however, is the equipment availability and serviceability and poor management. This has an impact on both the shippers and owners in costs and some of them have resorted to use other ports.
4.1.5 Stuffing and stripping
Another cause of delay can be associated with the operations related to the stuffing and stripping of containers where the exercise is done in the open area. When it is rainy weather the exercise cannot be done since it relies on good weather conditions. The procedures with the KPA, customs and the police have very many unnecessary checks before cargo is delivered from the port. The hours for working are not harmonised between these regimes and as the police only work between 8:00 AM and 5:00 P.M verifications of containers can only be done between these hours.
The dwell time in the port is long, which results in delays and congestion. At the moment the dwell time is approximately 22 days, which is explained to be as a result of formalities at the port and dilapidated rail and road networks as well as the shippers’ or cargo owners’ delay in lodging of documents for the clearance of cargo.
does not have a capacity in space for storage of cargo and working space. Because congestion at the port is occurring frequently, the port should have contingency plans to curb or eradicate congestion from recurring.
4.1.6 Communication
Lack of communication regarding movement of cargo in port constitutes a problem. Port users have discussed inadequate interactions between themselves and the port authority because they are not well informed in advance of any changes to adjust their logistical activities. Information is usually passed through circulars, often delayed/not in real time. Shippers loose out in knowing the status of their cargo. It is common for a shipper to expect the arrival of a container, which is awaiting clearance in a terminal over a week.
There is also a great lack of proper co-ordination of activities between the port users, especially the shipping lines and clearing and forwarding agents. This is due to the poor distribution of their offices. The distance between the revenue offices of KPA and customs is about 4 kilometres, while the shipping lines and clearing and forwarding agents are located in town. The offices have poor telecommunication facilities for the co-ordination that should link them to KPA and the customs offices. Time spent to move from one office to another to be able to complete procedures that cost the cargo owners time and money.
4.2 Customs
The general purpose of various customs transit procedures is to provide the evidence that the goods have not entered, wholly or partially, the market of the transit country without paying duties and taxes (Multimodal Handbook 1995, p.74).
customs seals, escort of goods and a time limit of 90 days for the export of these goods. To start with, the time limit is currently too short given that the present documentation procedures at the port are long. The customs procedures at the port are problems related to the organisation of the services provided by the customs and especially in the road traffic at the borders, which have got high traffic levels, for instance, the borders of Namanga, Busia, Malaba and Isebania. The customs offices do not have sufficient infrastructure to serve the increasing volume of cargo traffic. Customs officials lack adequate training and morale, hence they are very inefficient. There is great corruption in this particular sector that needs to be eradicated.
Delays in documentation mainly occur when documents are lodged with the customs authorities that are reluctant in performing their duties. According to Mboya, in his survey of the ports of Mombasa and Dar es salaam, an average of 60 % of total documentation time was taken up by customs (Mboya, 1994 p.105).
4.2.1 Customs bond
4.2.2 Documentation procedures
Societe General due Surveillance in Kenya does pre-shipment inspection of cargo. The main aim is to ensure that the correct value for import duty is assessed as soon as cargo arrives. The minimum taxable import goods in Kenya is done at USD $500 in value of the goods. When one submits documents to the pre-shipment inspection company, one gets a copy of a Clean Report of Findings issued with a Tax Assessment Notice to be lodged with the customs.
4.2.3 Customs clearance procedures
The custom forms used here are the following:
C34 for transit and entry inward. This is used for goods arriving from the sea and includes the landed value of the cargo (CIF) and assessment of excise duty and VAT payable.
C35 as transit entry outward for goods leaving the country via the sea. C 35A is a COMESA document that takes the place of the road manifest. C36 bond cancellation voucher lodged after transit goods have left the country.
4.2.4 The Customs long room
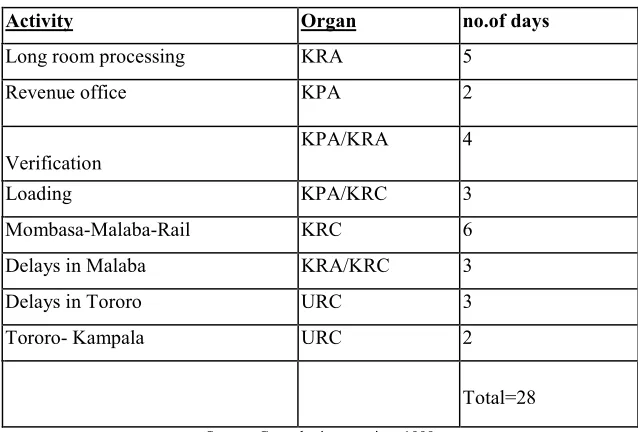
The CFA lodges the documents and they are received at the transit counter. Entry details are keyed in the computer and a pool number is allocated to each transit entry. The examining officer allocates entries to Declaration officers. At declaration, the entry is checked to confirm tariff, duty paid and BIF. If these are correct and the BIF is sufficient, the entry is passed and given to an allocating officer who numbers the entries upon confirmation of the BIF register balance and the CFA gets a copy. The messenger delivers the entries to the collection clerk dealing with transit goods for approval.
The entries will then be passed to manifest officers in accordance to the ship’s manifest where, if they correspond to the details, they are stamped and are forwarded to the Customs Distribution Office. The procedure takes on average five days.
4.2.5 The central distribution office
The senior collection clerk receives the entries accompanied by a set of MPRO and supporting documents listed for the purpose of making returns to the commissioner of customs. These documents are passed to the releasing officer who determines whether the cargo will be released directly, stopped for verification or sighted and released after ascertaining that the seal is intact. The CFA collects the forms and dispatches them to KPA port accounts where the entries and memos will be dispatched to the various sheds.
4.2.6 Customs verification
copy of the MPRO for onward releasing at KPA police station and loading bay clerks and gate pass officers and cargo is ready for delivery. It has been observed that the exercise of getting a customs official to undertake verification is difficult as they are also used for the local verification process, which is lengthier.
Analysts have concluded that with a computerised system, documents would be lodged straight into the computerised system with software that would calculate the rate for duty and VAT. Other charges for storage, penalties, handling etc would automatically be worked out. With EDI and a modern computerised system, a CFA would access KPA and lodge his documents on screen and take only the original documents for verification and stamping. This would save shippers a lot of time. This calls for the computerisation of customs and implementation of ASYCUDA.
4.2.7 The Automated System for Customs Data (ASYCUDA)
This is a computerised customs management system that covers foreign trade procedures. It handles manifests and customs declarations, accounting procedures, and imports and exports and transit procedures. It has a transit module developed by the ASYCUDA project to enhance the control of transit traffic by customs. It makes it possible for the principal, surety and designated sureties to keep track of consignments that they have guaranteed.
4.3 Police Convoy System
Transit cargo is subject to random verification by the Customs and Excise departments. The containers that are verified are delivered without the original seals affixed from the place of origin. The customs, however, fix customs seals to replace the broken ones. When cargo is released from the port, it is the duty of the police to escort it from Mombasa to the borders and from the borders onwards to the other exit border points for transit to their destinations in the hinterlands/land-locked countries. These convoys are supposed to ensure that the transit cargo is not pilfered or diverted into the local market. This objective has clearly not been achieved yet since a lot of the cargo ends up in the local market. Furthermore, it has been argued that people (military personnel/police), who do not understand the documents that accompany the cargo, man the police roadblocks. The escort takes off on particular days of the week and more so there are delays in changing escort security personnel. This is a cause of delay in delivery of cargo since it hinders the smooth movement of transit cargo instead of facilitating it.
4.4 Diversion of transit goods
This happens when there are weak customs procedures and fraudulent practices involving the players ranging from importers, port officials, customs officials, escort police, insurance firms, CFAs and transport operators. Importers, trying to evade duty, declare their goods as transit cargo. Subsequently they divert these goods into the local market at fairly cheap prices. This can happen when the insurance companies provide fake transit bonds or fraudulent CFAs provide fake documents as evidence that they comply with the clearance and export of transit cargo, while in collusion with customs officers or importers. These goods are diverted into the local market when officials involved are bribed to provide fake documents.
goods can be seized. The customs have interpreted this law to their benefit. The customs officials can delay and prevent the processing of transit documents, which leads to seizure of goods and hence they are diverted into the local market.
Transit cargo can also find its way into the local market when dishonest traders and officials delay the processing of extension dates. The customs do not have an efficient mechanism of dealing with extension requests. Traders will divert cargo with the excuse that the cargo is likely to be depreciating if they wait for extensions to be effected. These goods are sometimes released into the local market before duty and taxes have been paid.
To survive the rules regulating imports, traders have found it favourable to declare their cargo as transit cargo to evade duty and then divert it into the local market at favourable prices, all at the expense of the local industries. This greatly defrauds the Government of revenue. The law states that the trader can only be allowed to divert cargo into the local market upon payment of duty and taxes, but this law has greatly been misused by officials, who allow cargo owners, willing to divert cargo, to do so.
4.5 The Road