Harpenden, Herts, AL5 2JQ
Telephone: +44 (0)1582 763133 Web: http://www.rothamsted.ac.uk/
Rothamsted Research is a Company Limited by Guarantee Registered Office: as above. Registered in England No. 2393175. Registered Charity No. 802038. VAT No. 197 4201 51.
Rothamsted Repository Download
A - Papers appearing in refereed journals
Halmemies-Beauchet-Filleau, A., Vanhatalo, A., Toivonen, V., Heikkila,
T., Lee, M. R. F. and Shingfield, K. J. 2013. Effect of replacing grass
silage with red clover silage on ruminal lipid metabolism in lactating cows
fed diets containing a 60:40 forage-to-concentrate ratio. Journal of Dairy
Science. 96 (9), pp. 5882-5900.
The publisher's version can be accessed at:
•
https://dx.doi.org/10.3168/jds.2013-6872
The output can be accessed at:
https://repository.rothamsted.ac.uk/item/8wv2w
.
© Please contact [email protected] for copyright queries.
5882
http://dx.doi.org/ 10.3168/jds.2013-6872
© American Dairy Science Association®, 2013 .
ABSTRACT
Diets based on red clover silage (RCS) typically in-crease the concentration of polyunsaturated fatty acids (PUFA) in ruminant milk and meat compared with grass silages (GS), an effect that has been attributed to higher activity of polyphenol oxidase in red clover, promoting ruminal escape of dietary lipid. Four mul-tiparous Finnish Ayrshire cows in mid lactation fitted with rumen cannulas were used in a 4 × 4 Latin Square design with 21-d experimental periods to evaluate the effects of incremental replacement of GS with RCS on ruminal lipid metabolism, using the omasal sampling technique in combination with Cr-EDTA, Yb acetate, and indigestible neutral detergent fiber as markers. Treatments comprised total mixed rations offered ad li-bitum containing 600 g of forage/kg of diet dry matter, with RCS replacing GS in a ratio of 0:100, 33:67, 67:33, and 100:0 on a dry matter basis. Silages contained a high proportion of lipid as nonesterified fatty acids (NEFA), with no difference between forage species (75 and 73% for GS and RCS, respectively). Substitution of GS with RCS had no influence on the intakes of NEFA, polar lipid, triacylglycerol, diacylglycerol, monoacylglycerol, or total fatty acids (FA), but altered the ingestion of specific FA. Replacing GS with RCS decreased linearly 18:3n-3 and increased linearly 18:2n-6 intakes. Changes in the proportion of RCS in the diet had no effect on the amounts or on the relative proportions of differ-ent lipid fractions at the omasum. On average, NEFA, polar lipid, triacylglycerol, diacylglycerol, and mono-acylglycerol accounted for 80, 12, 4.4, 2.4, and 0.8% of total FA in omasal digesta, respectively. Replacement of GS with RCS increased linearly the amount of es-terified and noneses-terified 18:3n-3 at the omasum. Flows
of cis-9 18:1 and 18:2n-6 were also increased linearly in response to RCS in the diet, whereas 3,7,11,15-tet-ramethyl-16:0 at the omasum was decreased. Replac-ing GS with RCS in the diet decreased linearly the lipolysis of dietary esterified lipids in the rumen from 85 to 70%. Effects on lipolysis due to forage species were also associated with linear decreases in apparent ruminal 18:3n-3 biohydrogenation from 93 to 85% and a trend toward lowered biohydrogenation of cis-9 18:1 and 18:2n-6 in the rumen. However, forage species had no effect on the flow of bound phenols formed as a con-sequence of polyphenol oxidase activity at the omasum. In conclusion, despite minimal differences in the extent of lipolysis in silo, lipid and constituent FA in RCS were less susceptible to ruminal lipolysis and biohydrogena-tion compared with GS.
Key words: red clover , grass , lipolysis , biohydrogena-tion
INTRODUCTION
Meat and milk from ruminants are characterized by relatively high proportions of SFA and low amounts of PUFA, due at least in part to extensive lipolysis and biohydrogenation of dietary unsaturated FA in the rumen (Dewhurst et al., 2006; Shingfield et al., 2010). Ruminant-derived foods are an important source of lipid in the human diet (Shingfield et al., 2008b) and, therefore, increasing interest exists in developing nutritional strategies for altering the composition of ruminant milk and meat to improve long-term human health. Evidence from clinical and biomedical studies suggest that increasing milk fat 18:3n-3 and decreas-ing 12:0, 14:0, and 16:0 FA concentrations may lower cardiovascular disease risk and insulin resistance in humans without requiring a change in consumer eating habits (WHO, 2003; Shingfield et al., 2008b).
It is well established that replacing grass silage (GS) with red clover (Trifolium pratense L.) silage increases 18:2n-6 and 18:3n-3 concentration in milk (Dewhurst et al., 2006; Vanhatalo et al., 2007; Moorby et al., 2009)
Effect of replacing grass silage with red clover silage
on ruminal lipid metabolism in lactating cows fed diets
containing a 60:40 forage-to-concentrate ratio
A. Halmemies-Beauchet-Filleau ,*† A. Vanhatalo ,† V. Toivonen ,* T. Heikkilä ,* M. R. F. Lee ,‡1
and K. J. Shingfield *2
* MTT Agrifood Research Finland, Animal Production Research, FI-31600 Jokioinen, Finland
† University of Helsinki, Department of Agricultural Sciences, PO Box 28, FI-00014 University of Helsinki, Finland
‡ Institute of Biological, Environmental and Rural Sciences, Aberystwyth University, Aberystwyth, Ceredigion, SY23 3EB, United Kingdom
Received March 29, 2013. Accepted May 31, 2013.
1 Current address: School of Veterinary Science, University of
Bristol, Langford, Somerset, BS40 5DU, United Kingdom.
because of higher escape of these PUFA from the rumen (Dewhurst et al., 2003; Lee et al., 2003; 2006). How-ever, the mechanisms explaining the influence of forage species on ruminal metabolism and higher transfer of PUFA from the diet into milk are not well defined, al-though several mechanisms have been postulated (Lee et al., 2007, 2010).
Red clover has a higher polyphenol oxidase (PPO) activity compared with grasses (Van Ranst et al., 2011). Inherent differences in the activity of this enzyme have been suggested to contribute to the effects of forage species on ruminal biohydrogenation of unsaturated FA due to an inhibition of plant-mediated lipolysis arising from the formation of electrophilic quinones liberated during the action of PPO on endogenous phenols (Lee et al., 2004; Van Ranst et al., 2009b). Quinones readily react with cellular nucleophiles, resulting in the bind-ing and complexbind-ing of phenols with specific functional groups of lipid in forages, which may result in the phys-ical entrapment of forage lipid within protein-phenol matrices (Lee et al., 2010). The aim of the present study was to provide further insight into the influence of forage species on the transformations of dietary lipid in the rumen of lactating cows by examining the effects of incremental replacement of GS with RCS on the flow of bound phenols, esterified lipid fractions, and NEFA at the omasum. Four cows were used in a 4 × 4 Latin square design to test the hypothesis that the effects of RCS on milk fat composition are related to lower lipolysis and biohydrogenation of dietary unsaturated FA in the rumen as a consequence of inherent differ-ences in PPO activity between forage species.
MATERIALS AND METHODS
Forage Management
Grass silage was prepared on June 12 to 13, 2007, from primary growths of 3- and 4-yr leys of mixed tim-othy (Phleum pratense L. ‘Tuukka’) and meadow fescue
(Festuca pratensis Huds. ‘Antti’ and ‘Ilmari’). Swards
were established using a seed mixture (Boreal Plant Breeding Ltd., Jokioinen, Finland) comprising 54% timothy and 46% meadow fescue. On April 17, 2007, grass leys were fertilized per hectare with 96 kg of N, 4 kg of K, 11 kg of Ca, 4 kg of Mg, 11 kg of S, 74 g of B, and 4 g of Se. Red clover silage (RCS) was prepared on September 5, 2007, from secondary growths of single-year leys (cultivar Jokioinen; Boreal Plant Breeding Ltd.). Growth of red clover was not fertilized before cropping. Forages were grown in Jokioinen (60°49cN, 23°28cE), cut using a mower conditioner, and harvested at a DM content of 221 and 194 g/kg for grass and red clover, respectively, with a precision chop harvester, and
ensiled in bunker silos with a formic acid-based additive (760 g of formic acid and 55 g of ammonium formate, AIV 2 Plus; Kemira Ltd., Helsinki, Finland) applied at a rate of 5 L/t of fresh herbage. Mean herbage yields were 3,600 and 2,300 kg of DM/ha for grass and red clover leys, respectively. Bunker silos were opened on January 28, 2008.
Animals, Experimental Design, and Experimental Diets
All experimental procedures were approved by the National Animal Ethics Committee (Hämeenlinna, Finland) in accordance with guidelines established by the European Community Council Directives 86/609/ EEC.. Four multiparous Finnish Ayrshire cows (Bos
p. taurus; 599 ± 26.0 kg of BW, 108 ± 5.8 DIM, and
producing 30.0 ± 1.84 milk/d) fitted with rumen can-nulas (100-mm i.d.; Bar Diamond, Inc., Parma, ID) were allocated at random to experimental diets accord-ing to a 4 × 4 Latin square design with 21-d periods. Experimental treatments consisted of TMR containing 600 g of forage/kg of diet DM with RCS replacing GS in the diet in the DM ratio (RCS:GS) of 0:100, 33:67, 67:33, and 100:0. Forages were supplemented with a standard concentrate formulated to meet or exceed ME and protein requirements of lactating cows producing 35 kg of ECM/d (MTT Agrifood Research Finland, 2006). Formulation of experimental diets is presented in Table 1. Diets were offered ad libitum as 4 equal meals at 0600, 0800, 1800, and 2000 h. Cows were housed in a dedicated metabolism unit equipped with individual tie-stalls with continuous access to water and milked twice daily at 0700 and 1645 h.
Measurements and Sampling
Samples of ruminal fluid (n = 8) were collected via the rumen cannula at 1.5-h intervals starting at 0600 h on d 13 of each period, filtered through 2 layers of cheesecloth, and analyzed for pH, VFA, and ammonia-N concentrations (Halmemies-Beauchet-Filleau et al., 2013). To assess rumen protozoal numbers, a 10-mL subsample of filtered rumen fluid was taken and pre-served with 30 mL of aqueous NaCl (0.9% wt/vol) con-taining 10% (vol/vol) formaldehyde. Samples for each sampling time were composited and replicate (n = 6) measurements of protozoal numbers were made using a Fuchs-Rosenthal counting chamber (Fortuna W. G. Co., Wertheim, Germany).
Omasal digesta flow was assessed using the omasal sampling technique (Ahvenjärvi et al., 2000) and Cr-EDTA, Yb acetate, and iNDF as markers for liquid, small particles, and large particles, respectively (Shin-gfield et al., 2008a). Chromium-EDTA was prepared using standard procedures (Shingfield et al., 2008a), whereas Yb acetate was obtained from a commercial source (Dasico A/S, Birkerød, Denmark). To facilitate rapid marker equilibration in the rumen, priming doses of Cr-EDTA (1,500 mL; 590 mg of Cr) and Yb acetate (7.5 g) were administered directly into the rumen of each cow at 1800 h on d 14 of each experimental period. Following the priming dose, Cr-EDTA (1,000 mL/d) and Yb acetate (5.8 g) were dissolved in distilled water (6 L) and infused via separate infusion lines into the rumen at a constant rate for 120 h until 1800 h on d 21.
Spot samples (500 mL) of digesta entering the oma-sal canal were collected 3 times daily at 4-h intervals on d 17 through 20 using the omasal sampling device (Ahvenjärvi et al., 2000). Sampling started at 0600 h and was advanced by 1 h each day to cover a 12-h period considered representative for the entire feeding cycle. Samples were stored immediately after collec-tion at −20°C. At the end of the experiment, digesta samples were thawed in cold water, composited, and separated into large particle, small particle, and
liq-uid phases by filtration and centrifugation as outlined elsewhere (Ahvenjärvi et al., 2000). Each phase was freeze dried and stored at −20°C, whereas subsamples collected for FA and bound phenol analysis were stored at −80°C. All digesta phases were analyzed for DM, OM, Cr, Yb, and iNDF. The chemical composition of omasal digesta was determined using same methods as for feeds. Concentrations of Cr and Yb were determined by an inductively coupled plasma atomic emission spec-trophotometer (Thermo Jarrell Ash-Baird 14033700 IRIS Advantage ICOPS, Thermo Jarrell Ash Corp., Franklin, MA). Concentrations of NDF and ADF were measured in small and large particle phases, whereas the liquid phase was submitted for VFA and ammonia N determinations. Based on marker concentrations, the relative proportions of the liquid, small particle, and large particle fractions in true digesta were calculated using the digesta reconstitution technique (Ahvenjärvi et al., 2000). Thereafter, appropriate amounts of freeze-dried digesta previously stored at −80°C were weighed to yield a 20-g composite sample and submitted for bound phenol and lipid analysis.
Bound Phenol Analysis
Total protein and protein-bound phenol was deter-mined in reconstituted freeze-dried omasal digesta (ca. 500 mg of DM) using a modified Lowry/Potty assay following extraction with 2 mL of phosphate/citrate (McIlvaine buffer), pH 7.0, containing 0.5% (wt/vol) lithium dodecyl sulfate and 75 mM ascorbic acid. Ex-tracts were sonicated for 5 min, boiled for 3 min, and centrifuged at 15,000 × g for 10 min at 4°C. Soluble protein was precipitated from 1 mL of supernatant with 1 mL of 20% trichloroacetic acid and 0.4% phospho-tungstic acid, incubated for 30 min at 4°C, and cen-trifuged at 10,000 × g for 10 min at 4°C. The protein pellet, which included bound phenol, was dissolved in 6 mL of 0.1 M NaOH and analyzed for protein and
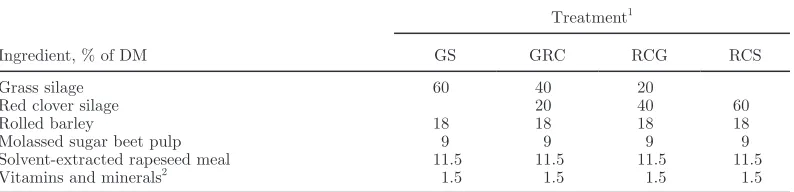
Table 1. Formulation of experimental diets
Ingredient, % of DM
Treatment1
GS GRC RCG RCS
Grass silage 60 40 20
Red clover silage 20 40 60
Rolled barley 18 18 18 18
Molassed sugar beet pulp 9 9 9 9
Solvent-extracted rapeseed meal 11.5 11.5 11.5 11.5
Vitamins and minerals2 1.5 1.5 1.5 1.5
1
GS = grass silage; RCS = red clover silage; GRC = 2:1 mixture of GS and RCS, respectively; RCG = 1:2 mixture of GS and RCS, respectively.
2
bound phenol content by running a duplicate assay in the presence and absence of copper ions using BSA as an internal standard. First, 50 μL of Lowry reagent A (0.45 M Na2CO3 and 0.17 mM sodium potassium
tar-trate in 0.14 M NaOH) was mixed with 50 μL of sample in a microplate well, and 50 μL of reagent A (including 0.15 mM CuSO4) was mixed with 50 μL of sample in a
corresponding well of a second microplate. Both plates were incubated for 10 min at room temperature, after which 50 μL of 1 N Folin-Ciocalteu reagent was added, and absorbance at 650 nm was measured (Bio-Rad Benchmark microplate reader; Bio-Rad Laboratories, Hemel Hempstead, UK) after a 30-min incubation. The assay response without copper is mainly due to the amount of bound phenol, whereas the response with copper is due to protein and bound phenol content. By estimating the protein component of the response, it was possible to calculate the concentration of bound phenol (Winters and Minchin, 2005).
Lipid Analysis
Fatty acid content of feeds and omasal digesta were determined using 13:0 in nonesterified and 23:0 in esterified form as internal standards, due to the low abundances in analyzed samples and the elution of the 13:0 and 23:0 methyl esters in the absence of interfer-ence with other FA methyl esters (FAME) during GC analysis. Following the addition of internal standards [1 mL of tridecanoic acid in absolute ethanol, N-13A, 0.1 wt/vol (Nu-Chek Prep Inc., Elysian, MN) and 0.2 mL of tritricosanoin in hexane, T-185, 0.1 wt/vol (Nu-Chek Prep Inc.)] and 3 mL of deionized water, the pH of 600 mg of freeze-dried samples of feeds and reconstituted omasal digesta was adjusted to 2.0 with 2 M hydro-chloric acid. Lipid was extracted using a mixture (12 mL; 3:2; vol/vol) of hexane and isopropanol. Extrac-tions were repeated and the organic phases recovered combined. After washing with 6 mL of deionized water and drying over anhydrous sodium sulfate, lipid in or-ganic extracts were separated into polar lipid (PL), triacylglycerol (TAG), diacylglycerol (DAG), monoac-ylglycerol (MAG), and NEFA fractions by thin-layer chromatography (Lee et al., 2004) using preparative silica plates (200 × 200 mm and 1-mm thickness; no. 1.13895.0001; Merck KGaA, Darmstadt, Germany). Plates were developed for 75 min using a mixture of hexane, diethyl ether, and acetic acid (70:30:2 vol/ vol) and the separated bands were visualized under UV light after spraying with a 0.2% (wt/vol) solution of 2c,7c-dichlorofluorescein (D-9053; Sigma-Aldrich, Helsinki, Finland) in methanol. Bands corresponding to TAG, DAG, MAG, NEFA, and PL were located using authentic tripalmitin (T-5888; Sigma-Aldrich),
1,3-dipalmitin (D-1639; Sigma-Aldrich), monopalmitin (31-1600; Larodan Fine Chemicals AB, Malmö, Swe-den), palmitic acid (N-16-A; Nu-Chek Prep Inc.), and 1,2-distearoyl-sn-glycero-3-phosphocholine (T-6517; Sigma-Aldrich) standards. Each band was removed manually from the plate and transferred to a clean test tube. Lipid was recovered from silica by rinsing twice with a mixture (1:2:1 vol/vol) of methanol, hexane, and 5% (wt/vol) aqueous sodium chloride. Extracts were dried over sodium sulfate and evaporated to dryness under oxygen-free nitrogen. Methyl esters of PL, TAG, DAG, and MAG fractions were prepared by incubation with 2 mL of hexane and 40 μL of fresh methylation re-agent (1.75 mL methanol and 0.4 mL of Na-methoxide solution; Fluka reagent 71748, Sigma-Aldrich) at 20°C for 5 min. Nonesterified FA were transesterified to FAME using 1% (vol/vol) sulfuric acid in methanol as a catalyst (Halmemies-Beauchet-Filleau et al., 2013).
Total lipid in feeds and omasal digesta were deter-mined in a separate analysis. Following the addition of 1 mL of internal standard (0.1 wt/vol of tridecanoic acid, N-13A; Nu-Check Prep Inc.; in absolute ethanol) and 1 mL of deionized water, and adjusting sample pH to 2.0 using 2 M hydrochloric acid, lipid in 100 mg of feed or omasal digesta was extracted using a mixture (4 mL; 3:2, vol/vol) of hexane and isopropanol. Extractions were repeated and both organic extracts were combined, rinsed with 2 mL of deionized water, dried using anhydrous sodium sulfate, and evaporated to dryness under a stream of oxygen-free nitrogen. The FAME of total lipid were prepared using a 2-step base-acid catalyzed procedure based on incubations with sodium methoxide in methanol, followed by 1% (vol/ vol) sulfuric acid in methanol (Halmemies-Beauchet-Filleau et al., 2013).
pa-rameters used for GC-MS analysis, and interpretation mass spectra were in accordance with earlier reports (Halmemies-Beauchet-Filleau et al., 2011). Relative re-tention time and order of elution was used to differenti-ate between diastereomers of 3,7,11,15-tetramethyl-16:0 (Halmemies-Beauchet-Filleau et al., 2013). The distri-bution of conjugated linoleic acid (CLA) isomers in omasal samples was determined using a HPLC system (model 1090; Hewlett-Packard) equipped with 4 silver-impregnated silica columns (ChromSpher 5 Lipids, 250 × 4.6 mm, 5-μm particle size; Varian Ltd., Walton-on-Thames, UK) coupled in series. Methyl esters of CLA were separated under isothermal conditions at 22°C us-ing 0.1% (vol/vol) acetonitrile in heptane at a flow rate of 1 mL/min and monitoring column effluent at 233 and 210 nm (Halmemies-Beauchet-Filleau et al., 2011).
Fatty acid composition was expressed as a weight per-centage of total FA using theoretical relative response factors (Halmemies-Beauchet-Filleau et al., 2011). Concentrations of CLA isomers were calculated based on proportionate peak area responses determined by HPLC and the sum of trans-7,cis-9 CLA, trans-8,cis-10 CLA, and cis-9,trans-11 CLA weight percentage deter-mined by GC analysis.
Calculations
Lipolysis of esterified lipid in the rumen was calcu-lated assuming negligible incorporation of 18:3n-3 in membrane lipid of rumen bacteria, protozoa, and fungi (Vlaeminck et al., 2006) as follows:
[(intake of esterified 18:3n-3, g/d − flow of esterified
18:3n-3 at the omasum, g/d)/intake
of esterified 18:3n-3, g/d] × 100.
Apparent biohydrogenation of unsaturated FA in the rumen was calculated as follows:
[(intake, g/d − flow at the omasum, g/d)/
intake, g/d] × 100.
Statistical Analysis
Data were analyzed by ANOVA with a model that included the fixed effects of treatment and period and the random effect of cow using PROC MIXED of SAS (version 9.2; SAS Institute Inc., Cary, NC). Sums of squares for treatment effects were further separated us-ing orthogonal contrasts into sus-ingle-degree-of-freedom comparisons to test for the significance of linear and
quadratic components of the response to incremental replacement of GS with RCS. Least squares means are reported, with treatment effects declared significant at
P ≤ 0.05, and P-values between 0.05 and 0.10 consid-ered a trend toward significance.
RESULTS
Distribution and Composition of Lipid in Forages and Concentrates
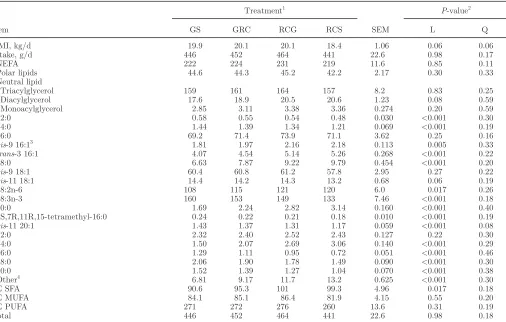
The chemical composition of experimental feeds is shown in Table 2. Both silages were well preserved and of high nutritive and fermentation quality. Total FA content or the relative distribution of lipid fractions did not differ between RCS and GS. On average, NEFA, TAG, PL, DAG, and MAG fractions accounted for 74, 11, 10, 4.8, and 0.7% of total FA in ensiled for-ages. In contrast, TAG was the major lipid fraction in concentrates, contributing to ca. 79% of total FA. Compared with GS, RCS contained lower 18:3n-3 and higher 18:2n-6 concentrations (43 vs. 52 and 22 vs. 17% of total FA, respectively; Table 3). Concentrates pre-dominated in 16:0, cis-9 18:1, and 18:2n-6 (12, 30, and 36% of total FA, respectively; Table 3).
The profile and amount of FA differed between spe-cific lipid fractions in ensiled forages (Table 3). For PL of GS and RCS, 18:3n-3 was the principal FA (on aver-age, 76%), but it was present in lower proportions for NEFA and neutral lipid fractions. Despite differences in enrichment among lipid fractions, the majority (70%) of 18:3n-3 in RCS and GS was present in nonesterified form, with smaller amounts in PL (16%). In contrast, the contribution of PL to total cis-9 18:1 and 18:2n-6 content in RCS and GS was low (3–5%). However, en-richment of 18:2n-6 in NEFA and neutral lipid fractions of silage was relatively high (13–31% of FA), whereas the abundance of cis-9 18:1 was low in all lipid frtions. For NEFA, DAG, and MAG fractions, 16:0 ac-counted for between 14 and 21% of total FA, whereas the relative enrichment in PL and TAG fractions was much lower. The abundance of S3,R7,R11,15-tetra-methyl-16:0 was higher in GS than RCS, the majority being in nonesterified form. Concentrates contained also trace amounts of S3,R7,R11,15-tetramethyl-16:0, principally as TAG.
Intake of Dietary Lipid Fractions and FA
the major source of NEFA in the diet, whereas the majority of dietary TAG originated from concentrate. Owing to differences in the FA composition of silages, incremental replacement of GS with RCS in the diet de-creased linearly (P < 0.05) the intake of 18:3n-3 (NEFA and TAG fractions) and increased linearly (P < 0.05) 18:2n-6 ingestion (NEFA, DAG, and MAG fractions; Table 4 and Figure 1). Forage species had no influence (P > 0.10) on total cis-9 18:1 intake (Table 4). Overall, the magnitude of changes in FA intake in response to the substitution of GS with RCS were relatively minor (Table 4; Supplemental Tables S1–S5; http://dx.doi. org/10.3168/jds.2013-6872).
The majority of 18:3n-3 supplied by the diet was principally in the form of NEFA, whereas the majority of 18:2n-6 was supplied as TAG and NEFA fractions (Figure 1). Furthermore, the contribution of PL to to-tal dietary intakes of 18:3n-3 was higher compared with 18:2n-6 (on average, 14–16% and 8–9%, respectively; Figure 1). Most of the cis-9 18:1 supplied by the diet was in the form of TAG (Figure 1).
Rumen Fermentation
Forage species had no effect (P > 0.10) on rumen pH, VFA concentration, or ruminal protozoal numbers. Re-placing GS with RCS in the diet decreased linearly (P
< 0.02) molar acetate, valerate, isovalerate, and capro-ate proportions, and increased linearly (P < 0.01) the molar proportion of propionate in rumen VFA (Table 5). Offering silages as a mixture tended to increase (P
= 0.07) rumen ammonia N concentrations compared with RCS or GS as sole forages (Table 5).
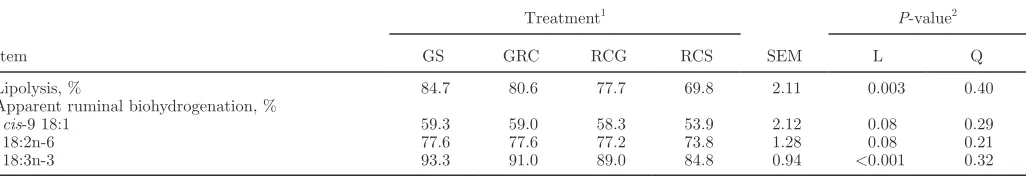
Ruminal Lipolysis and Biohydrogenation
Replacing GS with RCS decreased linearly (P < 0.01) lipolysis of dietary esterified lipids in the rumen from 85 to 70% (Table 6). Furthermore, these changes were associated with lowered (P < 0.01) 18:3n-3 bio-hydrogenation in the rumen and tended (P = 0.08) to decrease linearly the extent of ruminal cis-9 18:1 and 18:2n-6 biohydrogenation (Table 6).
Ruminal FA Balance
On average, the amount of total FA at the omasum was 164 g/d higher (Tables 4 and 7) compared with intake, due in the most part, to a net synthesis of 16:0 (24 g/d), 18-carbon FA (94 g/d), and 13- to 18-carbon odd- and branched-chain FA (OBCFA; collectively 15:0, 17:0, anteiso 13:0, 15:0, and 17:0, and iso 13:0, 14:0, 15:0, 16:0, 17:0, and 18:0) in the rumen, with no differences among treatments (P > 0.10; data not
Table 2. Chemical composition of dietary ingredients
Item
Grass silage
Red clover
silage Concentrate
pH 3.97 4.00
DM, % 23.6 23.3 89.8
In DM, %
Ash 8.72 10.3 5.27
CP 15.6 20.0 20.1
NDF 52.9 33.9 22.1
Indigestible NDF 9.82 9.16 4.30
Water-soluble carbohydrates 3.29 2.08 6.84
Lactic acid 6.32 10.1
Acetic acid 1.97 2.49
Propionic acid 0.02 0.02
Butyric acid 0.04 0.01
FA 2.32 2.43 1.96
NEFA 1.74 1.77 0.14
Polar lipid 0.23 0.23 0.20
Triacylglycerol 0.24 0.29 1.55
Diacylglycerol 0.10 0.13 0.07
Monoacylglycerol 0.02 0.02 0.01
Distribution of FA among lipid fractions, %
NEFA 74.9 72.8 7.22
Polar lipid 10.0 9.39 10.0
Triacylglycerol 10.3 11.7 78.6
Diacylglycerol 4.21 5.30 3.51
Monoacylglycerol 0.64 0.82 0.65
In total N, %
Ammonium-N 4.46 5.28
presented) other than a linear decrease (P < 0.04) in OBCFA synthesis [from 32 to 26 g/d (SE = 3.6)] when RCS replaced GS in the diet. Irrespective of forage spe-cies, ruminal disappearance of cis-9 18:1, 18:2n-6, and 18:3n-3 accounted for up to 76% of the net appearance of 18:0 and trans-18:1 at the omasum.
Bound Phenols, Lipid Fractions, and FA at the Omasum
Forage species had no significant effect (P > 0.05) on the flow of DM or bound phenols at the omasum (Table 7). Replacing GS with RCS in the diet had no substan-tial influence (P > 0.05) on the amount or on the rela-tive proportions of major lipid fractions at the omasum,
other than increasing (P < 0.02) NEFA flow when a mixture of GS and RCS were fed (Table 7). On average, NEFA, PL, TAG, DAG, and MAG fractions contributed to 80, 12, 4.4, 2.4, and 0.8% of total FA in omasal di-gesta, respectively (Table 7). Replacing GS with RCS increased linearly (P < 0.05) the flow of 18:3n-3 in all lipid fractions at the omasum (Figure 2). The majority of 18:3n-3 at the omasum was present as PL (42–46%), with smaller contributions from NEFA (22–26%), TAG (17–20%), and DAG (8–14%). Ruminal escape of MAG accounted only for 2 to 3% of total 18:3n-3 at the oma-sum (Figure 2). Substituting GS for RCS increased (P
< 0.05) linearly 18:2n-6 at the omasum (in NEFA and DAG fractions), with relatively equal contributions from NEFA, TAG, and PL fractions (Figure 2).
Table 3. Relative proportions and abundance of selected FA in nonesterified, polar, and neutral lipid fractions of dietary ingredients
Item
Grass silage Red clover silage Concentrate
% of FA g/kg of DM % of FA g/kg of DM % of FA g/kg of DM
NEFA
16:0 20.1 3.49 20.9 3.70 22.6 0.32
18:0 1.27 0.22 2.62 0.46 4.58 0.06
cis-9 18:1 3.49 0.61 3.12 0.55 21.8 0.31
18:2n-6 17.2 2.99 22.6 4.00 35.3 0.50
18:3n-3 49.9 8.68 40.1 7.09 5.11 0.07
S3,R7,R11,15-tetramethyl-16:0 0.030 0.005 0.019 0.003 0.042 0.001
Polar lipids
16:0 8.14 0.19 7.41 0.17 17.1 0.33
18:0 0.85 0.02 1.47 0.03 0.96 0.02
cis-9 18:1 1.42 0.03 1.19 0.03 23.3 0.45
18:2n-6 8.75 0.20 8.98 0.20 47.1 0.92
18:3n-3 75.5 1.76 76.2 1.74 5.98 0.12
S3,R7,R11,15-tetramethyl-16:0 0.040 0.001 0.033 0.001 0.039 0.001
Neutral lipids Triacylglycerol
16:0 7.60 0.18 10.3 0.29 10.4 1.60
18:0 1.32 0.03 2.13 0.06 1.47 0.23
cis-9 18:1 6.78 0.16 8.36 0.24 32.5 5.03
18:2n-6 24.6 0.59 27.5 0.79 34.4 5.32
18:3n-3 53.7 1.28 35.1 1.00 8.82 1.36
S3,R7,R11,15-tetramethyl-16:0 0.055 0.001 0.031 0.001 0.075 0.012
Diacylglycerol
16:0 17.3 0.17 17.0 0.22 20.2 0.14
18:0 3.32 0.03 2.90 0.04 3.56 0.03
cis-9 18:1 5.53 0.05 5.18 0.07 19.1 0.13
18:2n-6 23.9 0.23 30.7 0.40 43.7 0.30
18:3n-3 36.7 0.36 33.2 0.43 5.67 0.04
S3,R7,R11,15-tetramethyl-16:0 0.193 0.002 0.069 0.001 0.131 0.001
Monoacylglycerol
16:0 13.9 0.02 16.8 0.03 24.7 0.03
18:0 5.01 0.01 4.83 0.01 5.50 0.01
cis-9 18:1 9.45 0.01 3.92 0.01 15.9 0.02
18:2n-6 12.9 0.02 21.3 0.04 40.2 0.05
18:3n-3 34.0 0.05 34.2 0.07 3.85 0.01
S3,R7,R11,15-tetramethyl-16:0 0.430 0.001 0.204 <0.001 0.205 <0.001
Total
16:0 17.4 4.05 18.2 4.42 12.4 2.43
18:0 1.35 0.31 2.49 0.60 1.74 0.34
cis-9 18:1 3.75 0.87 3.68 0.89 30.2 5.94
18:2n-6 17.4 4.03 22.3 5.43 36.1 7.09
18:3n-3 52.2 12.1 42.5 10.3 8.13 1.60
Replacement of GS with RCS in the diet increased (P < 0.05) linearly cis-9,trans-11,cis-15 18:3 at the omasum (Table 8). For all diets, the vast majority of
cis-9,trans-11,cis-15 18:3 and isomers of CLA in omasal
digesta were present in nonesterified form (Table 8). Forage species had no effect (P > 0.05) on total CLA flow (Table 8), but altered the distribution of CLA isomers at the omasum, with cis-9,trans-11 being the most abundant CLA isomer (Table 8 and Supplemental Table S11; http://dx.doi.org/10.3168/jds.2013-6872). Substituting RCS for GS in the diet increased linearly (P < 0.03) cis-9,trans-11 CLA and decreased (P < 0.02)
trans-10,cis-12, trans-11,cis-13, and trans-9,trans-11
CLA at the omasum (Table 8 and Supplemental Table S11). Incremental replacement of GS with RCS in the diet also increased linearly (P < 0.05) the flow of several nonesterified cis 18:1 (Δ9,11,12,16) isomers
at the omasum (Supplemental Table S6), but had no significant effect (P > 0.05) on the amount of esteri-fied cis-9 18:1 at the omasum (Figure 1). Most trans
18:1 isomers were detected in omasal digesta as NEFA (94–96%), with trans-11 18:1 being the most abundant in the NEFA and esterified fractions, other than for TAG, in which trans-15 18:1 predominated (Table 8 and Supplemental Tables S6–S10). However, offering forages as a mixture increased (P ≤ 0.04) the flow of certain trans-18:1 (Δ5–8, 11) at the omasum (as NEFA and total; Table 8 and Supplemental Tables S6 and S11) compared with GS and RCS alone.
On average, 18:0 accounted for 47% of the total amount of FA at the omasum, being recovered almost exclusively (97–98%) as NEFA (Table 8). Mixtures of GS and RCS increased (P < 0.05) the flow of 18:0 (as NEFA and total; Table 8 and Figure 2) compared
Table 4. Effect of replacing grass silage with red clover silage in the diet on total FA intake in lactating cows
Item
Treatment1
SEM
P-value2
GS GRC RCG RCS L Q
DMI, kg/d 19.9 20.1 20.1 18.4 1.06 0.06 0.06
Intake, g/d 446 452 464 441 22.6 0.98 0.17
NEFA 222 224 231 219 11.6 0.85 0.11
Polar lipids 44.6 44.3 45.2 42.2 2.17 0.30 0.33
Neutral lipid
Triacylglycerol 159 161 164 157 8.2 0.83 0.25
Diacylglycerol 17.6 18.9 20.5 20.6 1.23 0.08 0.59
Monoacylglycerol 2.85 3.11 3.38 3.36 0.274 0.20 0.59
12:0 0.58 0.55 0.54 0.48 0.030 <0.001 0.30
14:0 1.44 1.39 1.34 1.21 0.069 <0.001 0.19
16:0 69.2 71.4 73.9 71.1 3.62 0.25 0.16
cis-9 16:13 1.81 1.97 2.16 2.18 0.113 0.005 0.33
trans-3 16:1 4.07 4.54 5.14 5.26 0.268 <0.001 0.22
18:0 6.63 7.87 9.22 9.79 0.454 <0.001 0.20
cis-9 18:1 60.4 60.8 61.2 57.8 2.95 0.27 0.22
cis-11 18:1 14.4 14.2 14.3 13.2 0.68 0.06 0.19
18:2n-6 108 115 121 120 6.0 0.017 0.26
18:3n-3 160 153 149 133 7.46 <0.001 0.18
20:0 1.69 2.24 2.82 3.14 0.160 <0.001 0.40
3S,7R,11R,15-tetramethyl-16:0 0.24 0.22 0.21 0.18 0.010 <0.001 0.19
cis-11 20:1 1.43 1.37 1.31 1.17 0.059 <0.001 0.08
22:0 2.32 2.40 2.52 2.43 0.127 0.22 0.30
24:0 1.50 2.07 2.69 3.06 0.140 <0.001 0.29
26:0 1.29 1.11 0.95 0.72 0.051 <0.001 0.46
28:0 2.06 1.90 1.78 1.49 0.090 <0.001 0.30
30:0 1.52 1.39 1.27 1.04 0.070 <0.001 0.38
Other4 6.81 9.17 11.7 13.2 0.625 <0.001 0.30
∑ SFA 90.6 95.3 101 99.3 4.96 0.017 0.18
∑ MUFA 84.1 85.1 86.4 81.9 4.15 0.55 0.20
∑ PUFA 271 272 276 260 13.6 0.31 0.19
Total 446 452 464 441 22.6 0.98 0.18
1Refers to diets containing a 60:40 forage:concentrate ratio based on grass silage (GS), red clover silage (RCS), or a 2:1 (GRC) or 1:2 (RCG)
mixture (DM basis) of GS and RCS, respectively.
2Significance of linear (L) and quadratic (Q) components of response to incremental replacement of GS with RCS in the diet. 3
Co-elutes with anteiso 17:0.
4Contains anteiso 13:0, iso 14:0, cis-9 14:1, 15:0, anteiso 15:0, iso 15:0, iso 16:0, cis-6+7 16:1, trans-9 16:1, 17:0, iso 17:0, iso 18:0, cis-14 18:1,
cis-9,trans-12 18:2, trans-9,cis-12 18:2, trans-9,trans-12 18:2, 18:2 double bond position and configuration indeterminate, 18:3n-6, cis-9,trans
with either forage alone. Forage species had no effect (P > 0.10) on total 16:0 at the omasum (Table 8), whereas mixtures of GS and RCS increased the flow of nonesterified 16:0 and decreased (P < 0.05) the amount of 16:0 as TAG at the omasum (Figure 2). On average, 60 to 68% of 16:0 in omasal digesta was recovered as NEFA, with 22 to 28% in the form of PL (Figure 2).
Forage species also influenced the flow of OBCFA at the omasum that were present principally in non-esterified form or as components of the PL fraction (Figure 3 and Supplemental Table S11; http://dx.doi. org/10.3168/jds.2013-6872). Substitution of GS for RCS in the diet increased in a quadratic manner (P < 0.05) 17:0 (in NEFA fraction), but decreased linearly
(P < 0.05) anteiso 17:0 (in PL and DAG fractions), iso
15:0 (in NEFA, PL, TAG, and DAG fractions), and iso
17:0 (in NEFA, PL, and DAG fractions) at the omasum (Figure 3 and Supplemental Table S11). Furthermore, replacing GS with RCS decreased linearly (P < 0.05) the flow of nonesterified and esterified (in PL and DAG fractions) S3,R7,R11,15-tetramethyl 16:0 at the oma-sum (Figure 3).
DISCUSSION
It is well established that RCS increases the flow of PUFA escaping the rumen compared with GS in lactating and growing cattle (Dewhurst et al., 2003;
Lee et al., 2003, 2006), but the mechanisms explaining this phenomenon are not known. Novel features of this experiment included a detailed assessment of all lipid fractions in omasal digesta and quantitative estimates of the contribution of nonesterified and esterified lipids to FA flows at the omasum. Furthermore, the amount of bound phenols in omasal digesta as a measure of oxidation was determined allowing inferences to be drawn on the possible influence of inherent differences in PPO activity between forage species on ruminal lipid metabolism in lactating cows.
Forage Lipid and FA Composition
Most of the lipid in grasses and legume forages is present as phospholipids and glycolipids located within thylakoid membranes of chloroplasts (Lee et al., 2009; Van Ranst et al., 2010; Buccioni et al., 2012). Typi-cally, ensiling has minimal influence on the total FA content of forages, but substantially alters the
distri-bution of FA in specific lipid fractions (Dewhurst et al., 2006; Vanhatalo et al., 2007; Van Ranst et al., 2010). Changes arising during fermentation in silo are characterized by a substantial decrease in the relative abundance of polar membrane lipid and an increase in NEFA, TAG, DAG, and MAG fractions attributable to the activity of plant and microbial lipases (Lee et al., 2004; Van Ranst et al., 2009a, 2010). For both RCS and GS, NEFA, TAG, PL, DAG, and MAG fractions accounted for, on average, 74, 11, 10, 4.8, and 0.7% of total FA, with no evidence to suggest that forage spe-cies had a major influence on the extent of lipolysis in silo. Several reports examining the ensilage of forages in laboratory-scale silos (Van Ranst et al. 2009a), bunker silos (Vanhatalo et al. 2007), or as round bales (Lee et al., 2006) have shown that RCS typically contains higher proportions of esterified lipid and lower propor-tions of NEFA than GS. Lower plant-mediated lipolysis during the ensilage of red clover than grasses has been attributed to a higher activity of PPO (Van Ranst et
Table 5. Effect of replacing grass silage with red clover silage in the diet on rumen fermentation characteristics in lactating cows
Item
Treatment1
SEM
P-value2
GS GRC RCG RCS L Q
pH 6.73 6.81 6.73 6.90 0.101 0.19 0.50
Ammonia-N, mmol/L 6.33 7.17 6.95 6.43 0.440 0.95 0.07
VFA total, mmol/L 104 105 111 110 4.9 0.25 0.73
Molar VFA proportion, mmol/mol
Acetate 657 653 646 631 5.1 0.010 0.32
Propionate 186 193 206 223 4.8 <0.001 0.30
Butyrate 111 108 105 106 2.9 0.18 0.58
Isobutyrate 9.31 8.70 8.48 8.23 0.481 0.11 0.68
Valerate 15.8 15.5 15.1 14.1 0.48 0.019 0.45
Isovalerate 14.3 14.6 12.8 13.0 0.96 0.011 0.83
Caproate 6.85 6.47 5.99 4.94 0.309 0.003 0.29
Molar ratio
Acetate:propionate 3.55 3.38 3.14 2.83 0.103 0.002 0.50
(Acetate + butyrate):propionate 4.15 3.94 3.65 3.31 0.116 <0.001 0.53
Protozoa, × 105 U/mL 3.78 3.93 3.78 3.18 0.569 0.31 0.38
1Refers to diets containing a 60:40 forage:concentrate ratio based on grass silage (GS), red clover silage (RCS), or a 2:1 (GRC) or 1:2 (RCG)
mixture (DM basis) of GS and RCS, respectively.
2Significance of linear (L) and quadratic (Q) components of response to incremental replacement of GS with RCS in the diet.
Table 6. Effect of replacing grass silage with red clover silage in the diet on ruminal lipolysis and apparent biohydrogenation of 18-carbon unsaturated FA in lactating cows
Item
Treatment1
SEM
P-value2
GS GRC RCG RCS L Q
Lipolysis, % 84.7 80.6 77.7 69.8 2.11 0.003 0.40
Apparent ruminal biohydrogenation, %
cis-9 18:1 59.3 59.0 58.3 53.9 2.12 0.08 0.29
18:2n-6 77.6 77.6 77.2 73.8 1.28 0.08 0.21
18:3n-3 93.3 91.0 89.0 84.8 0.94 <0.001 0.32
1Refers to diets containing a 60:40 forage:concentrate ratio based on grass silage (GS), red clover silage (RCS), or a 2:1 (GRC) or 1:2 (RCG)
mixture (DM basis) of GS and RCS, respectively.
al., 2011). The PPO enzyme is a stress-activated copper metalloprotein that catalyzes the oxidation of endog-enous phenols to quinones in the presence of oxygen. Quinones formed during the action of PPO are highly reactive, electrophilic molecules that may covalently modify and crosslink a variety of nucleophilic cellular constituents, such as proteins, amines, and amides (Igarashi and Yasui, 1985). Binding with specific sites on forage proteins results in the formation of protein-bound phenols (Van Ranst et al., 2011).
A lack of difference in the proportion of total FA in PL or NEFA fractions between ensiled forages in this experiment may, at least to some extent, be related to the rather long storage of RCS and GS of 22 and 34 wk, respectively, before feeding out. Over shorter storage intervals (of 16 to 18 and 19 to 21 wk), the concentration and relative abundance of NEFA in GS and RCS prepared in bunker silos, respectively, was lower compared with current measurements, whereas the proportion of esterified lipid was marginally higher for ensiled red clover than a mixture of timothy and meadow fescue (Vanhatalo et al., 2007). Activation of latent PPO through the mechanical damage of red clover has been shown to lower lipolysis during the initial few days postensiling (Van Ranst et al., 2010). However, the protection of plant lipids to lipolysis was found to diminish after 60 d in silo, possibly due to increased activity of microbial lipases (Van Ranst et al., 2010). Protection of esterified lipid via PPO-mediated denaturation of plant lipases can be expected to be limited to the first 24 h after cutting and ensiling. The
PPO enzyme has been shown to be rapidly denatured following quinone binding, such that additional lipoly-sis thereafter arises from the activities of microbial rather than plant lipases (Lee et al., 2013). In addition to forage species and duration of silage storage, other factors including cultivar, growth stage, DM content at ensiling, and the extent of fermentation in silo may also contribute to lipolysis during ensiling (Vanhatalo et al., 2007; Van Ranst et al., 2009a,b).
Irrespective of forage species, 18:3n-3 was the pre-dominant FA in PL, whereas the abundance of 16:0,
cis-9 18:1, and 18:2n-6 in PL was much lower, confirm-ing previous comparisons of parent herbage and cor-responding silages (Van Ranst et al., 2009a; Buccioni et al., 2012).
Intake of FA
Marginal differences in the consumption of FA among treatments reflected differences in the distribu-tion and composidistribu-tion of lipid fracdistribu-tions in GS and RCS and the numerical increases in DMI when GS and RCS were fed together compared with GS and RCS alone. Replacing GS with RCS has, in some cases, resulted in similar 18-carbon PUFA intakes (Vanhatalo et al., 2007), whereas in others it lowered (Dewhurst et al., 2003; Moorby et al., 2009) or increased (Lee et al., 2003, 2006, 2008) the intake of 18:3n-3. Several factors may account for these differences, including species and cultivar of red clover and grasses, maturity at ensiling, duration and extent of wilting and fermentation in silo,
Table 7. Effect of replacing grass silage with red clover silage in the diet on the amount of bound phenols in omasal digesta, distribution of FA in omasal lipid, and on the flow of FA at the omasum as NEFA, polar, and neutral lipids in lactating cows
Item
Treatment1
SEM
P-value2
GS GRC RCG RCS L Q
DM, kg/d 14.2 13.9 14.2 12.8 1.04 0.08 0.25
Bound phenols, mg/d 39.3 44.6 40.5 40.9 10.87 0.98 0.66
Lipid fraction, %
NEFA 78.3 80.6 81.5 79.0 1.15 0.56 0.08
Polar lipids 13.8 12.1 11.4 12.4 0.85 0.26 0.15
Neutral lipid
Triacylglycerol 4.54 3.95 4.04 5.15 0.318 0.21 0.033
Diacylglycerol 2.54 2.59 2.24 2.25 0.135 0.49 0.45
Monoacylglycerol 0.90 0.75 0.84 0.90 0.119 0.97 0.40
FA, g/d
NEFA 471 512 519 464 36.4 0.84 0.014
Polar lipids 81.6 76.2 72.7 73.8 6.51 0.35 0.60
Neutral lipid
Triacylglycerol 27.4 24.8 25.9 30.1 3.00 0.45 0.23
Diacylglycerol 15.3 16.4 14.4 14.9 1.51 0.54 0.80
Monoacylglycerol 5.46 4.63 5.43 5.02 0.712 0.99 0.78
Total FA 600 634 638 589 43.8 0.67 0.06
1
Refers to diets containing a 60:40 forage:concentrate ratio based on grass silage (GS), red clover silage (RCS), or a 2:1 (GRC) or 1:2 (RCG) mixture (DM basis) of GS and RCS, respectively.
2
as well as the overall influence of forage species on DMI and the composition and amount of concentrates in the diet (Boufaïed et al., 2003; Dewhurst et al., 2006).
Rumen Fermentation
Forage species had no effect on rumen pH or total VFA concentrations, whereas replacing GS with RCS in the diet shifted rumen fermentation toward the
production of propionate at the expense of acetate. Replacing GS with RCS has had no influence on ru-men ferru-mentation (Dewhurst et al., 2003; Vanhatalo et al., 2006), or promoted the formation of acetate at expense of propionate and butyrate (Vanhatalo et al., 2009) in lactating cows. Variation in the composition and fermentation characteristics of ensiled forages may, at least in part, contribute to these differences. In the present study, ensiled red clover had higher lactic
Table 8. Effect of replacing grass silage with red clover silage in the diet on the flow of nonesterified and total FA at the omasum of lactating cows
Flow, g/d
Treatment1
SEM
P-value2
GS GRC RCG RCS L Q
NEFA, g/d
12:0 0.25 0.25 0.28 0.25 0.034 0.93 0.56
14:0 1.04 1.18 1.20 1.10 0.115 0.46 0.10
16:0 56.0 63.3 67.2 62.6 4.76 0.048 0.032
cis-9 16:1 0.22 0.23 0.28 0.28 0.040 0.17 0.89
trans-9 16:1 0.01 0.00 0.01 0.01 0.004 0.93 0.19
trans-12 16:1 0.09 0.08 0.08 0.06 0.011 0.22 0.72
trans-13 16:1 0.25 0.33 0.44 0.51 0.041 <0.001 0.82
18:0 279 295 296 255 18.7 0.11 0.015
cis-9 18:1 8.84 10.4 11.3 11.6 1.163 0.013 0.34
∑ cis 18:1 15.4 18.2 19.5 19.6 2.10 0.013 0.19
trans-11 18:1 24.0 27.7 27.3 24.4 2.04 0.88 0.023
∑ trans 18:1 52.2 59.9 60.6 57.2 5.43 0.14 0.036
18:2n-6 5.67 6.89 8.30 9.78 1.002 0.005 0.86
∑ 18:23 12.4 14.7 16.1 16.7 1.77 0.014 0.40
cis-9,trans-11 CLA 1.88 1.98 2.06 2.32 0.241 0.025 0.48
∑ CLA 3.88 4.02 4.12 4.09 0.422 0.47 0.68
18:3n-3 2.38 3.23 4.21 5.28 0.560 0.003 0.80
cis-9,trans-11,cis-15 18:3 1.00 1.12 1.20 1.45 0.175 0.040 0.60
18:4n-3 1.18 1.19 1.18 1.20 0.015 0.58 0.71
20:0 4.15 5.13 5.83 5.68 0.357 <0.001 0.026
S3,R7,R11,15-tetramethyl-16:0 4.17 4.06 3.29 2.35 0.302 <0.001 0.026
R3,R7,R11,15-tetramethyl-16:0 1.53 1.86 1.96 1.78 0.094 0.07 0.025
cis-9 20:1 0.07 0.07 0.07 0.07 0.010 0.65 0.94
cis-11 20:1 0.35 0.28 0.26 0.26 0.054 0.17 0.46
trans-11 20:1 0.11 0.17 0.08 0.07 0.045 0.38 0.44
20:2n-6 0.06 0.07 0.11 0.12 0.011 <0.001 0.96
20:3n-3 0.19 0.22 0.22 0.18 0.011 0.52 0.009
20:3n-6 0.00 0.01 0.01 0.01 0.002 0.53 0.54
20:4n-3 0.00 0.00 0.00 0.01 0.005 0.22 0.35
20:4n-6 0.00 0.02 0.02 0.00 0.009 0.89 0.16
22:0 3.25 3.51 3.49 3.06 0.246 0.29 0.022
22:2n-6 0.02 0.03 0.02 0.03 0.004 0.56 0.89
24:0 2.94 3.60 4.04 3.94 0.286 <0.001 0.025
cis-15 24:1 0.88 0.78 0.61 0.38 0.043 <0.001 0.06
26:0 8.31 7.10 4.82 2.14 0.571 <0.001 0.14
28:0 4.91 4.79 4.33 2.84 0.374 <0.001 0.026
30:0 2.86 2.27 3.36 2.46 0.223 0.10 0.002
Unidentified 1.85 2.13 1.88 1.65 0.153 0.09 0.035
∑ trans 65.6 74.8 75.8 72.0 6.95 0.13 0.049
∑ SFA 380 408 411 357 26.7 0.24 0.015
∑ MUFA 70.2 80.8 82.7 79.2 7.71 0.07 0.046
∑ PUFA 20.1 23.6 26.2 28.1 2.91 0.012 0.65
Total FA, g/d
12:0 1.12 0.95 0.99 0.99 0.134 0.48 0.43
14:0 4.90 4.61 4.15 4.27 0.312 0.039 0.35
16:0 93.5 96.2 98.3 93.3 6.61 0.92 0.31
cis-9 16:1 0.60 0.59 0.66 0.65 0.071 0.35 0.95
trans-9 16:1 0.02 0.01 0.02 0.02 0.005 0.64 0.30
trans-12 16:1 0.32 0.26 0.29 0.27 0.027 0.37 0.49
trans-13 16:1 0.46 0.64 0.81 0.98 0.078 <0.001 0.98
18:0 287 302 302 261 19.1 0.09 0.017
cis-9 18:1 24.5 24.9 25.4 26.9 2.20 0.25 0.71
∑ cis 18:1 35.9 36.9 37.7 39.1 3.47 0.26 0.93
trans-11 18:1 25.8 29.2 28.8 25.8 2.05 0.92 0.025
∑ trans 18:1 55.5 62.9 63.3 59.7 5.52 0.23 0.042
18:2n-6 24.3 25.5 27.7 31.9 2.51 0.024 0.47
∑ 18:23 31.6 33.9 36.0 39.3 3.28 0.035 0.83
cis-9,trans-11 CLA 1.90 2.01 2.08 2.34 0.243 0.026 0.50
∑ CLA 3.94 4.08 4.16 4.12 0.426 0.52 0.67
18:3n-3 10.7 13.7 16.4 20.6 1.811 0.002 0.68
acid concentrations and lower amounts of NDF rela-tive to ensiled grass, which may explain the observed changes in rumen fermentation characteristics when RCS replaced GS in the diet. Isobutyrate, valerate, and isovalerate formed from fermentation of valine, proline, and leucine, respectively, as well as acetate and capro-ate are essential growth factors for certain cellulolytic rumen bacteria (Cotta and Hespell, 1986). Decreases in molar proportions of acetate, valerate, isovalerate, and caproate in response to RCS in the diet observed in the present study were accompanied by lower flows of several 15- and 17-carbon branched-chain FA and microbial NAN (data not presented) at the omasum.
Ruminal Lipolysis and Biohydrogenation
Lipolysis through the action of plant or microbial lipases is a prerequisite for biohydrogenation, a phe-nomenon that serves to minimize the toxic effects of unsaturated FA on the growth of rumen bacteria (Lourenço et al., 2010). Replacing GS with RCS pro-gressively lowered lipolysis of dietary esterified 18:3n-3 in the rumen, with the implication that the rate of NEFA release would also be decreased. Alterations in the extent of lipolysis may, at least in part, explain
the decrease in ruminal 18:3n-3 biohydrogenation when RCS replaces GS in the diet (Dewhurst et al., 2003; Lee et al., 2003, 2006). Replacing GS with RCS also lowered cis-9 18:1 and 18:2n-6 biohydrogenation, but to a much lesser extent compared with 18:3n-3, which appears to be related to differences in the abundance of these FA in PL compared with other esterified lipid fractions between forage species. Concentrates in this experiment contained low amounts of 18:3n-3, whereas total intake of 18:3n-3 from PL and TAG fractions av-eraged 22 and 25 g/d, respectively. Flows of 18:3n-3 contained in these fractions at the omasum of 7.0 and 2.8 g/d, indicate that ruminal escape of 18:3n-3 in PL was more than double than that as TAG, with evidence that RCS promoted ruminal escape of 18:3n-3 in PL and TAG fractions compared with GS.
Studies in vitro have also demonstrated lowered lipolysis of esterified lipid in red clover than grasses during incubations with rumen fluid (Lee et al., 2004, 2007; Van Ranst et al., 2010). Based on these findings it has been suggested that formation of membrane lipid entrapped in protein-bound phenol matrices could offer a physical barrier to rumen bacterial lipases (Lee et al., 2010). A lower degradability of dietary protein in the rumen, together with a decrease in hindgut N
digest-Table 8 (Continued). Effect of replacing grass silage with red clover silage in the diet on the flow of nonesterified and total FA at the omasum of lactating cows
Flow, g/d
Treatment1
SEM
P-value2
GS GRC RCG RCS L Q
cis-9,trans-11,cis-15 18:3 1.03 1.13 1.21 1.45 0.176 0.046 0.60
18:4n-3 0.19 0.20 0.19 0.20 0.015 0.48 0.85
20:0 4.47 5.47 6.21 6.11 0.387 <0.001 0.040
S3,R7,R11,15-tetramethyl-16:0 4.64 4.49 3.66 2.66 0.319 <0.001 0.026
R3,R7,R11,15-tetramethyl-16:0 1.61 1.94 2.02 1.85 0.097 0.09 0.025
cis-9 20:1 0.09 0.09 0.09 0.08 0.012 0.93 0.76
cis-11 20:1 0.55 0.43 0.41 0.46 0.091 0.45 0.32
trans-11 20:1 0.11 0.19 0.09 0.08 0.046 0.36 0.44
20:2n-6 0.11 0.13 0.18 0.19 0.015 <0.001 0.90
20:3n-3 0.30 0.34 0.33 0.29 0.018 0.47 0.036
20:3n-6 0.04 0.04 0.04 0.05 0.006 0.09 0.68
20:4n-3 0.00 0.00 0.00 0.01 0.005 0.20 0.36
20:4n-6 0.01 0.02 0.03 0.01 0.009 0.75 0.17
22:0 3.53 3.82 3.82 3.42 0.266 0.57 0.026
22:2n-6 0.03 0.03 0.03 0.03 0.004 0.70 0.88
24:0 3.23 3.98 4.41 4.41 0.329 <0.001 0.041
cis-15 24:1 1.03 0.92 0.73 0.48 0.050 <0.001 0.06
26:0 8.45 7.23 4.94 2.25 0.572 <0.001 0.14
28:0 5.05 4.93 4.44 2.91 0.378 <0.001 0.23
30:0 3.01 3.44 3.50 2.57 0.225 0.07 0.002
Unidentified 1.90 2.19 1.94 1.69 0.158 0.09 0.030
∑ trans 66.2 75.0 75.5 71.7 6.75 0.19 0.049
∑ SFA 457 477 474 419 30.3 0.09 0.027
∑ MUFA 95.4 104 105 103 9.27 0.24 0.23
∑ PUFA 46.1 51.7 56.7 64.6 5.41 0.009 0.75
1
Refers to diets containing a 60:40 forage:concentrate ratio based on grass silage (GS), red clover silage (RCS), or a 2:1 (GRC) or 1:2 (RCG) mixture (DM basis) of GS and RCS, respectively.
2
Significance of linear (L) and quadratic (Q) components of response to incremental replacement of GS with RCS in the diet.
ibility when RCS replaced GS (data not presented), would tend to support a mechanism involving protein complexing. Bound phenols are widely used as a proxy of PPO activity and oxidation both in silo and in the rumen (Lee et al., 2004, 2009), with higher concentra-tions reported in red clover compared with grasses (Van Ranst et al., 2009b). Flows of bound phenols at the omasum did not differ among treatments, which, combined with similar lipolysis in silo for RCS and GS, suggest that products of PPO were not a major fac-tor contributing to the influence of forage species on ruminal lipolysis in the present experiment. However, measurements of bound phenol can potentially under-estimate PPO activity due to the lowered solubility of protein bound phenol or result in overestimates in the presence of high concentrations of free phenols such as phenolic amino acids and plant phenols (e.g., phaselic acid and clovamide; Lee et al., 2013). It is, therefore, difficult to draw definitive conclusions on the possible role of PPO on the observed differences between forage species on ruminal lipid metabolism, solely on the basis of bound phenols at the omasum.
Lowered lipolysis with RCS in the diet may also oc-cur due to decreases in rumen retention time of forage particles. The rate of DM outflow from the rumen has been reported to be higher for RCS-containing diets compared with GS (Dewhurst et al., 2003). More re-cent investigations have also indicated increased rumi-nal potentially digestible NDF passage and digestion rates for diets based on RCS than GS (Kuoppala et al., 2009; Bayat et al., 2010). These observations highlight the possibility that changes in ruminal digestion kinet-ics may also contribute to higher ruminal escape of di-etary PUFA in lactating cows fed diets based on RCS. Nevertheless, biohydrogenation of unsaturated FA has been demonstrated to be consistently lower for red clover than grasses during incubations with ruminal fluid (Lee et al., 2007; Van Ranst et al., 2010), which would infer some form of protection from metabolism in the rumen, other than simple differences in ruminal outflow rate.
Forage species may also alter the distribution of feed particles in the rumen, with higher proportions of small particles (<0.038 mm) being reported in cows fed RCS than GS (Bayat et al., 2010). Earlier studies reported no difference in rumen particle size distribution in cows offered GS and RCS (Dewhurst et al., 2003), but these observations were made on the basis of a wider range in the size of small particles (<0.106 mm) compared with subsequent investigations. In addition to ruminal escape, substantial decreases in the forage particle size may inhibit the adherence of ruminal bacteria (Buc-cioni et al., 2012), with feed particles being the active site for biohydrogenation in the rumen (Harfoot and
Hazlewood, 1988) or promote the ingestion of chloro-plasts by rumen protozoa. Protozoa contain relatively high amounts of unsaturated FA (Lourenço et al., 2010) and thereby represent a means of redirecting dietary lipids from extensive lipolysis and biohydrogenation in the rumen. However, the selective retention of protozoa in the rumen, particularly on high-forage diets (Huws et al., 2012), suggests that other mechanisms are much more likely to account for the effects of forage species on ruminal lipid metabolism.
Ruminal Balance of FA
On all diets, the flow of FA at the omasum exceeded intake consistent with a net gain due to the microbial FA synthesis de novo in cattle fed diets containing low amounts of lipid (Doreau and Ferlay, 1994; Vlaeminck et al., 2006; Schmidely et al., 2008). Flow of 16:0 in PL exceeded intake by ca. 17 to 21 g/d, indicating incorporation of 16:0 from the diet into microbial mem-brane lipids or synthesis of 16:0 de novo by ruminal bacteria, or both (Doreau and Ferlay, 1994; Vlaeminck et al., 2006). Comparison of the intake and flow at the omasum of FA in PL also indicate that several trans
18-carbon biohydrogenation intermediates may serve as substrates for incorporation into microbial lipid mem-branes. Forage species had limited influence on ruminal FA balance, other than lowered synthesis of certain OBCFA (15:0, 17:0, iso 13:0, 14:0, 15:0, 16:0, 17:0, and 18:0, and anteiso 13:0, 15:0, and 17:0) in response to RCS inclusion in the diet, and a numerically higher net 18-carbon FA balance when RCS and GS were fed as a mixture than when offered separately. In growing cattle, FA at the duodenum have been in some (Lee et al., 2003, 2006), but not in all, cases (Lee et al., 2008) lower than intake on diets containing RCS.
Flow of Lipid and FA at the Omasum
re-ports in the literature (Harfoot and Hazlewood, 1988). Extensive hydrolysis of TAG also explains marginal in-creases in postruminal flow of all cis unsaturated PUFA when plant oils and processed oilseeds are fed (Doreau and Ferlay, 1994; Glasser et al., 2008).
Most of the 18-carbon all-cis unsaturated FA at the omasum escaped the rumen as components of esterified lipid fractions, whereas their biohydrogenation inter-mediates trans-18:1, non-methylene-interrupted 18:2, and CLA and end product 18:0 were almost exclusively in nonesterified form. Earlier investigations have also reported that the majority of 18-carbon all-cis unsatu-rated FA at the omasum or duodenum are esterified (Atkinson et al., 2006; Halmemies-Beauchet-Filleau et al., 2013). These findings indicate that increases in PUFA supply arise principally from dietary lipid escap-ing lipolysis rather than biohydrogenation in the rumen.
FA. Replacing GS with RCS resulted in progressive increases in the amount of 18:3n-3 in all lipid fractions at the omasum. Irrespective of forage species, ca. 43% of 18:3n-3 at the omasum was in the form of PL, suggest-ing that a significant part of 18:3n-3 escaped the rumen as a component of chloroplast membranes. Substitu-tion of GS for RCS in the diet also increased cis-9 18:1 and 18:2n-6 at the omasum, principally due to higher ruminal escape of these FA in nonesterified form. It seems that the reasons for higher escape of cis-9 18:1 and 18:2n-6 in NEFA compared with 18:3n-3 is related to the distribution of these FA in forage lipids, and the relatively high abundance of cis-9 18:1 and 18:2n-6 in TAG of concentrate ingredients. Furthermore, ruminal biohydrogenation of cis-9 18:1 and, to a lesser extent 18:2n-6, is often lower than that of 18:3n-3 (Glasser et al., 2008) possibly due to preferential storage of these FA in the vacuoles of rumen bacteria (Bauchart et al., 1990) or direct incorporation into membrane lipid of the rumen microbes (Doreau and Ferlay, 1994; Vlae-minck et al., 2006).
Overall, the influence of forage species on ruminal metabolism of 18-carbon unsaturated FA was due, in the most part, to lowered lipolysis of esterified lipid in ensiled red clover compared with a mixture of grasses. Rates at which NEFA were released in the rumen were not measured, but it seems plausible that differences in lipolysis would also influence the kinetics of ruminal biohydrogenation. Increases in cis-9,trans-11 CLA and
cis-9,trans-11,cis-15 18:3 at the omasum suggest that
the initial isomerization of 18:2n-6 and 18:3n-3, the reduction of primary biohydrogenation intermediates, or possibly both occur at a much lower rate when RCS replaces GS in the diet. Earlier investigations have re-ported that RCS increases cis-9,trans-11 CLA accumu-lation in vitro (Loor et al., 2003) or at the duodenum in
lactating cows (Dewhurst et al., 2003) compared with GS. However, it remains unclear whether the differ-ences in the profile of biohydrogenation intermediates is solely a function of altered lipolysis or a reflection of a much broader influence of forage species on rumi-nal digestion kinetics and passage rates. Nevertheless, current measurements offer no support that following initial isomerization, nonesterified 18-carbon PUFA are less susceptible to biohydrogenation when RCS replaces GS in the diet. In the current experiment, mixtures of GS and RCS resulted in higher flows of 18:0, several
trans 18:1 (Δ5–8, 11), and trans-11,cis-15 18:2 at the
omasum than when RCS or GS was the sole forage in the diet, which may, at least in part, be associated with the positive associative effects on intake.
Compared with GS, RCS also increased the amount of nonesterified cis-18:1 (Δ11,12) and trans-18:1 (Δ12–16) at the omasum, that were associated with concomitant decreases in trans-10,cis-12 CLA, trans-11,cis-13 CLA,
and trans-9,trans-11 CLA, suggesting subtle changes
in the relative importance of minor biohydrogenation pathways between forage species. Such differences, al-though small, may reflect the influence of forage species on ruminal lipolysis, passage rate, or microbial ecology. Recent studies have shown that replacing GS with RCS alters the diversity and abundance of ruminal bacteria capable of lipolysis and biohydrogenation (Huws et al., 2010). Replacing GS with RCS in the diet increased 17:0 and decreased iso 15:0 and iso 17:0 at the omasum, confirming earlier observations in growing cattle (Lee et al., 2008). Based on differences in the FA composi-tion of rumen bacteria, it has been suggested that the amount of iso 15:0 and iso 17:0 in ruminal contents could serve as a marker of Ruminococcus flavefaciens
and Butyrivibrio fibrisolvens populations (Vlaeminck et
al., 2006), the latter exhibiting phospholipatic activ-ity and responsible for biohydrogenation in the rumen (Lourenço et al., 2010).
CONCLUSIONS
Replacing GS with RCS in the diet increased the flow of 18:2n-6 and 18:3n-3 and modified the relative abundance of specific biohydrogenation intermediates at the omasum, changes that were associated with de-creases in the lipolysis of esterified lipids in the rumen. The majority of 18:2n-6 and 18:3n-3 at the omasum originated from ruminal escape of polar and neutral lipid, suggesting that the influence of forage species may be mediated via several interrelated mechanisms, including possible formation of protein complexes as a consequence of PPO activity, alterations in digestion kinetics and forage particle size distribution in the ru-men, and ruminal microbial ecology.
ACKNOWLEDGMENTS
The authors gratefully acknowledge the contribu-tion of staff at the metabolism unit of MTT Agrifood Research Finland (Jokioinen, Finland) for the care of experimental animals and the collection of experimen-tal samples under the supervision of Laila Hakkara-inen, and chemical analysis undertaken in the MTT laboratory under the guidance of Taina Jalava. Valued contributions of Minna Aalto, Tuija Hakala, and Heidi Leskinen at MTT, and those of Gonzalo Hervás and Pi-lar de Frutos (CSIC-ULE, León, Spain) to lipid sample analyses are very much appreciated. This work was supported in part by the Finnish Funding Agency for Technology and Innovation (Helsinki, Finland), Valio Ltd. (Helsinki, Finland), Raisio Feed Ltd. (Raisio, Finland), and Kemira Ltd. (Helsinki, Finland), and a PhD studentship from the Raisio Science Foundation (Raisio, Finland).
REFERENCES
Ahvenjärvi, S., A. Vanhatalo, P. Huhtanen, and T. Varvikko. 2000. Determination of reticulo-rumen and whole-stomach digestion in lactating cows by omasal canal or duodenal sampling. Br. J. Nutr. 83:67–77.
Atkinson, R. L., E. J. Scholljegerdes, S. L. Lake, V. Nayigihugu, B. W. Hess, and D. C. Rule. 2006. Site and extent of digestion, duode-nal flow, and intestiduode-nal disappearance of total and esterified fatty acids in sheep fed a concentrate diet supplemented with high-linoleate safflower oil. J. Anim. Sci. 84:387–396.
Bauchart, D., F. Legay-Carmier, M. Doreau, and B. Gaillard. 1990. Lipid metabolism of liquid-associated and solid-adherent bacteria in rumen contents of dairy cows offered lipid-supplemented diets. Br. J. Nutr. 63:563–578.
Bayat, A., M. Rinne, K. Kuoppala, S. Ahvenjärvi, A. Vanhatalo, and P. Huhtanen. 2010. Ruminal large and small particle kinetics in dairy cows fed red clover and grass silages harvested at two stages of growth. Anim. Feed Sci. Technol. 155:86–98.
Boufaïed, H., P. Y. Chouinard, G. F. Tremblay, H. V. Petit, R. Mi-chaud, and G. Bélanger. 2003. Fatty acids in forages. I. Factors affecting concentrations. Can. J. Anim. Sci. 83:501–511.
Buccioni, A., M. Decandia, S. Minieri, G. Molle, and A. Cabiddu. 2012. Lipid metabolism in the rumen: New insights on lipolysis and biohydrogenation with an emphasis on the role of endogenous plant factors. Anim. Feed Sci. Technol. 174:1–25.
Cotta, M. A., and R. B. Hespell. 1986. Protein and amino acid me-tabolism of rumen bacteria. Pages 122–136 in Control of Digestion and Metabolism in Ruminants. L. P. Milligan, W. L., Grovum, A. Dobson, ed. Prentice Hall, Englewood Cliffs, NJ.
Dewhurst, R. J., R. T. Evans, N. D. Scollan, J. M. Moorby, R. J. Merry, and R. J. Wilkins. 2003. Comparison of grass and legume silages for milk production. 2. In vivo and in sacco evaluations of rumen function. J. Dairy Sci. 86:2612–2621.
Dewhurst, R. J., K. J. Shingfield, M. R. F. Lee, and N. D. Scollan. 2006. Increasing the concentrations of beneficial fatty acids in milk produced by dairy cows in high-forage systems. Anim. Feed Sci. Technol. 131:168–206.
Doreau, M., and A. Ferlay. 1994. Digestion and utilisation of fatty acids by ruminants. Anim. Feed Sci. Technol. 45:379–396. Glasser, F., P. Schmidely, D. Sauvant, and M. Doreau. 2008. Digestion
of fatty acids in ruminants: A meta-analysis of flows and variation factors: 2. C18 fatty acids. Animal 2:691–704.
Halmemies-Beauchet-Filleau, A., P. Kairenius, S. Ahvenjärvi, L. K. Crosley, S. Muetzel, P. Huhtanen, A. Vanhatalo, V. Toivonen, R. J. Wallace, and K. J. Shingfield. 2013. Effect of forage conserva-tion method on ruminal lipid metabolism and microbial ecology in lactating cows fed diets containing a 60:40 forage-to-concentrate ratio. J. Dairy Sci. 96:2428–2447.
Halmemies-Beauchet-Filleau, A., T. Kokkonen, A.-M. Lampi, V. Toivonen, K. J. Shingfield, and A. Vanhatalo. 2011. Effect of plant oils and camelina expeller on milk fatty acid composition in lac-tating cows fed diets based on red clover silage. J. Dairy Sci. 94:4413–4430.
Harfoot, C. G., and G. P. Hazlewood. 1988. Lipid metabolism in the rumen. Pages 285–322 in The Rumen Microbial Ecosystem. P. N. Hobson, ed. Elsevier Science, London, UK.
Huws, S. A., E. J. Kim, A. H. Kingston-Smith, M. R. F. Lee, M. B. Scott, J. K. S. Tweed, and N. D. Scollan. 2012. Ruminal protozoal contribution to the duodenal flow of fatty acids following feeding of steers on forages differing in chloroplast content. Br. J. Nutr. 108:2207–2214.
Huws, S. A., M. R. F. Lee, S. M. Muetzel, M. B. Scott, and R. J. Wal-lace. 2010. Forage type and fish oil causes shifts in rumen bacterial diversity. FEMS Microbiol. Ecol. 73:396–407.
Igarashi, K., and T. Yasui. 1985. Oxidation of free methionine and methionine residues in protein involved in the browning reaction of phenolic compounds. Agric. Biol. Chem. 49:2309–2315.
Kuoppala, K., S. Ahvenjärvi, M. Rinne, and A. Vanhatalo. 2009. Ef-fects of feeding grass or red clover silage cut at two maturity stages in dairy cows. 2. Dry matter intake and cell wall digestion kinetics. J. Dairy Sci. 92:5634–5644.
Lee, M. R. F., P. L. Connelly, J. K. S. Tweed, R. J. Dewhurst, R. J. Merry, and N. D. Scollan. 2006. Effects of high-sugar ryegrass si-lage and mixtures with red clover sisi-lage on ruminant digestion. 2. Lipids. J. Anim. Sci. 84:3061–3070.
Lee, M. R. F., L. J. Harris, R. J. Dewhurst, R. J. Merry, and N. D. Scollan. 2003. The effect of clover silages on long chain fatty acid rumen transformations and digestion in beef steers. Anim. Sci. 76:491–501.
Lee, M. R. F., L. J. Parfitt, N. D. Scollan, and F. R. Minchin. 2007. Lipolysis in red clover with different polyphenol oxidase activities in the presence and absence of rumen fluid. J. Sci. Food Agric. 87:1308–1314.
Lee, M. R. F., K. J. Shingfield, J. K. S. Tweed, V. Toivonen, S. A. Huws, and N. D. Scollan. 2008. Effect of fish oil on ruminal biohy-drogenation of C18 unsaturated fatty acids in steers fed grass or red clover silages. Animal 2:1859–1869.
Lee, M. R. F., J. K. S. Tweed, A. Cookson, and M. L. Sullivan. 2010. Immunogold labelling to localize polyphenol oxidase (PPO) during wilting of red clover leaf tissue and the effect of removing cellular matrices on PPO’s protection of glycerol-based lipid in the rumen. J. Sci. Food Agric. 90:503–510.