Diversity of agronomic and morphological traits in a mutant
population of bread wheat studied in the Healthgrain
program
M. Rakszegi• B. N. Kisgyo¨rgy•K. Tearall• P. R. Shewry•L. La´ng•A. Phillips•Z. Bed}o
Received: 17 July 2009 / Accepted: 3 February 2010 / Published online: 13 February 2010 ÓSpringer Science+Business Media B.V. 2010
Abstract A mutant population of spring wheat cv. Cadenza was produced at Rothamsted Research in 2004–5, both for TILLING and to generate variation in the contents of phytochemical components studied in the Healthgrain program. The agronomic and morphological properties of this mutant hexaploid wheat population (generations M3–M6) were studied in
a 3-year field experiment. Most of the traits were scored according to UPOV TG/3/11, namely the time of ear emergence, plant height, ear glaucosity, shape, density and length, presence of awns and scurs, seasonal type, and grain colour. Other characters such as visible mutant phenotypes, ear sterility, heteroge-neity of head rows, leaf colour and responses to powdery mildew and leaf rust were also studied. Variation in certain breadmaking quality parameters was also studied. The EMS mutant Cadenza lines studied showed wide diversity in terms of morpholog-ical and agronomic properties. The variation in agro-nomic properties was lower in 2007 and 2008 than in 2006, partly because of the SSD (single seed descent) in the M4generation and partly because of the loss of
late heading genotypes. The diversity was lowest in 2007, probably due to the extremely dry weather.
Keywords MutationTriticum aestivum TILLING population Phenotyping
Introduction
The exploitation of natural or induced genetic diversity is an established strategy for the improve-ment of major food crops, and the use of mutagenesis to create novel variation is particularly valuable in crops with restricted genetic variability. Polyploid species, such as wheat, have very high tolerance of mutations due to the complementation of essential genes by homoeologous copies, and smaller popula-tions are therefore required for saturation than with diploid species. However, as a consequence of this genetic buffering by homoeologous copies, the range and severity of phenotypes in a mutant population may also be limited. The aim of this work was to examine the range of phenotypic diversity achievable by mutagenesis in hexaploid wheat.
Mutations can be induced using physical or chemical mutagens. Physical mutagenesis, by irradiation with non-ionizing (e.g. UV) or ionizing (e.g. X and gamma rays, alpha and beta rays, fast and slow neutrons) radiation, often results in the large-scale deletion of DNA and visual effects on chromosome structure. In contrast, chemical mutagens predominantly change single nucleotide pairs. The chemical mutagens used most widely in plants include ethylmethane sulphonate M. Rakszegi (&)B. N. Kisgyo¨rgyL. La´ngZ. Bed}o
Agricultural Research Institute of the Hungarian Academy of Sciences, PO Box 19, Martonva´sa´r 2462, Hungary e-mail: rakszegi@mail.mgki.hu
K. TearallP. R. ShewryA. Phillips
(EMS), methylmethane sulphonate (MMS), hydrogen fluoride (HF), sodium azide, N-nitroso-N-methylurea (MNU) and hydroxylamine. The extent of mutation is dependent on the tissue, the mutagen used, and the degree of exposure (dosage and time). Mutations of single nucleotide pairs are generally of most interest to breeders, because large-scale changes to chromosome structures usually have severely negative effects.
As a tool for breeders, mutagenesis was ini-tially used in breeding programs for forward genetic screening and the selection of individual mutant genotypes with improved traits. In the last 70 years more than 2,500 varieties have been developed by means of mutagenesis, including large numbers of rice, wheat and maize lines (http://www-infocris.iaea. org/MVD/). Although the method has been used very successfully, it nevertheless has several disadvan-tages. It is difficult, for example, to identify novel genotypes when they are present in small numbers in a large population, whereas the presence of gene duplication and polyploidy results in genetic redun-dancy in many plant species. Consequently, many mutations have no phenotypic effects on the plant. This has led to the development of reverse genetic strategies, such as TILLING (McCallum et al.2000), whereby it is possible to detect point mutations in individual plants and to relate sequence information to the biological functions of the genes. Several techniques have been developed to screen for point mutations and small insertions/deletions (indels) in specific genes, as described in detail by Parry et al. (2009).
The development of mutation detection techniques such as TILLING has renewed interest in the gener-ation of diversity through mutagenesis, and mutant populations have recently been created for many cereal crops, including rice (Suzuki et al. 2008), maize (Weil et al.2005), sorghum (Xin et al.2008), barley (Caldwell et al. 2004; Talame et al. 2008) and both hexaploid bread wheat (Slade et al.
2005; Phillips et al. unpublished) and tetraploid durum wheat (personal communication of M. Parry, Rothamsted Research), mostly by treating seeds or pollen with chemical mutagens (Weil2009). As these populations were generated expressly for screening by reverse genetic approaches, few have been character-ised in detail at the phenotypic level. This paper reports the analysis of a mutagenized population of spring wheat cv. Cadenza produced at Rothamsted
Research in 2005 for TILLING purposes, with special regard to the traits studied in the EU FP6 HEALTH-GRAIN program (Poutanen et al. 2008; Ward et al.
2008). The agronomic and morphological properties of this mutant hexaploid wheat population were examined in a 3 year field experiment, and the diversity in certain breadmaking quality parameters was also studied.
Materials and methods
Plant material
Seeds of spring wheat cv. Cadenza were treated with 0.6 or 0.9% (v/v) EMS by soaking dry seeds for 16 h in an aqueous solution of the mutagen, followed by repeated washing with water. The first M1population
was grown in the field at Rothamsted Research, and a second set of M1plants was grown in the glasshouse.
One ear from each M1 plant was harvested, and a
single seed from each ear was used to generate the M2
population (approximately 4,500 lines, with equal numbers being derived from seeds treated with each EMS concentration). These were grown in the green-house. Single ears of M2plants (containing M3seeds)
were sent to Martonva´sa´r at the beginning of 2006. The 4,244 intact heads were threshed and the progeny from each spike was planted separately in non-replicated head row trials with a single row planter. The head rows were 2 m, with a row spacing of 20 cm. The M3generation was planted and screened in 2006.
M4 seed (3,920 lines) was then grown during the
winter in the greenhouse by single seed descent (SSD) to reduce the within line genetic heterogeneity. In March 2007 M5seeds (3,920 lines) were sown and the
head rows were screened. In 2008 the M6generation
(3,750 lines) was studied in the field.
Agronomic and morphological traits
Most of the traits studied were scored according to UPOV TG/3/11 parameters, namely, time of ear emergence, plant height, ear glaucosity, shape, den-sity, and length, the presence of awn and scurs (very short awns, described in UPOV TG/3/11, VIII. Explanations on the table of characteristics, 2 scurs present, for example varieties Festival and Furio), seasonal type and grain colour. Other traits, such as deformation of the ears, ear sterility, heterogeneity of head rows, leaf colour and responses to powdery mildew and leaf rust were also scored.
Technological and compositional properties
Kernel hardness and diameter and thousand kernel weight of 497 M5 lines were determined with a Perten
SKCS 4100 (AACC 55-311999a) instrument in 2007. Selected technological and compositional properties, such as protein, starch and gluten contents, water absorption and Zeleny sedimentation, were deter-mined on 643 M6lines using a FOSS Tecator 1241
instrument in 2008. This instrument was calibrated according to recommended procedures for each trait (ICC1995a,b,c,d,e; AACC 76-131999b).
Results
Agronomic and morphological characteristics
Approximately 4,000 M3, M4and M6lines of bread
wheat cv. Cadenza were grown in the field and screened for visible phenotypes in June 2006, 2007 and 2008 according to UPOV TG/3/11.
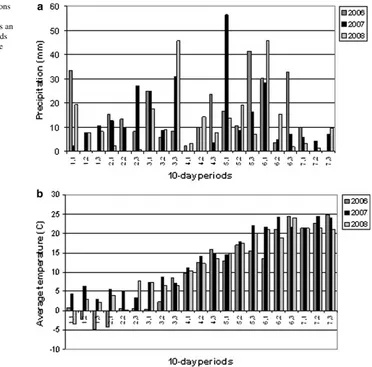
Fig. 1 Weather conditions
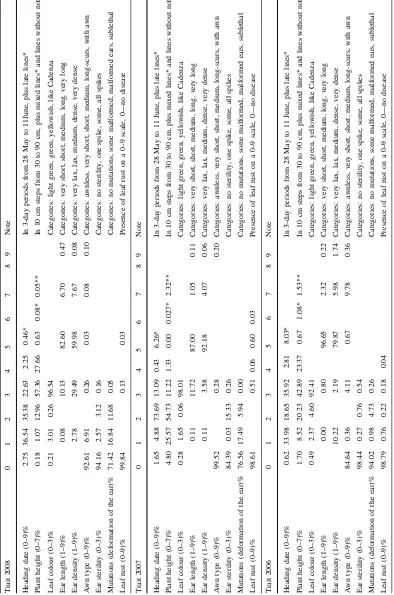
In 2006, 33.9% of the lines had early ear emer-gence, 18.6% were medium, and 35.9% were late. In contrast, in 2007 73.7% of the genotypes had very similar heading dates to the non-mutagenized Cadenza control. This may have been partly due to dry weather and partly to the decreased heterogeneity achieved by single seed descent. This is demonstrated by the changes in the heading date profiles shown in Fig.2a. In 2006, 8% of the lines were very late in heading. This is a disadvantage in the continental, arid climatic conditions of Martonvasar and may have resulted from
the effects of mutations. However, most of the late genotypes were lost over the 3 years due to failure to set seed and their frequency fell to 0.46% in 2008 (Table 1). In 2008 ear emergence was generally very early, but the range was greater than in 2007, as the weather was wetter (Fig.1). In 2008 the average temperature during sowing was above 5°C and this together with high precipitation at the end of March might have caused the early heading (by 20 days difference compared to 2006). Statistical comparison with Cadenza (proportion differing from Cadenza,
Fig. 2 Agronomic and
morphological properties of plants in the M3, M5and M6
generations grown in 2006, 2007 and 2008. Normal Cadenza is indicated by a
P=0.05,±SE) showed that 26.7% (±0.7%) of the mutant lines were later in 2007 and 36.3% (±0.8%) in 2008. Early lines were not identified in 2007, but 1% (±0.2%) were found in 2008.
The lines tended to be taller in 2006 (42.9% between 60 and 70 cm) and 2008 (57.4% between 60 and 70 cm) and shorter (54.7% between 50 and 60 cm) in 2007 which was drier than the other years. Small proportions of the lines had final heights below 40 cm in 2006 and 2008 (1.7 and 0.18%, respectively) but the proportion increased to almost 5% in 2007 due to the dry weather. A small proportion (0.6% in 2006 and 2008) of the lines was taller than 80 cm, except in 2007 when the tallest plant was 75 cm (Fig.2b; Table1). The numbers of short plants also decreased year by year, as they were mostly represented by bushy genotypes which had altered heading dates, and most were lost due to lack of ear emergence or sterility. In a number of lines the spikes did not appear at all; their frequencies were 1.5, 2.3 and 0.05%, respectively, in the 3 years of field experiments. Statistical comparison with Cadenza showed that 29.8% (±0.7%) of the mutant lines were shorter in 2007 and 38.1% (±0.8%) in 2008. None of the lines were taller than the control in 2007, but 0.5% (±0.1%) were taller in 2008.
Some lines also had altered leaf colour compared to the control Cadenza which was glaucous green: 0.2– 0.5% of the lines were light green, 1.6–3% were bright green whereas 0.06–4.6% were yellow. The latter were presumed to be due to biochemical effects of mutations, as virus infection was not detected (Fig.2c; Table1). Septoria tritici blotch was observed on some of the plants, but this did not account for the yellow colour.
Variation was observed in ear length and density. The diversity appeared to be greater after SSD, in 2007 and 2008, but it may also have been affected by the weather conditions (Fig.3; Table1) as discussed above for other properties. The number of plants with short ears was greater in 2007 and 2008, but the greatest increase was in the number of lax ear genotypes in 2008. Most of the lines were awnless, as was the parental line Cadenza, but some spikes had awns (Fig.3c), presumably due to mutations in genes controlling awn production. The absence of awns in bread wheat is controlled by three dominant inhibitor genes,B1(tipped 1) on the long arm of chromosome 5A,B2(tipped 2) on long arm chromosome 6B and Hd (Hooded) on the short arm of chromosome 4A. Awned wheat have homozygous recessive alleles at
all three loci (i.e. hd,b1,b2) while awnless varieties may beHd B2 or B1 B2(Sourdille et al. 2002). The Cadenza genotype at these three loci is not known but it can be suggested that the awned types arose from mutations in these loci. Scurs of different length also occurred in some lines, with different distributions in the 3 years (Table1; Fig.3c). Some of the genotypes with long awns were highly sterile but survived the generations before SSD due to heterozygosity. Different ear morphology phenotypes are shown in Fig.3c.
A number of plants had sterile or deformed ears. The number of sterile ears was significantly higher in 2007 when the weather was extremely dry, with the upper spikelet positions of almost all of the spikes being sterile. The results from the other 2 years were more similar (Fig. 4a; Table1). A larger number of malformed ears were also observed after SSD in 2007 and 2008. The number of head rows containing some malformed ears increased from 0.98% to approxi-mately 17% during the 3 years, but the number of totally malformed headrows also increased (4.7– 11.7%) (Fig.4b; Table1). Some types of ear defor-mations are shown in Fig. 4c. The density of the head rows also increased in successive years as the lines grew more vigorously, making it easier to evaluate the genotypes.
Two-factor variance analysis was used to calculate the effects of genotype and environment on agro-nomic and morphological characteristics (Table2). This showed that the genotype significantly deter-mined almost all the parameters except ear sterility. This property was influenced by the year, indicating that differences were not conferred by the mutations. As there was a great difference between the environ-mental conditions in the 3 years, it was not surprising that years also significantly affected all parameters except awn type.
Kernel characteristics
The M3generation was screened visually for kernel
from 500 lines in 2007 allowing hardness, diameter and thousand kernel weight to be determined (Table3). The hardness index of these lines varied between 50.6 and 84.6, indicating that all the lines were hard. This was not surprising, as Cadenza has the Pinb null allele (Wiley et al. 2007) and any mutations in the functional Pina gene would not affect the phenotype. The diameter of the kernels ranged between 1.7 and 2.5 mm, and thousand kernel weight from 19.9 to 34.4 g.
One thousand lines were harvested in 2008, with 843 giving sufficient amounts of grain for near infrared (NIR) spectroscopy. This showed variation
from 11.7 to 24.3% in protein content, 49–58.6% in starch content, 24–42.3% in gluten content, 54.1–83.3% in water absorption, and 34.5–68.5 ml in Zeleny sedimentation (Table4). These lines are currently being screened for mutations in gluten protein genes, and in genes involved in the synthesis of starch (amylose and amylopectin) (D. Lafiandra personal communication).
Correlations between traits
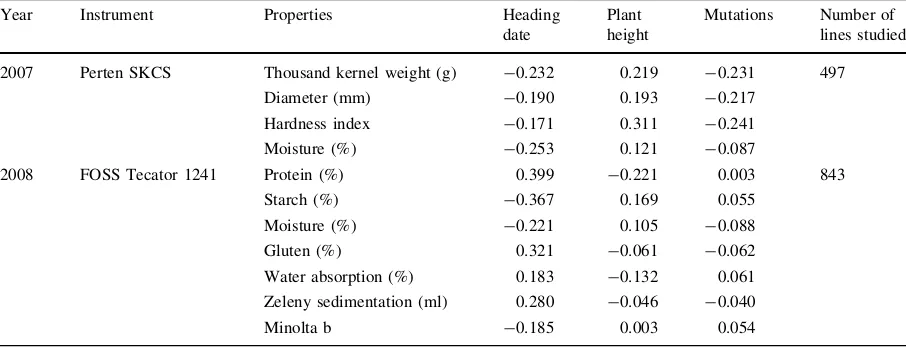
Correlation analysis between breadmaking quality parameters and agronomic and morphological traits
Fig. 3 Agronomical and
morphological properties of ears in the M3, M5and M6
showed that heading date had the most significant effect on the quality parameters (Table5). Early heading was beneficial for kernel properties, such as thousand kernel weight, kernel diameter and hard-ness, whereas late maturation led to higher protein and gluten contents and thus better breadmaking quality (Zeleny). It should be noted, however, that in stressed environments such as the high temperature and drought conditions in 2007, high contents of protein and gluten may have resulted from smaller seeds and therefore did not necessarily lead to better breadmaking quality. Thus, good quality results from
early flowering and an absence of environmental stress during grain development. Table5 does not include morphological and agronomic traits that did not show significant correlations with quality parameters.
Discussion
We measured a range of traits in a mutagenised population of bread wheat cv Cadenza grown in the field over three generations (M –M). The diversity
Fig. 4 Appearance of
of agronomic traits was lower in 2007 and 2008 than in 2006, partly because of the single round of SSD performed in the winter of 2006 and partly because of the loss of very late heading genotypes. However, the lowest diversity was observed in 2007 which was
probably due to the extremely dry weather. Some genotypes with extreme properties are listed in Table 6.
The mutagenised population showed extensive diversity in morphological and agronomic traits. Some traits such as ear morphology, awn presence and sterility were readily scored allowing their cumulative frequency to be calculated as approxi-mately 37%. Other traits varied quantitatively (such as heading date and plant height) making it more difficult to estimate the frequency of mutant pheno-types. In this case it was estimated that at least 20% of lines appeared to be outside the normal range of variation in Cadenza (Table7). Taken together the full range of visible mutant phenotypes may therefore have exceeded 50%.
The frequency of visual mutations in the present study is also greater than that reported by Slade et al. (2005), who created EMS-mutagenised populations of both hexaploid wheat, cv. Express, and tetraploid wheat, cv. Kronos. Most plants in the two populations appeared identical to the parents: only in rare cases
Table 2 Effects of genotype and year on agronomic and
phenotypic properties of mutant lines (Martonva´sa´r, 2006– 2008)
Trait Genotype effect Year effect
Heading date *** ***
Plant height *** ***
Leaf colour *** ***
Ear length *** ***
Ear density *** ***
Awn type (awn/awnless) *** ns
Ear sterility ns ***
Mutations *** ***
Leaf rust * ***
*, **, *** Significant atP=0.05, 0.01 and 0.001, respectively;
nsnot significant
Table 3 Wheat kernel hardness measured with a Perten SKCS 4100 instrument for 497 lines of the M5generation in 2007
Trait Min Max Mean Standard
deviation
CADENZA Mutant genotypes with min. values
Mutant genotypes with max. values
Thousand kernel weight (g/1,000 kernels) 19.94 34.38 25.70 2.40 24.62 CAD1-19-H9 CAD1-16-A10
Thousand kernel weight SD 6.07 12.94 8.96 8.78
Diameter (mm) 1.67 2.48 1.98 0.13 1.95 CAD1-19-H9 CAD1-16-A10
Diameter SD 0.29 0.56 0.38 0.40
Hardness index 50.59 84.60 69.58 6.49 76.88 CAD2-5-F5 CAD2-2-F2
Hardness index SD 14.96 25.44 19.10 19.78
Moisture (%) 7.10 13.81 9.06 1.33 9.60
Moisture SD 0.30 1.12 0.77 0.96
Table 4 Diversity of technological and compositional properties studied with a FOSS Tecator 1241 instrument for 843 lines of the
M6generation in 2008
Trait Min Max Mean Standard
deviation
CADENZA Mutant genotypes with min. values
Mutant genotypes with max. values
Protein (%) 11.70 24.30 17.34 1.24 16.10 CAD1-21-A9 CAD1-5-B8
Starch (%) 49.00 58.60 54.08 1.01 54.40 CAD1-5-B8 CAD1-21-A9
Moisture (%) 9.20 16.00 12.31 0.85 12.90 – –
Gluten (%) 24.00 42.30 32.08 2.92 29.80 CAD1-6-E7 CAD1-5-B8
Water absorption (%) 54.10 83.30 65.41 4.19 62.90 CAD2-3-G2 CAD2-22-F3
Zeleny (ml) 34.50 68.50 53.32 6.99 48.00 CAD1-3-A6 CAD1-5-B8
(\0.5%) were abnormal phenotypes observed in field-grown plants; however, detailed quantitative pheno-typing was not carried out. TILLING analysis of waxy genes in 1,920 bread wheat and durum individuals from the mutagenised populations revealed that the average nucleotide mutation rate was 49910-6(i.e. 49 mutations per million base pairs) in wheat and 38910-6in durum (Slade et al.2005). This rate is of the same magnitude as the mutation rate in the Cadenza bread wheat population reported here, which was estimated by TILLING to have a mutation rate of 30– 40910-6(Phillips, unpublished). It therefore seems likely that more detailed phenotypic characterisation of the populations developed by Slade et al. (2005) will reveal more visible phenotypes. However, it is clear that only tiny fractions of the mutant genes present in these wheat lines result in visible phenotypes.
More detailed studies have been undertaken in other cereal species such as barley and rice. Two large-scale EMS-mutagenised barley populations were developed in cv. Optic to permit both forward and reverse genetics. In one program, leaf material and seed from approximately 20,000 M2 plants were
individually harvested. For phenotypic screening, 12–16 M3progeny from about 8,600 M2plants were
assessed for mutations in 13 different traits (Caldwell et al.2004); over 30% of the population had a visibly different phenotypes. TILLING analysis on two target genes gave an estimate for the nucleotide mutation frequency of approximately 1910-6, illustrating the great difference in mutation tolerance between diploid and polyploid species such as wheat, as described
above. Similarly, Talame et al. (2008) developed a population of barley mutagenised with sodium azide. The estimated nucleotide mutation frequency was 2.1910-6, and again a high rate (33%) of visibly different phenotypes was observed. Suzuki et al. (2008) developed mutant populations ofOryza sativa japonicacv. Taichung 65 by treating freshly fertilised flowers with N-methyl-N-nitrosourea (MNU). The mutation rate in this population was enhanced by selecting M1 lines with less than 70% fertility,
resulting in an M2 population with an observed
nucleotide mutation rate of 7910-6. About half of the M2plants had visibly mutant phenotypes; many
had multiple abnormalities.
The similarity between the frequency of visible phenotypes in the mutagenised population of wheat reported here and those in barley suggest that both species are equally sensitive to mutation. However, as described above, the nucleotide mutation frequencies of the different populations are distinctly different, with wheat populations tolerating 10–20 times higher mutation frequencies than barley. Thus, hexaploid wheat can be seen to be much more tolerant of mutations than diploid barley. Indeed, it is likely that even higher rates of mutagenesis may be achievable in wheat: in diploid species such as barley, the main factor limiting the mutation rate appears to be the fertility of the mutagenised plants, presumably due to mutations in single copy genes that are lethal in the haploid state. In wheat, complementation of similar potentially lethal mutations by orthologous normal copies reduces the level of infertility. Thus the main
Table 5 Correlations between breadmaking quality parameters and agronomic and morphological properties
Year Instrument Properties Heading
date
Plant height
Mutations Number of lines studied
2007 Perten SKCS Thousand kernel weight (g) -0.232 0.219 -0.231 497
Diameter (mm) -0.190 0.193 -0.217
Hardness index -0.171 0.311 -0.241
Moisture (%) -0.253 0.121 -0.087
2008 FOSS Tecator 1241 Protein (%) 0.399 -0.221 0.003 843
Starch (%) -0.367 0.169 0.055
Moisture (%) -0.221 0.105 -0.088
Gluten (%) 0.321 -0.061 -0.062
Water absorption (%) 0.183 -0.132 0.061
Zeleny sedimentation (ml) 0.280 -0.046 -0.040
Minolta b -0.185 0.003 0.054
Table
6
Genotypes
(maximum
ten/character)
with
extreme
properties
discussed
in
the
text
Heading
date
Plant
height
Leaf
colour
Ear
length
Ear
density
Awn
length
Sterility
Mutation
Early
Short
Green
Very
short
Very
lax
With
awns
Some
sterile
spikes
Malformed
ears
CAD1-11-B1
CAD2-2-A2
CAD2-23-B1
CAD2-6-C4
CAD2-21-C11
CAD2-11-E5
CAD2-12-A5
CAD2-15-E4
CAD2-13-G9
CAD2-11-D2
CAD2-3-B11
CAD2-13-B5
CAD2-16-H1
CAD2-25-G3
CAD2-12-B5
CAD2-19-E7
CAD1-13-E10
CAD2-10-A5
CAD1-1-B12
CAD1-8-A5
CAD2-3-A12
CAD2-4-C10
CAD2-13-B8
CAD2-23-D12
CAD1-17-G6
CAD2-21-B3
CAD1-8-F12
CAD2-27-G3
CAD2-23-C1
CAD2-14-B8
CAD2-17-C7
CAD2-24-E1
CAD1-11-D12
CAD2-22-H8
CAD2-18-G11
CAD2-23-F11
CAD2-1-C7
CAD2-26-C6
CAD1-15-B9
CAD2-23-B1
CAD2-19-H9
CAD2-9-B7
CAD2-19-G12
CAD2-24-A10
CAD2-27-D11
CAD2-23-A1
CAD1-12-B9
CAD2-20-E3
CAD1-13-H1
CAD2-20-C7
CAD2-13-B5
CAD1-19-E2
CAD2-25-D9
CAD1-20-B9
CAD2-21-G2
CAD2-16-D7
CAD1-21-G8
CAD1-14-H11
CAD1-22-H4
CAD2-22-B8
CAD2-18-G10
CAD1-24-E5
CAD1-15-D8
Late
Tall
Light
green
Very
long
Very
dense
Very
short
awns
CAD1-1-D6
CAD1-9-A4
CAD2-18-E8
CAD2-16-H1
CAD2-10-A5
CAD2-11-E5
CAD1-15-E4
CAD2-5-D8
CAD2-20-B10
CAD2-5-C8
CAD1-22-H4
CAD2-25-G3
CAD1-1-D7
CAD2-12-C1
CAD1-23-C12
CAD2-25-F12
CAD2-28-E5
CAD2-18-A10
CAD2-1-G10
CAD2-4-D5
CAD2-16-H11
CAD2-25-D12
CAD2-1-H11
CAD1-20-E7
CAD2-28-F2
CAD2-27-A4
CAD2-2-E1
CAD1-7-D12
CAD2-28-F3
CAD2-5-C9
CAD1-19-H11
CAD2-24-H11
CAD1-12-B3
CAD2-23-B1
CAD2-27-B12
CAD1-4-H1
CAD2-27-C8
factor limiting the concentration of EMS used to mutagenise our population was the cellular toxicity of the mutagen. It may therefore be possible to achieve higher mutation rates by using less cytotoxic muta-gens, or by recurrent EMS treatment of seeds in successive generations of the population.
The assortment and frequency of the various mutant phenotypes observed in the wheat population described here suggests that it will be a useful resource for forward and reverse genetic studies and also for breeding purposes. The population or indi-vidual lines within it are available on request, subject to a small handling fee. Several genotypes with beneficial characteristics from the breeding point of view were identified. For example, early maturing lines with long, dense ears and tolerance to drought stress will become increasingly important as Euro-pean summers become hotter and drier (as predicted by climate change models).
Similarly, lines with high thousand kernel weight, diameter and hardness, white kernel colour, or special protein, starch and dietary fibre properties can be selected to satisfy the demands of the processing industry. It is rare, for example, for genotypes with white kernel colour not to have a high level of sprouting and the identification of mutant white lines will allow the relationship between red colour and sprouting to be explored, with the possibility of producing white wheats with low levels of sprouting. White wheats are currently in demand because of the high consumer acceptability of wholemeal products made from them. The ability to grow white varieties over wider areas in Europe would therefore reduce costs to the industry and comsumers and hence assist healthier nutrition.
Acknowledgments This work was financially supported by
the European Commission in the Communities 6th Framework programme, Project HEALTHGRAIN (FOOD-CT-2005-514008). It reflects the authors’ views and the Community is not liable for any use that may be made of the information contained in this publication. Thanks are due to A. Szeidl, H.H. Kissne´, J.T. Bodna´rne´, E. Kereszte´nyi and Z. Bogna´r in
Martonva´sa´r for assistance. Rothamsted Research receives grant-aided support from the Biotechnology and Biological Sciences Research Council (BBSRC) of the UK. The production of the EMS-mutagenised population of cv. Cadenza was carried out within the Wheat Genetic Improvement Network funded by the UK Department for Environment, Food and Rural Affairs.
References
AACC Method 55-31 (1999a) Physical tests. Singel-kernel characterization system for wheat kernel texture. AACC International, St. Paul, USA
AACC Method 76-13 (1999b) Total starch assay procedure. Megazyme amyloglucosidase/a-amylase method. AACC International, St. Paul, USA
Caldwell DG, McCallum N, Shaw P, Muehlbauer GJ, Marshall DF, Waugh R (2004) A structured mutant population for forward and reverse genetics in barley (Hordeum vulgare
L.). Plant J 40:143–150
ICC 105/2 (1995a) Determination of crude protein in cereals and cereal products for food and for feed. International Association for Cereal Science and Technology, Vienna ICC 115/1 (1995b) Method for using Brabender farinograph.
International Association for Cereal Science and Tech-nology, Vienna
ICC 116/1 (1995c) Determination of the sedimentation value (according to Zeleny) as an approximate measure of baking quality. International Association for Cereal Sci-ence and Technology, Vienna
ICC 137/1 (1995d) Mechanical determination of the wet gluten content of wheat flour (Glutomatic). International Asso-ciation for Cereal Science and Technology, Vienna ICC 155 (1995e) Determination of wet gluten quantity and
quality (gluten index ac. to Perten) of whole wheat meal and wheat flour (Triticum aestivum). International Asso-ciation for Cereal Science and Technology, Vienna McCallum CM, Comai L, Greene EA, Henikoff S (2000)
Targeting induced local lesions in genomes (TILLING) for plant functional genomics. Plant Physiol 123:439–442 Parry MAJ, Madgwick PJ, Bayon C, Tearall K et al (2009) Mutation discovery for crop improvement. J Exp Bot 60:2817–2825
Poutanen K, Shepherd R, Shewry PR, Delcour JA et al (2008) Beyond whole grain: the European HEALTHGRAIN project aims at healthier cereal foods. Cereal Food World 53:32–35
Slade AJ, Fuerstenberg SI, Loeffler D, Steine MN, Facciotti D (2005) A reverse genetic, nontransgenic approach to wheat crop improvement by TILLING. Nat Biotechnol 23:75–81 Sourdille P, Cadalen T, Gay G, Gill B, Bernard M (2002) Molecular and physical mapping of genes affecting awning in wheat. Plant Breed 121:320–324
Suzuki T, Eiguchi M, Kumamaru T, Satoh H et al (2008) MNU-induced mutant pools and high performance TILLING enable finding of any gene mutation in rice. Mol Genet Genomics 279:213–223
Talame V, Bovina R, Sanguineti MC, Tuberosa R et al (2008) TILLMore, a resource for the discovery of chemically induced mutants in barley. Plant Biotechnol J 6:477–485
Table 7 Diversity in quantitative phenotypic properties of the
normal Cadenza genotype
2008 2007 2006
Heading date (days from 1st May) 30–34 34–43 46–48
Ward J, Poutanen K, Gebruers K, Piironen V et al (2008) The HEALTHGRAIN cereal diversity screen: concept, results and prospects. J Agric Food Chem 56:9699–9709 Weil CF (2009) TILLING in grass species. Plant Physiol
149:158–164
Weil CF, Monde RA, Till BJ, Comai L, Henikoff S (2005) Mutagenesis and functional genomics in maize. Maydica 50:415–424
Wiley PR, Tosi P, Evrard A, Lovegrove A et al (2007) Promoter analysis and immunolocalisation show that puroindoline genes are exclusively expressed in starchy endosperm cells of wheat grain. Plant Mol Biol 64:125–136