R E S E A R C H A R T I C L E
Open Access
Association of Interleukin-1 gene clusters
polymorphisms with primary open-angle
glaucoma: a meta-analysis
Junhua Li
1, Yifan Feng
2, Mi Sun Sung
1, Tae Hee Lee
1and Sang Woo Park
1*Abstract
Background:Previous studies have associated the Interleukin-1 (IL-1) gene clusters polymorphisms with the risk of primary open-angle glaucoma (POAG). However, the results were not consistent. Here, we performed a meta-analysis to evaluate the role ofIL-1gene clusters polymorphisms in POAG susceptibility.
Methods:PubMed, EMBASE and Cochrane Library (up to July 15, 2017) were searched by two independent investigators. All case-control studies investigating the association between single-nucleotide polymorphisms (SNPs) ofIL-1gene clusters and POAG risk were included. Odds ratios (ORs) with 95% confidence intervals (CIs) were calculated for quantifying the strength of association that has been involved in at least two studies.
Results:Five studies onIL-1βrs16944 (c. -511C > T) (1053 cases and 986 controls), 4 studies onIL-1αrs1800587 (c. -889C > T) (822 cases and 714 controls), and 4 studies onIL-1βrs1143634 (c. +3953C > T) (798 cases and 730 controls) were included. The results suggest that all three SNPs were not associated with POAG risk. Stratification analyses indicated that the rs1143634 has a suggestive associated with high tension glaucoma (HTG) under dominant (P= 0.03), heterozygote (P= 0.04) and allelic models (P= 0.02), however, the weak association was nullified after Bonferroni adjustments for multiple tests.
Conclusions: Based on current meta-analysis, we indicated that there is lack of association between the three SNPs of IL-1and POAG. However, this conclusion should be interpreted with caution and further well designed studies with large sample-size are required to validate the conclusion as low statistical powers.
Keywords:Interleukin-1, Polymorphism, Primary open-angle glaucoma, Meta-analysis
Background
Glaucoma is the second largest cause of bilateral blindness worldwide that affects approximately 60 million people [1]. Primary open-angle glaucoma (POAG), the major type of glaucoma, is characterized by progressive damage of the optic nerve and retinal ganglion cells (RGC), and sub-sequent irrevocable vision loss [2]. Although the etiology is not entirely clear, genetic factors are thought to be a potential risk to POAG patients, including both those with normal and elevated intraocular pressure (IOP). Recently, the relationship between genetic polymorphisms of the immune system and were not perceived as being related
to glaucoma, however, their relationship has been highly suspected and investigated recently [3].
Interleukin-1 (IL-1), an important mediator of inflam-mation, has been suggested to play a crucial role in neuro-degeneration such as Alzheimer’s disease [4]. In view of the potential similarities in cellular mechanism leading to neuro-degenerative disorder between glaucoma and Alzheimer’s disease (AD), some investigators specu-lated that the polymorphism inIL-1gene clusters may be a genetic predisposing factor for glaucoma. It has been reported thatIL-1was expressed endogenously in trabecu-lar meshwork (MT) cells that controls a stress response specific to the aqueous outflow pathway and confers a protective response against glaucoma [5]. Moreover, experiments in vivo showed thatIL-1promotes glutamate * Correspondence:[email protected]
1Department of Ophthalmology, Chonnam National University Medical School and Hospital, 42 Jebongro, Gwang-ju 61469, Republic of Korea Full list of author information is available at the end of the article
uptake by Müller cells and increases the number of sur-viving of RGCs [6].
Recently, several single nucleotide polymorphisms (SNPs) in the IL-1 gene cluster [i.e. IL-1β rs16944 (c. -511C > T), IL-1α rs1800587 (c. -889C > T) and IL-1β rs1143634 (c. +3953C > T)] have been investigated for association with POAG [7–14]. However, the results remain controversial due to some studies identified there was an association betweenIL-1gene SPN and POA while others failed. Furthermore, to our knowledge, no relevant genome-wide association study (GWAS) or meta-analysis has been published on this subject. In the current study, we conducted a systematic review and meta-analysis to summarize the contradictory results from these relevant studies and to clarify the relationship betweenIL-1cluster polymorphisms and POAG.
Methods
This meta-analysis was followed the the Preferred Reporting Items for Systematic Review and Meta-Analyses (PRISMA) statement [15].
Literature search
To obtain eligible literature, a comprehensive search with-out a language restriction was conducted in the PubMed, EMBASE and Cochrane Library covering publications up to July 15, 2017, by using of the following keywords: (“glaucoma” or “open angle” or “POAG” or “intraocular hypertension”) AND (“interleukin-1” or “IL-1” or “inter-leukin 1”) AND (“polymorphism” or “SNP” or “single nucleotide polymorphism” or “variation” or “mutation”) (Additional file 1). The titles, abstracts, and full texts were screened by two independent investigators (L.J.H., F.Y.F.) to determine inclusion and disagreements were resolved by discussion between all authors until a consensus was determined. Review articles and bibliographies of other relevant studies were searched manually to identify additional eligible studies.
Inclusion and exclusion criteria
Literature selection had to meet the the following criteria: (1) case-control or cohort studies on the relationship of the SNPs ofIL-1with POAG; (2) all patients in the eligible studies meeting the diagnostic criteria for POAG; (3) had sufficient information for estimating odds ratios (ORs) with corresponding 95% confidence interval (CI). The exclusion criteria were: (1) case only studies; (2) abstract, case report and review papers; (3) repeated or overlapped publication. Only the most recent or complete study was used in this meta-analysis in case of the same patient population was included in several publications.
Quality assessment
The methodological quality of eligible studies was evalu-ated independently by two authors (J.H.L. and Y.F.F.), according to a modified version of the Newcastle–Ottawa scale (NOS) for genetic association studies [16] (Add-itional file 2). NOS quality scores ranged between 0 and 9 stars. Studies with a score of five stars or greater were considered high quality.
Data extraction
According to the PRISMA guidance, the necessary informa-tion from eligible studies was extracted independently by two reviewers (L.J.H. and S.M.S.) using a standardized form. The following data was retrieved: surname of first author, publication date, region, ethnicity, number of cases and controls, age, subtypes of POAG, genotyping method and genotypes frequency, evidence of Hardy-Weinberg equilib-rium (HWE) in control group, etc. When the allele or genotype counts were not given specially in some articles, they were calculated from the frequencies and then rounded to the nearest integer. Disagreements were resolved by discussion between all authors and subsequent consensus.
Statistical analysis
Statistical analysis was undertaken using RevMan software (version 5.0; Cochrane Collaboration, Oxford, United Kingdom) and STATA 11.0 software (Stata Corporation, Texas, USA). The strength of association between IL-1 SNPs and POAG was estimated by ORs with 95% confi-dence intervals (CIs). The pooled ORs were performed for the allele model (T versus C), homozygote model (CC ver-sus TT), heterozygote model (TC verver-sus CC), dominant model (TT + CT versus CC) and recessive model (TT ver-sus CT + CC), respectively.
I2value was applied to evaluate the between-study hetero-geneity, with <25%, 25%–50%, and >50% to represent low, moderate, and high degree of heterogeneity, respectively [17]. In addition, a Q-statistic test was conducted and the heterogeneity was considered significant at P< 0.10. The summary OR and 95% CI for each polymorphism were pooled by using the fixed-effect model (Mantel-Haenszel) when no significant heterogeneity was observed among studies. Otherwise, the random effect model (DerSimonian and Laird) was adopted.
In association analysis, a pooled P value of less than 0.05 was considered as suggestive evidence for a genetic association. Aim to control false positive error rate, the Bonferroni method was used to adjust for multiple comparisons [18]. We performed 20 times comparisons for IL-1β rs16944, 15 times comparisons for IL-1α rs1800587 and IL-1β rs1143634 in POAG respectively, therefore, theP values that were less than 0.05/20 in
Power analysis regarding the association of each IL-1 SNP with POAG was performed using the statistical soft-ware Power and Sample Size Calculation (PS) version 3.1.2 (http://biostat.mc.vanderbilt.edu/wiki/Main/PowerSample-Size) and a value greater than 0.8 meant high statistical power. The HWE was assessed by Fisher’s exact test. Subgroup analyses were performed based on ethnicity, as well as type of POAG including high tension glaucoma (HTG) (IOP > 21 mmHg) and non-HTG (IOP < 21 mmHg, with or without a strict diurnal testing). Sensitivity analysis was performed to assess the stability of individual studies, and the potential of publication bias was assessed by Begg’s funnel plot [19] and further evaluated by Egger’s linear regression test [20].
Results
Eligible studies
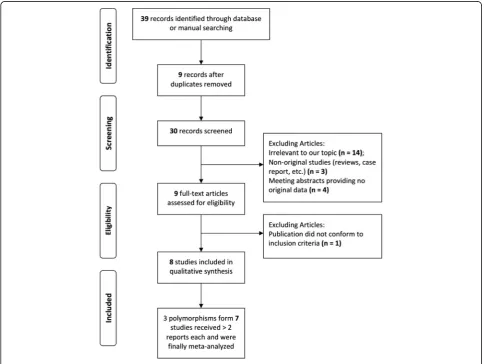
The flow chart for the study selection is summarized in Fig. 1. The initial search yielded 39 articles and 9 duplicate publications were excluded(Additional file 1). Based on the title and content of the abstract, 22 studies were further
excluded. Nine articles with full-texts were further reviewed and 1 publication was excluded because it did not conform to our inclusion criteria. Thus, 8 case-control studies [7–14] were finally included in this meta-analysis and the main characteristics of each study are listed in Additional file 3: Table S1. The publication year of the included studies ranged from 2003 to 2016. All of the 8 studies had scores≥5* and the mean score was 5.6*. The quality of these studies is summarized in Additional file 4: Table S2. In total, 64 SNPs have been investigated at least once in these 8 studies, among which 3 SNPs (IL-1β rs16944,IL-1βrs1143634,IL-1αrs1800587) were tested in at least 2 studies and included in the present meta-analysis. In all studies, the distributions of genotypes of all SNP in the control groups were consistent with HWE (Table 1).
Meta-analysis
Association between SNP rs16944 of IL-1βgene and POAG
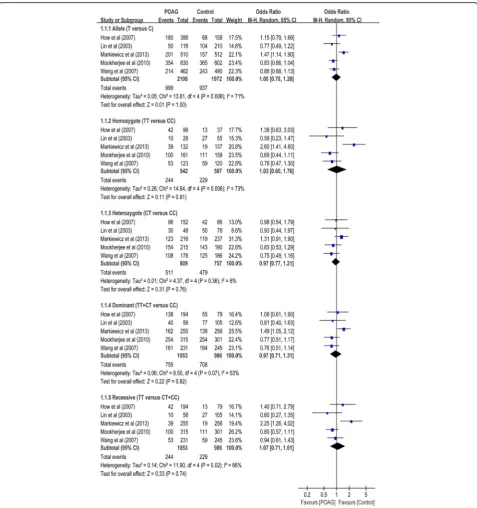
SNP rs16944 was assessed in 5 case-control studies with a total of 1053 POAG cases and 986 controls (Table 1). No association between this SNP and POAG risk was
found in the overall populations in dominant (OR = 0.97, 95% CI 0.71 to 1.31,P= 0.83), recessive (OR = 1.07, 95% CI 0.71 to 1.61, P= 0.74), homozygote (OR = 1.03, 95% CI 0.60 to 1.76, P= 0.91), heterozygote (OR = 0.97, 95% CI 0.79 to 1.20, P= 0.91) and allelic comparison (OR =
1.00, 95% CI 0.78 to 1.28, P= 1.00) models (Table 2; Fig. 2). In subgroup analysis stratified by type of POAG, the meta-analyses indicated no significant association of this SNP with POAG in any of the genetic models in patients with HTG and non-HTG, respectively. In
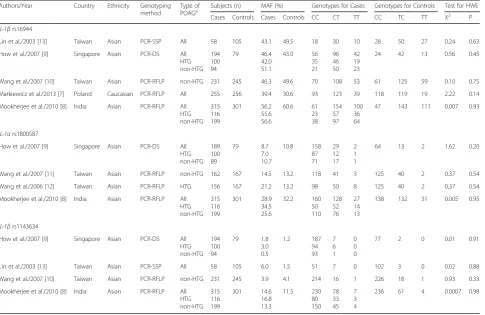
Table 1Characteristics of the studies included in the meta-analysis
Authors/Year Country Ethnicity Genotyping method
Type of
POAGa Subjects (n) MAF (%) Genotypes for Cases Genotypes for Controls Test for HWE
Cases Controls Cases Controls CC CT TT CC TC TT X2 P IL-1βrs16944
Lin et al./2003 [13] Taiwan Asian PCR-SSP All 58 105 43.1 49.5 18 30 10 28 50 27 0.24 0.63
How et al./2007 [9] Singapore Asian PCR-DS All HTG non-HTG 194 100 94 79 46.4 42.0 51.1 43.0 56 35 21 96 46 50 42 19 23
24 42 13 0.56 0.45
Wang et al./2007 [10] Taiwan Asian PCR-RFLP non-HTG 231 245 46.3 49.6 70 108 53 61 125 59 0.10 0.75
Markiewicz et al./2013 [7] Poland Caucasian PCR-RFLP All 255 256 39.4 30.6 93 123 39 118 119 19 2.22 0.14
Mookherjee et al./2010 [8] India Asian PCR-RFLP All HTG non-HTG 315 116 199 301 56.2 55.6 56.6 60.6 61 23 38 154 57 97 100 36 64
47 143 111 0.007 0.93
IL-1αrs1800587
How et al./2007 [9] Singapore Asian PCR-DS All HTG non-HTG 189 100 89 79 8.7 7.0 10.7 10.8 158 87 71 29 12 17 2 1 1
64 13 2 1.62 0.20
Wang et al./2007 [11] Taiwan Asian PCR-RFLP non-HTG 162 167 14.5 13.2 118 41 3 125 40 2 0.37 0.54
Wang et al./2006 [12] Taiwan Asian PCR-RFLP HTG 156 167 21.2 13.2 98 50 8 125 40 2 0.37 0.54
Mookherjee et al./2010 [8] India Asian PCR-RFLP All HTG non-HTG 315 116 199 301 28.9 34.5 25.6 32.2 160 50 110 128 52 76 27 14 13
138 132 31 0.005 0.95
IL-1βrs1143634
How et al./2007 [9] Singapore Asian PCR-DS All HTG non-HTG 194 100 94 79 1.8 3.0 0.5 1.2 187 94 93 7 6 1 0 0 0
77 2 0 0.01 0.91
Lin et al./2003 [13] Taiwan Asian PCR-SSP All 58 105 6.0 1.5 51 7 0 102 3 0 0.02 0.88
Wang et al./2007 [10] Taiwan Asian PCR-RFLP non-HTG 231 245 3.9 4.1 214 16 1 226 18 1 0.93 0.33
Mookherjee et al./2010 [8] India Asian PCR-RFLP All HTG non-HTG 315 116 199 301 14.6 16.8 13.3 11.5 230 80 150 78 33 45 7 3 4
236 61 4 0.0007 0.98
HTGhigh tension glaucoma,PCRpolymerase chain reaction,DSdirect sequencing,RFLPrestriction fragment length polymorphism,SSPsequence-specific primer,MAFminor
allele frequency
aPOAG patients were subdivided to two groups: HTG (IOP > 21 mmHg) and non-HTG (IOP < 21 mmHg, with or without a strict diurnal testing)
Table 2Stratified analyses between theIL-1gene polymorphisms and risk of POAG
Subgroup No. of studies No. of patients Allele model Homozygote model Heterozygote model Dominant model Recessive model Power calculationaz
Cases Controls OR (95% CI) P OR (95% CI) P OR (95% CI) P OR (95% CI) P OR (95% CI) P
IL-1βrs16944
Overall 5 1053 986 1.00 [0.78, 1.28] 1.00 1.03 [0.60, 1.76] 0.91 0.97 [0.79, 1.20] 0.77 0.97 [0.71, 1.31] 0.83 1.07 [0.71, 1.61] 0.74 5.1%
Asian 4 798 730 0.88 [0.76, 1.02] 0.09 0.79 [0.58, 1.06] 0.11 0.84 [0.65, 1.08] 0.18 0.82 [0.64, 1.05] 0.11 0.87 [0.69, 1.10] 0.26 42.2%
HTG 2 216 380 0.86 [0.67, 1.10] 0.24 0.76 [0.46, 1.27] 0.30 0.79 [0.51, 1.22] 0.28 0.78 [0.51, 1.18] 0.23 0.86 [0.58, 1.27] 0.45 23.8%
non-HTG 3 524 625 0.96 [0.75, 1.23] 0.73 0.93 [0.56, 1.54] 0.77 0.76 [0.46, 1.27] 0.34 0.87 [0.65, 1.14] 0.31 0.94 [0.72, 1.22] 0.63 7.7%
IL-1αrs1800587
Overall 4 822 714 1.08 [0.75, 1.55] 0.67 1.19 [0.44, 3.17] 0.73 1.02 [0.81, 1.29] 0.84 0.99 [0.64, 1.54] 0.98 1.01 [0.64, 1.61] 0.96 14.1%
HTG 3 372 547 1.15 [0.71, 1.86] 0.57 1.51 [0.83, 2.73] 0.18 1.19 [0.87, 1.62] 0.27 1.17 [0.71, 1.91] 0.54 1.41 [0.80, 2.50] 0.23 24.7%
non-HTG 3 450 547 1.84 [0.67, 1.05] 0.12 0.59 [0.32, 1.10] 0.10 0.87 [0.66, 1.16] 0.34 0.87 [0.62, 1.23] 0.44 0.66 [0.36, 1.21] 0.18 35.7%
IL-1βrs1143634
Overall 4 798 730 1.32 [0.99, 1.75] 0.06 1.64 [0.53, 5.11] 0.39 1.32 [0.96, 1.81] 0.09 1.34 [0.98, 1.82] 0.07 1.56 [0.50, 4.84] 0.44 51.1%
HTG 2 216 380 1.61 [1.06, 2.42] 0.02 2.21 [0.48, 10.10] 0.31 1.65 [1.03, 2.65] 0.04 1.69 [1.07, 2.67] 0.03 1.97 [0.43, 8.95] 0.38 73.3%
non-HTG 3 524 625 1.10 [0.79, 1.53] 0.57 1.45 [0.42, 5.07] 0.56 1.07 [0.74, 1.54] 0.72 1.09 [0.76, 1.55] 0.64 1.42 [0.41, 4.93] 0.59 9.4%
HTGhigh tension glaucoma
subgroup analysis stratified by ethnicity, the meta-analyses indicated no significant association of this SNP with POAG in any of the genetic models in Asians.
Association between SNP rs1800587 of IL-1αgene and
POAG
Four case-control studies had investigated the relationship between SNP rs1800587 and susceptibility to POAG with
analysis stratified by type of POAG, the meta-analyses indicated no significant association of this SNP with POAG in any of the genetic models in patients with HTG and non-NTG, respectively(Table 2).
Association between SNP rs1143634 of IL-1βgene and
POAG
Three case-control studies had investigated the relation-ship between SNP rs1143634 and susceptibility to POAG with a total of 798 cases and 730 control subjects (Table 1). No association between this SNP and POAG
controls showed significant association with POGA risk under dominant (OR = 1.69, 95%CI: 1.07 to 2.12, P= 0.03), heterozygote (OR = 1.65, 95% CI: 1.03 to 2.65,
P= 0.04) and allelic comparison (OR = 1.61, 95% CI: 1.06 to 2.42, P= 0.02), there was no statistical signifi-cance when Bonferroni correction was considered
(Table 2).
Power calculation on the pooled frequencies showed that the statistical powers were all lower than 80% for allele models of the three SNPs (Table 2).
Sensitivity analysis
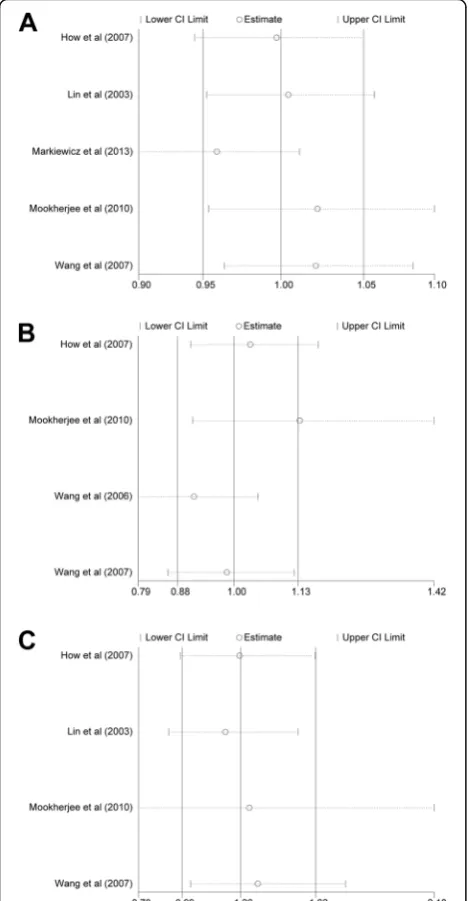
To examine the stability of pooled results, sensitivity analysis was conducted by sequentially excluding individual studies and calculating the pooled ORs for the remaining studies. As shown in Fig. 5, we found no individual study affected the pooled OR in the dominant models of all three SNPs.
Publication bias
models of SNP rs16944 (PEgger’s= 0.57), SNP rs1800587
(PEgger’s= 0.98) and SNP rs1143634 (PEgger’s= 0.56).
Discussion
This is the first meta-analysis to summarize the evidence of associations betweenIL-1gene cluster polymorphisms and susceptibility of POAG. Our data revealed that the SNPs of IL-1β rs16944, IL-1α rs1800587 and IL-1β rs1143634 were not associated with the POAG risk. Stratification analyses showed that IL-1β rs1143634 has
a suggestive associated with the risk of HTG, however, this association was feeble after Bonferroni adjustments.
Recently, polymorphisms in the IL-1 gene clusters have been shown in chronic neurodegenerative disease, such as multiple sclerosis [21], Parkinson’s disease [22] and Alzheimer’s disease [23]. The C allele of rs16944 and rs1800587, and the T allele of rs1143634 has been speculated to influence the risk of POAG by altering the expression level of the respective proteins, because the sites of rs1800587 and rs16944 are located within the Fig. 5Sensitivity analysis of the correlation theIL-1polymorphisms
and POAG risk. (A) Sensitivity analysis for theIL-1βrs16944. (B) Sensitivity analysis for the IL-1αrs1800587. (C) Sensitivity analysis for theIL-1βrs1143634. Abbreviations: POAG, primary open-angle glaucoma; CI, confidence interval
transcriptional promoter regions of theIL-1α and IL-1β genes, respectively, and the site of rs1143634 is within the coding region of the IL-1β gene [24, 25]. IL-1 is a key mediator of immune and inflammatory responses, which act directly to mediate a number of cellular responses. Laboratory studies have showed that IL-1could promote ganglion cell loss and optic nerve damage by increasing matrix mellanoproteinase-9 (MMP-9) synthesis in experi-mental models [26, 27]. IL-1 has also been reported to induce nitric oxide synthesis and reactive oxygen species (ROS), which involved in RGC damage leading to neuro-degeneration [28]. However, some studies have put forward argument and their results pointed to certain neuro-protective role ofIL-1[5, 6]. Therefore, we under-take the present meta-analysis on all the available data to establish a more robust estimate of the association betweenIL-1gene clusters polymorphism and POAG.
Although the meta-analysis for overall studies showed that all the three IL-1 clusters polymorphisms were not associated with the POAG risk, the results of subgroup analyses should arouse our attention. On the one hand, genetic heterogeneity for POAG may exist in different populations. Stratified analyses in the current meta-analysis based on ethnicity showed that there is no statistical evidence of significant association between the rs16944 and POAG in Asian population. However, one study in Caucasians showed that the SNP rs16944 is important risk factors associated with POAG [7]. More-over, of the included studies for the Asian population, one studies [7] found a possible association of the SNP rs1143634 with POAG in Taiwan population but this association could not be further replicated in Singaporean [9] Chinese and Indian subjects [12]. Thus, more studies with POAG cohort from different ethnic background are needed to further define this association.
On the other hand, genetic heterogeneity for POAG may exist in different subtypes of this disease. For example, Wang et al. found an increased risk for individuals carry-ing T allele of IL-1α rs1800587 in HTG patients with an IOP > 21 mmHg [8] but not for normal-tension glaucoma (NTG) cases with IOP < 21 mmHg [10]. Similarly, the SNP rs1143634 seem to be associated with HTG rather than NTG. Glaucomatous damage to the retina and optic nerve is often accompanied by pathological IOP elevation. These findings of our meta-analysis suggested that the pathogenesis and effect ofIL-1 may be different between HTG and NTG. Laboratory and clinical studies are needed to further clarify the molecular pathogenesis of the two subtypes of POAG as well as the role of IL-1on IOP elevation.
Publication bias should be considered as it is an import-ant factor that affects the reliability of the results of meta-analyses. In the current study, both Begg’s and Egger’s test were used to assess the potential publication bias and
failed to detected a significant bias in all genetic models (Fig. 5), demonstrating the robustness and credibility of the present meta-analysis. However, some limitations of this meta-analysis should be taken into careful consider-ation. Firstly, some unescapable bias may exist in the results as only published studies with full-text were included in our analysis. Secondly, haplotype analysis for the possibility of linkage disequilibrium between SNPs was not performed in the present meta-analysis. How et al. [9] found that The TT haplotype of rs1143634 and rs16944 together and the TTT haplotype of rs16944, rs1800587 and rs1143634 was significantly more common in normal control subjects than in those with POAG. Further investigations of the haplotypic effect of a gene and the study of multiple polymorphisms in different genes are needed. Thirdly, the results of power calcula-tions indicated that the combined sample sizes (overall and subgroups) in the current meta-analyses were still inadequate and underpowered to detect the association of
IL-1gene SNPs with POAG, due to limited availability of published data. Finally, the strength of association between IL-1 gene SNPs and POAG was carried out by unadjusted estimate, we didn’t adjust pool results by the factors like the age, gender, disease severity and genotyp-ing procedure.
Conclusions
In conclusion, this meta-analysis did not demonstrate an association between theIL-1SNPs (rs16944, rs1800587 and rs1143634) and the risk of POAG. Nevertheless, this conclusion should be interpreted with caution and well-designed studies with larger cohorts are urgently warranted to verify the present findings as low statistical powers.
Additional files
Additional file 1:The full details of databases searching terms. (DOCX 36 kb)s (DOCX 36 kb)
Additional file 2:Modified Newcastle-Ottawa Scale for studies of genetic association. (DOCX 16 kb) (DOCX 16 kb)
Additional file 3: Table S1.Characteristics of included studies. (DOC 67 kb) (DOC 67 kb)
Additional file 4: Table S2.Quality of included studies. (DOC 68 kb) (DOC 68 kb)
Abbreviations
CI:Confidence interval; HTG: High tension glaucoma; HWE: Hardy-Weinberg equilibrium; IL: Interleukin; IOP: Intraocular pressure; MMP: Matrix
mellanoproteinase; NTG: Normal tension glaucoma; OR: Odds ratio; POAG: Primary open-angle glaucoma; RGC: Retinal ganglion cells; ROS: Reactive oxygen species; SCI: Science Citation Index; SNP: Single nucleotide polymorphism
Acknowledgments
None
Funding
Availability of data and materials
All data has been shared in the Figures and Tables.
Authors’contributions
SP made substantial contributions to conception and design of this study; JL, YF and MS made substantial contributions to acquisition of data, or analysis and interpretation of data; JL, YF and TL drafted the manuscript; SP revised it critically for important intellectual content and agreed to be accountable for all aspects of the work in ensuring that questions related to the accuracy or integrity of any part of the work are appropriately investigated and resolved. All authors have given the final approval of the version to be published.
Ethics approval and consent to participate
Not applicable
Consent for publication
Not applicable
Competing interests
All authors declare that they have no competing interests.
Publisher’s Note
Springer Nature remains neutral with regard to jurisdictional claims in published maps and institutional affiliations.
Author details
1Department of Ophthalmology, Chonnam National University Medical School and Hospital, 42 Jebongro, Gwang-ju 61469, Republic of Korea. 2Department of Ophthalmology, Zhongshan Hospital, Fudan University, Shanghai 200032, People’s Republic of China.
Received: 9 March 2017 Accepted: 19 November 2017
References
1. Quigley HA, Broman AT. The number of people with glaucoma worldwide in 2010 and 2020. Br J Ophthalmol. 2006;90:262–7.
2. Kwon YH, Fingert JH, Kuehn MH, Alward WL. Primary open-angle glaucoma. N Engl J Med. 2009;360:1113–24.
3. Wax MB. Is there a role for the immune system in glaucomatous optic neuropathy? Curr Opin Ophthalmol. 2000;11:145–50.
4. Mun MJ, Kim JH, Choi JY, Jang WC. Genetic polymorphisms of interleukin genes and the risk of Alzheimer's disease: an update meta-analysis. Meta Gene. 2016;8:1–10.
5. Wang N, Chintala SK, Fini ME, Schuman JS. Activation of a tissue-specific stress response in the aqueous outflow pathway of the eye defines the glaucoma disease phenotype. Nat Med. 2001;7:304–9.
6. Namekata K, Harada C, Guo X, Kikushima K, Kimura A, Fuse N, et al. Interleukin-1 attenuates normal tension glaucoma-like retinal degeneration in EAAC1-deficient mice. Neurosci Lett. 2009;465:160–4.
7. Lin HJ, Tsai SC, Tsai FJ, Chen WC, Tsai JJ, Hsu CD. Association of interleukin 1beta and receptor antagonist gene polymorphisms with primary open-angle glaucoma. Ophthalmologica. 2003;217:358–64.
8. Wang CY, Shen YC, Lo FY, Su CH, Lee SH, Lin KH, et al. Polymorphism in the IL-1alpha (−889) locus associated with elevated risk of primary open angle glaucoma. Mol Vis. 2006;12:1380–5.
9. How AC, Aung T, Chew X, Yong VH, Lim MC, Lee KY, et al. Lack of association between interleukin-1 gene cluster polymorphisms and glaucoma in Chinese subjects. Invest Ophthalmol Vis Sci. 2007;48:2123–6. 10. Wang CY, Shen YC, Lo FY, Su CH, Lee SH, Tsai HY, et al. Normal tension
glaucoma is not associated with the interleukin -1alpha (−889) genetic polymorphism. J Glaucoma. 2007;16:230–3.
11. Wang CY, Shen YC, Su CH, Lo FY, Lee SH, Tsai HY, et al. Investigation of the association between interleukin-1beta polymorphism and normal tension glaucoma. Mol Vis. 2007;13:719–23.
12. Mookherjee S, Banerjee D, Chakraborty S, Banerjee A, Mukhopadhyay I, Sen A, et al. Association of IL1A and IL1B loci with primary open angle glaucoma. BMC Med Genet. 2010;11:99.
13. Markiewicz L, Majsterek I, Przybylowska K, Dziki L, Waszczyk M, Gacek M, et al. Gene polymorphisms of the MMP1, MMP9, MMP12, IL-1beta and TIMP1
and the risk of primary open-angle glaucoma. Acta Ophthalmol. 2013;91: e516–23.
14. Mookherjee S, Banerjee D, Chakraborty S, Mukhopadhyay I, Sen A, Ray K. Evaluation of the IL1 gene cluster single nucleotide polymorphisms in primary open-angle glaucoma pathogenesis. Genet Test Mol Biomarkers. 2016;20:633–6.
15. Liberati A, Altman DG, Tetzlaff J, Mulrow C, Gotzsche PC, Ioannidis JP, et al. The PRISMA statement for reporting systematic reviews and meta-analyses of studies that evaluate health care interventions: explanation and elaboration. J Clin Epidemiol. 2009;62:e1–e34.
16. Lv YB, Wang Y, Ma WG, Yan DY, Zheng WL, Chu C, et al. Association of Renalase SNPs rs2296545 and rs2576178 with the risk of hypertension: a meta-analysis. PLoS One. 2016;11:e158880.
17. Higgins JP, Thompson SG, Deeks JJ, Altman DG. Measuring inconsistency in meta-analyses. BMJ. 2003;327:557–60.
18. Boehringer S, Epplen JT, Krawczak M. Genetic association studies of bronchial asthma–a need for Bonferroni correction? Hum Genet. 2000;107:197.
19. Stuck AE, Rubenstein LZ, Wieland D. Bias in meta-analysis detected by a simple, graphical test. Asymmetry detected in funnel plot was probably due to true heterogeneity. BMJ. 1998;316(469):470–1.
20. Egger M, Davey SG, Schneider M, Minder C. Bias in meta-analysis detected by a simple, graphical test. BMJ. 1997;315:629–34.
21. Huang J, Xie ZK, Lu RB, Xie ZF. Association of interleukin-1 gene polymorphisms with multiple sclerosis: a meta-analysis. Inflamm Res. 2013;62:97–106.
22. Arman A, Isik N, Coker A, Candan F, Becit KS, List EO. Association between sporadic Parkinson disease and interleukin-1 beta−511 gene polymorphisms in the Turkish population. Eur Cytokine Netw. 2010;21:116–21.
23. Nicoll JA, Mrak RE, Graham DI, Stewart J, Wilcock G, MacGowan S, et al. Association of interleukin-1 gene polymorphisms with Alzheimer's disease. Ann Neurol. 2000;47:365–8.
24. Hall SK, Perregaux DG, Gabel CA, Woodworth T, Durham LK, Huizinga TW, et al. Correlation of polymorphic variation in the promoter region of the interleukin-1 beta gene with secretion of interleukin-1 beta protein. Arthritis Rheum. 2004;50:1976–83.
25. Dominici R, Cattaneo M, Malferrari G, Archi D, Mariani C, Grimaldi LM, et al. Cloning and functional analysis of the allelic polymorphism in the transcription regulatory region of interleukin-1 alpha. Immunogenetics. 2002;54:82–6.
26. Zhang X, Chintala SK. Influence of interleukin-1 beta induction and mitogen-activated protein kinase phosphorylation on optic nerve ligation-induced matrix metalloproteinase-9 activation in the retina. Exp Eye Res. 2004;78:849–60.
27. Chintala SK, Zhang X, Austin JS, Fini ME. Deficiency in matrix
metalloproteinase gelatinase B (MMP-9) protects against retinal ganglion cell death after optic nerve ligation. J Biol Chem. 2002;277:47461–8. 28. Neufeld AH, Sawada A, Becker B. Inhibition of nitric-oxide synthase 2 by
aminoguanidine provides neuroprotection of retinal ganglion cells in a rat model of chronic glaucoma. Proc Natl Acad Sci U S A. 1999;96:9944–8.
• We accept pre-submission inquiries
• Our selector tool helps you to find the most relevant journal • We provide round the clock customer support
• Convenient online submission • Thorough peer review
• Inclusion in PubMed and all major indexing services • Maximum visibility for your research
Submit your manuscript at www.biomedcentral.com/submit