R E S E A R C H A R T I C L E
Open Access
Ovarian morphology is associated with
insulin resistance in women with polycystic
ovary syndrome: a cross sectional study
Sara Pittenger Reid
1, Chia-Ning Kao
1, Lauri Pasch
1, Kanade Shinkai
2, Marcelle I. Cedars
1and Heather G. Huddleston
1*Abstract
Background:Polycystic ovary syndrome (PCOS) is a very common disorder well known to be associated with insulin resistance and metabolic disease. Insulin resistance is likely involved in the promotion of the PCOS reproductive phenotype and may mediate some of the ovarian morphology seen in the disorder. The phenotype of each individual woman with PCOS can vary widely as can her metabolic risk.
Methods:This is a cross-sectional study of patients seen in a multidisciplinary PCOS clinic at the University of California at San Francisco between 2006 and 2014.
All participants underwent systematic evaluation with anthropometric measurements, comprehensive skin exam, transvaginal ultrasound and laboratory studies at the time of their initial visit to the clinic. Serum samples were stored and androgen studies were carried out on all stored samples at the University of Virginia. Logistic regression was employed to evaluate the association between ovarian volume or follicle number and metabolic parameters (fasting insulin, HOMA-IR, fasting glucose, 2 h glucose, waist circumference) and hyperandrogenism (free testosterone, total testosterone, DHEAS, acanthosis nigricans), controlling for age.
Results:Three-hundred thirteen patients seen during the study period met Rotterdam criteria for PCOS and had sufficient measurements for inclusion in our analysis. The odds ratio of elevated HOMA-IR for patients with a maximum ovarian volume >10 cc was 1.9 compared to those with a maximum ovarian volume of≤10 cc (95% CI 1.0–3.4). The odds ratio of abnormal fasting insulin for patients with higher ovarian volume was 1.8 (95% CI 1.0–3.4) compared with those with lower ovarian volume. Follicle number was not significantly associated with any metabolic parameters. Conclusions:Increased ovarian volume is associated with markers of insulin resistance in PCOS. In concordance with prior studies, we did not find follicle number to be predictive of metabolic risk. Ovarian volume may serve as a useful tool to aid clinicians in their risk stratification and counseling of patients with PCOS.
Keywords:Polycystic ovary syndrome, Ovarian volume, Insulin resistance
Background
Polycystic ovary syndrome (PCOS) is a very common and heterogeneous disorder. Depending on the criteria used to diagnose PCOS, incidence estimates range from 4–9% of reproductive age women using the 1990 Na-tional Institutes of Health criteria [1–3] and as high as 12–21% using the 2003 Rotterdam criteria [4–7]. Among
these women, there is a wide range of physical, endo-crine and metabolic phenotypes.
It is well known that women with PCOS have an in-creased risk of insulin resistance, diabetes and metabolic syndrome [8–11]. These metabolic abnormalities are as-sociated with significant long-term morbidity. Insulin re-sistance, one of the earliest manifestations of metabolic disease, has been demonstrated to contribute signifi-cantly to the risk for coronary heart disease (CHD). In a recent National Health and Nutrition Examination Sur-vey (NHANES) study, insulin resistance was shown to * Correspondence:huddlestonh@obgyn.ucsf.edu
1Center for Reproductive Health, University of California at San Francisco,
2356 Sutter Street, San Francisco 94115, CA, USA
Full list of author information is available at the end of the article
be a stronger risk factor for CHD than diabetes [12]. It is well accepted that insulin resistance is a major driver of the metabolic phenotype in PCOS and is com-pounded by obesity [10, 8]. Insulin resistance likely also plays a role in promoting the PCOS reproductive pheno-type as insulin has been shown to increase theca andro-gen production and may mediate some of the ovarian morphology characteristics commonly seen in PCOS by driving theca cell proliferation [13].
The theca cells in women with PCOS appear to be more responsive to the actions of insulin than those of controls [10]. They secrete more androgens both basally and in response to stimulation by leutinizing hormone (LH) and insulin. Insulin acts as a co-gonadotropin in this case, modulating ovarian steroidogenesis [14].
Screening tests and medical treatments exist to detect and treat those with metabolic disease, but to date, iden-tifying which women with PCOS are at greatest risk has not been straightforward. It would be clinically useful to be able to predict an individual woman’s metabolic risk using her clinical phenotype.
There has been much discussion and disagreement surrounding the specific thresholds defining the ovarian criteria for PCOS. The 2003 Rotterdam criteria are cur-rently the most commonly used standard for classifying the morphology of polycystic ovaries [7]. Under Rotter-dam, polycystic ovary morphology (PCOM) is defined as a follicle number per ovary of≥12 and/or an ovarian volume of >10 cc in at least one ovary. The 2014 Andro-gen Excess and PCOS Society task force recommended the use of≥25 follicles and/or a volume of >10 cc [15]. Because of the existence of these morphologic criteria, specific ultrasound data regarding follicle number and volume exist for most women diagnosed with PCOS, providing clinicians with physical markers that may po-tentially be useful in stratifying patient phenotype and assessing future risk.
PCOM can be identified in approximately 30% of repro-ductive aged women [16, 17]. In normovulatory women, this finding has not been associated with an increased risk of metabolic disease [18]. In women with PCOS, the im-plications of PCOM are not entirely clear. In a very small study of 10 women with PCOS, women with PCOM showed slower glucose disappearance than those without PCOM [19]. A subsequent larger study in 240 Italian women failed to show a difference in insulin in women with and without PCOM. This study, however, used a more liberal definition of PCOM of >9 follicles or a vol-ume >7.5 cc [20]. Other studies on this question group follicle number per ovary and ovarian volume into one phenotype for comparisons and use a variety of definitions of PCOM making comparisons difficult [21]. Accordingly, there is no clear data regarding the associations of the in-dividual components of PCOM and metabolic risk.
We designed a study to determine if ovarian volume (OV) and/or follicle number (FN) are independently as-sociated with abnormal metabolic findings in women di-agnosed with PCOS. We hypothesized that ovarian morphology but not follicle number would be associated with a significantly higher odds of hyperinsulinemia among women with PCOS.
Methods
Study population and recruitment
This is a prospective, cross sectional study in which pa-tients attending the monthly multi-disciplinary PCOS clinic at the University of California at San Francisco (UCSF) were recruited consecutively between 2006 and 2014. Patients are referred to this clinic for evaluation to determine whether or not they meet criteria for a diag-nosis of PCOS and for management recommendations. The clinic is specifically targeted toward women who are not currently seeking fertility treatment. Patients were voluntarily consented to participate in the study based on a research protocol approved by the UCSF Commit-tee on Human Research. Participants were included if they met Rotterdam criteria for PCOS, with two out of three of the following features: oligo- or an-ovulation, clinical and/or biochemical hyperandrogenism, and the presence of 12 or more antral follicles in one ovary and/ or a maximum ovarian volume >10 cc [7]. Participants were excluded if they did not have complete ovarian morphology measurements.
Data collection
All participants presented for a single visit in which they completed a self-administered questionnaire and under-went systematic evaluation with anthropometric measure-ments, comprehensive dermatologist’s exam, transvaginal ultrasound, and blood work.
Outcome variables
Outcome variables studied included the following meta-bolic and androgen measurements. Metameta-bolic: fasting in-sulin >19 μIU/mL, HOMA-IR greater than 4 [22], fasting glucose >100 mg/dL, 2 h glucose >140 mg/dL, waist circumference >89 cm, and the presence or ab-sence of acanthosis nigricans. Hyperandrogenism: total testosterone >6.8 pg/mL, free testosterone >53 ng/dL, abnormal DHEAS with cutoff for abnormal level deter-mined by the references for each individual performing lab, mFG ≥8, presence of severe acne, and presence of androgenic alopecia.
A dermatologist performed a comprehensive skin examination of each patient to assess for cutaneous manifestations of hyperandrogenism and hyperinsuline-mia. Hirsutism was reported by a modified Ferriman-Gallwey (mFG), A score ≥8 was considered abnormal. Patients were evaluated for the presence of other cutane-ous findings of PCOS, including acne, androgenic alope-cia, and acanthosis nigricans [7, 23, 24]. Acne was categorized as“present” if the dermatologist determined that treatment for acne would be appropriate. Physio-logic acne that was rare and would not be treated was considered“absent”.
Metabolic testing included a 75 g 2-h oral glucose toler-ance test. The homeostasis model assessment-estimated insulin resistance (HOMA-IR) was calculated by multiply-ing fastmultiply-ing plasma insulinμIU/mL (FPI) by fasting plasma glucose mg/dL (FPG), then dividing by the constant 405 as described by Matthews [25]. Assay specifics are not re-ported for the metabolic parameters as they were drawn and analyzed at multiple different labs according to pa-tient insurance coverage.
Serum was collected and stored for all subjects who consented for participation in our biobank. In April 2014 in preparation for our androgen subanalysis, the serum of all consented subjects was analyzed for total testosterone and sex hormone biding globulin (SHBG). Total testosterone and SHBG were measured in singlet at the University of Virginia (UVA) Center for Research and Reproduction Ligand Assay and Analysis Core La-boratory (Charlottesville VA) and free testosterone was calculated using the law of mass action as previously de-scribed [26, 27].
Exposure variables
Our exposure variables were ovarian volume and follicle number. OV ≤10 cc was considered normal and OV >10 cc was considered elevated. FN was examined at 2 different cutoffs, FN <12 or≥12; FN <25 or≥25.
The larger of the two OV and higher FN were utilized for analysis. If one ovary was not measurable due to sur-gical absence or the presence of a cyst, the measure-ments of the other ovary were used. If neither ovary could be adequately visualized or if the measurements were absent in the records, the patient was excluded from the analysis.
Each patient’s transvaginal ultrasound was performed with one of two attending reproductive endocrinologists (M.I.C., H.G.H.). A Shizmadzu SDU-450XL machine with a variable 4- to 8-mHz vaginal transducer was used to measure the transverse, longitudinal, and anteropos-terior diameters of each ovary to calculate OV using the equation for volume of an ellipse. Follicles between 2 and 9 mm in diameter were counted in each ovary to give the FN.
Covariates
The covariates measured were age and BMI.
Statistical analysis
For analyses in which OV and FN were treated as dichot-omous variables, Rotterdam criteria or Androgen Excess and PCOS Society criteria for polycystic morphology were used to define the variable as normal or abnormal (OV
≤10 cc or >10 cc; FN <12 or≥12; FN <25 or≥25) [7]. T-tests were used to compare means of clinical variables by OV and FN as dichotomous variables. Logistic regression was used to evaluate the effect of OV and FN as dichot-omous and continuous variables on metabolic parameters while controlling for age. The number of observations in-cluded for each variable of interest is shown in Tables 1, 2, and 3. All computations were performed using SAS 9.3 for Windows, 32-bit edition.
Assays
Testosterone was measured by radioimmunoassay (RIA) [Coat-a-Count Kit; Siemens Healthcare Diagnositics; assay sensitivity 0.2–180 nmol/L; intraassay coefficient of variation (CV) = 4.4%; interassay CV = 6.4%]. SHBG was measured by Immulite [L2KSH2 Kit; Siemens Healthcare Diagnostics; assay sensitivity 6.1–1500.0 ng/ dl; intraassay (CV) = 2.8%; interassay CV = 6.5%]. Free testosterone was calculated using the following equation derived from the law of mass action:
fT
½ ¼ ð½T–ðN ½ fTÞ=fksTð½CSHBG–½ þT N fT½ Þg
where ksT= affinity constant of SHBG for T, N = kaTCa +1, kaT= affinity constant of albumin for T, and Ca = albumin concentration, assumed to be 4.5 gm/dL [26, 27].
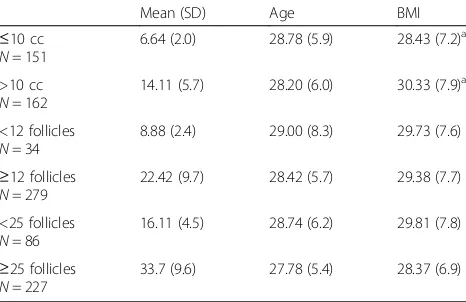
Table 1Cohort Characteristics
Mean (SD) Age BMI
≤10 cc
N= 151
6.64 (2.0) 28.78 (5.9) 28.43 (7.2)a
>10 cc
N= 162
14.11 (5.7) 28.20 (6.0) 30.33 (7.9)a
<12 follicles
N= 34
8.88 (2.4) 29.00 (8.3) 29.73 (7.6)
≥12 follicles
N= 279
22.42 (9.7) 28.42 (5.7) 29.38 (7.7)
<25 follicles
N= 86
16.11 (4.5) 28.74 (6.2) 29.81 (7.8)
≥25 follicles
N= 227
33.7 (9.6) 27.78 (5.4) 28.37 (6.9)
i. For all comparisons, the largest available ovarian volume and single ovary follicle number was used for each subject
a
Results
Study population
Four-hundred thirty-nine patients seen in the PCOS clinic during the study time period consented for in-clusion in the study. Of those, 355 were confirmed to have met Rotterdam criteria for PCOS. Fourty-two subjects meeting Rotterdam criteria were ex-cluded because they did not have complete ultra-sound data. Three-hundred thirteen patients meeting Rotterdam criteria for PCOS and having sufficient ovarian measurements for analysis comprised the study population.
Of the included patients, 89% met the Rotterdam FN criteria for PCO and 52% met the OV criteria (Table 1). Thirty-four patients had a FN <12 (8.88 ± 2.39), 279 pa-tients had a FN ≥12 (22.42 ± 9.69). One-hundred fifty-one patients had an OV of ≤10 cc (6.64 ± 1.97), 162 pa-tients had an OV >10 cc (14.11 ± 5.73). Two-hundred twenty-seven patients had a FN <25 (16.11 ± 4.5) and 86 had a FN ≥25 (33.7 ± 9.6). All groups were similar with respect to age, but patients with OV >10 cc had higher mean BMI, waist circumference, fasting insulin and HOMA-IR (Tables 1 and 2).
Follicle number
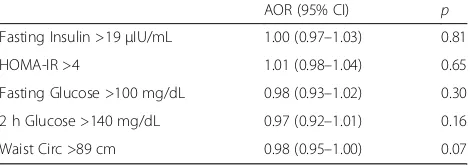
The analysis of FN as a dichotomous variable, control-ling for age, indicates that FN as defined by Rotterdam criteria does not predict abnormal metabolic indices among PCOS women in our study (Table 2). We per-formed an additional regression analysis examining FN as a continuous variable to confirm that the predeter-mined cut offs were not artificially concealing a differ-ence. There was no significant relationship between FN as a continuous variable and any of the metabolic indices (Table 3).
Ovarian volume
The logistic regression analysis of OV as a dichotomous variable, controlling for age, indicates that the odds of an abnormal fasting insulin was 1.8 and the odds of an abnormal HOMA- IR 1.9 for patients with a maximum OV >10 cc compared with patients with a maximum ovarian volume ≤10 cc. The relationship of OV with fasting glucose and 2-h glucose was not significant (Table 2).
Controlling for BMI attenuated the relationship be-tween insulin resistance and OV such that it was no lon-ger significant (data not shown). However, BMI and insulin resistance are highly co-linear. Further physio-logic evidence suggests that insulin resistance may be on the causal pathway linking BMI and OV due to the known stimulatory effect of insulin on ovarian thecal cells [13]. For these reasons, a decision was made not to use BMI in the final model.
We also examined the relationship between ovarian features and abnormal waist circumference. Similar to the other markers of insulin resistance, OV was related to increased waist circumference (although this finding Table 2Logistic Regression Analysis of Follicle Number and Ovarian Volume as Dichotomous Variables
Follicle Number ≥12 vs <12
Follicle Number ≥25 vs <25
Ovarian Volume >10 cc vs≤10 cc
AOR (95%CI) AOR (95%CI) AOR (95%CI)
Fasting Insulin >19μIU/mL 2.2 (0.7–7.0) 0.9 (0.5–1.8) 1.8 (1.0–3.4)
HOMA-IR >4 1.2 (0.4–3.4) 0.8 (0.4–1.6) 1.9a(1.0–3.6)
Fasting Glucose >100 mg/dL 0.9 (0.3–2.9) 0.5 (0.2–1.4) 1.8 (0.8–4.0)
2 h Glucose >140 mg/dL 0.9 (0.3–2.9) 0.4 (0.1–1.0) 1.3 (0.6–2.7)
Waist Circ >89 cm 0.9 (0.4–2.2) 0.7 (0.4–1.3) 1.6 (0.9–2.6)
Free Testosterone >6.8 pg/mL 4.2 (0.5–33.2) 2.2 (1.0–4.9) 1.8 (0.8–4.0)
Total Testosterone >53 ng/dL 0.9 (0.2–3.6) 1.5 (0.6–3.3) 1.1 (0.5–2.6)
Abnormal DHEAS 1.1 (0.4–3.0) 1.0 (0.5–2.1) 0.7 (0.4–1.3)
Acanthosis Nigricans Present 0.7 (0.3–1.5) 1.0 (0.6–1.6) 1.4 (0.9–2.3)
i. The largest available ovarian volume and single ovary follicle number was used ii. Adjusted OR were controlled for age
iii. DHEAS measurements were performed at multiple laboratory sites, the reference cutoff for each site was used to determine normal/abnormal status iv. HOMA-IR cutoff chosen to reflect more significant insulin resistance [22]
v. Fasting Insulin cutoff chosen to reflect the reference range of the laboratory used by majority of patients in the study a
indicatesp< 0.05
Table 3Logistic Regression Analysis of Follicle Number as a Continuous Variable
AOR (95% CI) p
Fasting Insulin >19μIU/mL 1.00 (0.97–1.03) 0.81
HOMA-IR >4 1.01 (0.98–1.04) 0.65
Fasting Glucose >100 mg/dL 0.98 (0.93–1.02) 0.30
2 h Glucose >140 mg/dL 0.97 (0.92–1.01) 0.16
Waist Circ >89 cm 0.98 (0.95–1.00) 0.07
did not reach significance) while FN was not. The OR of having a waist circumference >89 cm in patients with and OV >10 cc was 1.6 (0.9–2.6, p 0.08) compared to patients with an OV≤10 cc. For FN ≥12 vs <12 the un-adjusted OR was 0.9 (95% CI 0.4–2.2,p0.9).
PCO morphology and hyperandrogenism
In our subgroup analysis of the 150 participants with banked serum (48% of all participants), we found no as-sociation of OV with elevated free or total testosterone. FN when treated as a dichotomous variable of ≥12 vs <12 was also not associated with hyperandrogenemia. When FN≥25 vs <25 was examined, however, a FN≥25 was positively associated with free testosterone >6.8 pg/ mL (Table 2).
Discussion
PCOS is a common endocrinopathy with a highly het-erogeneous presentation. The association of PCOS with insulin resistance is well-known, however there is a lack of understanding regarding which patients with PCOS are most at risk of suffering adverse metabolic conse-quences. We investigated whether transvaginal ultra-sound findings can be used to identify women with concurrent abnormal metabolic phenotype.
In our cohort, women with PCOS and OV > 10 cc were 2 times more likely than those with OV≤10 cc to exhibit biochemical markers of insulin resistance. Con-versely, we found that although the vast majority of pa-tients with PCOS meet the FN criteria (>12 follicles per ovary), this finding is not associated with any abnormal metabolic parameters. Similarly, subjects meeting the newly recommended FN cutoff of 25 did not display more metabolic abnormalities than those not meeting this criteria. In summary, ovarian volume, but not fol-licle number, appears to predict metabolic abnormalities in a population of women with PCOS.
To date, there has been limited investigation regarding the individual components of PCO morphology and metabolic disease in adult women. One study examining the relationship of FN and OV with androgen levels and metabolic markers in women with PCOS (n= 88) failed to identify a correlation between OV or FN and indices of insulin resistance [28]. However, other smaller reports have suggested a relationship. In a study of 50 women with PCOS, Carmina showed that OV correlates with serum insulin (r= .37, P< .01) and the Quicki (r=−.31. P< .05) but does not correlate with BMI, LH, FSH or circulating androgens [29]. Among adolescents, Villa compared ovarian volume between 86 girls with PCOS and 48 controls, demonstrating that OV was associated with circulating insulin levels and markers of insulin re-sistance [30]. To our knowledge, our study is the largest
study of women with PCOS to report the association be-tween ovarian volume and markers of insulin resistance.
While there are multiple proposed explanations sur-rounding the pathophysiology of PCOS, it is well ac-cepted that insulin resistance is a major driver of the metabolic phenotype and is compounded by obesity [8, 10]. Insulin resistance is likely also a key contributor to the PCOS reproductive phenotype. Systemic hyperinsuli-nemia due to peripheral insulin resistance provides a mitogenic stimulation of ovarian theca cells leading to an expansion of the theca cell compartment and in-creased androgen production [31–33]. Additionally, in-sulin has been shown to lower sex hormone binding globulin, which can lead to increased free androgen levels and clinical hyperandrogenism. In turn, biochem-ical hyperandrogenemia likely exacerbates peripheral in-sulin resistance [10]. The inin-sulin-mediated theca cell expansion likely leads to increased stromal volume within the ovary. Our data reinforce the idea that in-creased OV may be serving as a measurable biomarker of increased levels of circulating insulin.
It is important to note that this cohort consisted exclu-sively of women with a confirmed diagnosis of PCOS. While some prior studies of ovulatory women meeting PCO morphology criteria have indicated an increased risk of higher fasting insulin and possibly insulin resistance [34], the majority of the data has not demonstrated an in-creased risk of metabolic dysfunction in regularly cycling women who meet only the follicle number or volume cri-teria for PCO [17, 34–37]. It is possible that the ovaries of women without PCOS who meet ovarian volume criteria are enlarged due to increased follicular mass rather than the increased theca cell/stromal mass possibly explaining the lack of association between ovarian volume and meta-bolic findings in a non-PCOS population. To date, there are no recommendations for ovulatory women meeting PCO criteria to undergo metabolic screening beyond the routine for their age and clinical risk factors.
Also important to consider is that cutoff for HOMA-IR in our study was 4, which is higher than in some similar studies. After many population based studies, there is no single set value for HOMA-IR that is consistently used to define insulin resistance [22]. In determining which value we would use, we intentionally selected a value intended to identify more significant cases of insulin resistance.
Our study is potentially limited by a lack of heterogen-eity in FN, skewed heavily towards numbers exceeding the Rotterdam cut off of 12. It is also important to note that Rotterdam FN criteria were used in diagnosing our patients with PCOS, which may be overly inclusive in light of current ultrasound technology and new guide-lines recommending higher FN cutoffs. Finally, our sam-ple size was insufficient to conclusively determine if OV has an effect on metabolic factors independent of BMI.
Conclusions
In summary, among the PCOS women in our study with an OV >10 cc the odds ratio for abnormal biochemical markers of insulin resistance was two times that of women with normal OV, indicating that OV is an im-portant factor associated with metabolic risk in women with PCOS. In contrast, follicle number was not associ-ated with clinical evidence of insulin resistance. Ovarian volume may thus serve as a physical biomarker of sys-temic hyperinsulinemia and the measurement of OV may provide a useful tool to aid clinicians in their risk stratification and counseling of patients with PCOS.
Abbreviations
BMI:Body mass index; CHR: Committee on Human Research; FN: Follicle number; FPG: Fasting plasma glucose; FPI: Fasting plasma insulin; HOMA-IR: Homeostasis model assessment-estimated insulin resistance;
LH: Luteinizing hormone; mFG: Modified Ferriman-Gallwey; NHANES: National Health and Nutrition Examination Survey; OR: Odds ratio; OV: Ovarian volume; PCOM: Polycystic ovary morphology; PCOS: Polycystic ovary syndrome; RIA: Radioimmunoassay; SHBG: Sex hormone binding globulin; UCSF: University of California, San Francisco; UVA: University of Virginia
Acknowledgments
The authors thank Dr Lee Zane, Lili Kuzmich and Gina Davis for their contributions to the care of our patients and the collection of data for this study.
Funding
The University of Virginia Center for Research in Reproduction Ligand Assay and Analysis Core is supported by the Eunice Kennedy Shriver NICHD/NIH (SCCPIR) Grant U54-HD28934.
Availability of data and materials
The dataset supporting the conclusions of this article is not publically available.
Authors’contributions
SRP, MIC, CNK and HGH designed the study. SRP, LP, KS, MIC and HGH examined patients in the PCOS clinic and collected and entered data. CNK provided statistical support. SRP drafted the manuscript. All authors revised and corrected the drafts and approved the final version of the manuscript.
Competing interests
None of the above authors have any disclosures, financial or otherwise, to make. An abstract involving a portion of the data from this submission was presented at the 2012 meeting of the American Society of Reproductive Medicine.
Consent for publication
Not applicable
Ethics approval and consent to participate
The Committee on Human Research (CHR), which serves as the Institutional Review Board for the University of California at San Francisco, must approve
all research involving human subjects at the UCSF. The CHR approved the research protocol and all data collection instruments employed in this study.
Publisher’s Note
Springer Nature remains neutral with regard to jurisdictional claims in published maps and institutional affiliations.
Author details
1
Center for Reproductive Health, University of California at San Francisco, 2356 Sutter Street, San Francisco 94115, CA, USA.2Dermatology, University of
California at San Francisco, 1701 Divisadero, San Francisco 94115, CA, USA.
Received: 8 November 2016 Accepted: 13 April 2017
References
1. Knochenhauser ES, Key TJ, Kahsar-Miller M, Waggoner W, Boots LR, Azziz R. Prevalence of the polycystic ovary syndrome in unselected black and white women of southeastern United States: a prospective study. J Clin Endocrinol Metab. 1998;83:3078–82.
2. Franks S. Polycystic ovary syndrome. N Engl J Med. 1995;333:853–61. 3. Azziz R, Woods KS, Reyna R, Key TJ, Knochenhauer ES, Yildiz BO. The
prevalence and features of the polycystic ovary syndrome in an unselected population. J Clin Endocrinol Metab. 2004;89:2745–9.
4. March WA, Moore VM, Willson KJ, Phillips DI, Norman RJ, Davies MJ. The prevalence of polycystic ovary syndrome in a community sample assessed under contrasting diagnostic criteria. Hum Reprod. 2010;25(2):544–51. 5. Eilertsen TB, Vanky E, Carlsen SM. Anti-Mullerian hormone in the diagnosis
of polycystic ovary syndrome: can morphologic description be replaced? Hum Reprod. 2012;27:2494–502.
6. Lauritsen MP, Bentzen JG, Pinborg A, Loft A, Forman JL, Thuesen LL, et al. The prevalence of polycystic ovary syndrome in a normal population according to the Rotterdam criteria versus revised criteria including anti-Mullerian hormone. Hum Reprod. 2014;29:791–801.
7. Rotterdam ESHRE/ASRM–Sponsored PCOS Consensus Workshop Group. Revised 2003 consensus on diagnostic criteria and long-term health risks related to polycystic ovary syndrome. Fertil Steril. 2004;81:19–25. 8. Burghan GA, Givens JR, Kitabchi AE. Correlation of hyperandrogenism with
hyperinsulinism in polycystic ovarian disease. J Clin Endocrinol Metab. 1980; 50:113–6.
9. Dunaif A, Segal KR, Futterweit W, Dobrjansky A. Profound peripheral insulin resistance, independent of obesity, in polycystic ovary syndrome. Diabetes. 1989;38:1165–74.
10. Diamanti-Kandarakis E, Dunaif A. Insulin resistance and the polycystic ovary syndrome revisited: an update on mechanisms and implications. Endocr Rev. 2012;33:981–1030.
11. Marcondes JA, Hayashida SA, Barcellos CR, Rocha MP, Maciel GA, Baracat EC. Metabolic syndrome in women with polycystic ovary syndrome: prevalence, characteristics and predictors. Arq Bras Endocrinol Metabol. 2007;51:972–9. 12. Kim J, Chae YK, Chernoff A. The risk for coronary heart disease according to
insulin resistance with and without type 2 diabetes. Endocr Res. 2013;38: 195–205.
13. Palaniappan M, Menon B, Menon KM. Stimulatory effect of insulin on theca-interstitial cell proliferation and cell cycle regulatory proteins through MTORC1 dependent pathway. Mol Cell Endocrinol. 2013;366(1):81–9. 14. Franks S, Gilling-Smith C, Watson H, Willis D. Insulin action in the normal
and polycystic ovary. Endocrinol Metab Clin North Am. 1999;28:361–78. 15. Dewailly D, Lujan ME, Cedars MI, Laven J, Norman RJ, Escobar-Morreale HF.
Definition and significance of polycystic ovarian morphology: a task force report from the Androgen Excess and Polycystic Ovary Syndrome Society. Hum Reprod Update. 2014;20:334–52.
16. Dewailly D, Pigny P, Soudan B, Catteau-Jonard S, Decanter C, Poncelet E, et al. Reconciling the definitions of polycystic ovary syndrome: the ovarian follicle number and serum anti-Mullerian hormone concentrations aggregate with the markers of hyperandrogenism. J Clin Endocrinol Metab. 2010;95:4399–405.
18. Johnstone EB, Rosen MP, Neril R, Trevithick D, Sternfeld B, Murphy R, et al. The polycystic ovary post-rotterdam: a common, age-dependent finding in ovulatory women without metabolic significance. J Clin Endocrinol Metab. 2010;95:4965–72.
19. Najmabadi S, Wilcox JG, Acacio BD, Thornton MH, Kolb BA, Paulson RJ. The significance of polycystic-appearing ovaries versus normal-appearing ovaries in patients with polycystic ovary syndrome. Fertil Steril. 1997;67:631–5. 20. Guastella E, Longo RA, Carmina E. Clinical and endocrine characteristics of
the main polycystic ovary syndrome phenotypes. Fertil Steril. 2010;94:2197–201. 21. Moran L, Teede H. Metabolic features of the reproductive phenotypes of
polycystic ovary syndrome. Hum Reprod Update. 2009;15:477–88. 22. Stern SE, Williams K, Ferrannini E, Defronzo RA, Bogardus C, Stern MP.
Identification of individuals with insulin resistance using routine clinical measurements. Diabetes. 2005;54(2):333–9.
23. Quinn M, Shinkai K, Pasch L, Kuzmich L, Cedars M, Huddleston H. Prevalence of androgenic alopecia in patients with polycystic ovary syndrome and characterization of associated clinical and biochemical features. Fertil Steril. 2014;101:1129–34.
24. Azziz R, Carmina E, Dewailly D, Diamanti-Kandarakis E, Escobar- Morreale HF, Futterweit W, et al. The Androgen Excess and PCOS Society criteria for the polycystic ovary syndrome: the complete task force report. Fertil Steril. 2009; 91:456–88.
25. Matthews DR, Hosker JP, Rudenski AS, Naylor BA, Treacher DF, Turner RC. Homeostasis model assessment: insulin resistance and beta-cell function from fasting plasma glucose and insulin concentrations in man. Diabetologia. 1985;28:412–9.
26. Rinaldi S, Geay A, Dechaud H, Biessy C, Zeleniuch-Jacquotte A, Akhmedkhanov A, et al. Validity of free testosterone and free estradiol determinations in serum samples from postmenopausal women by theoretical calculations. Cancer Epidemiol Biomarkers Prev. 2002;11:1065–71. 27. Vermeulen A, Verdonck L, Kaufman JM. A critical evaluation of simple
methods for the estimation of free testosterone. J Clin Endocrinol Metab. 1999;84:3666–72.
28. Legro RS, Chiu P, Kunselman AR, Bentley CM, Dodson WC, Dunaif A. Polycystic ovaries are common in women with hyperandrogenic chronic anovulation but do not predict metabolic or reproductive phenotype. J Clin Endocrinol Metab. 2005;90:2571–9.
29. Carmina E, Orio F, Palomba S, Longo RA, Lombardi G, Lobo RA. Ovarian size and blood flow in women with polycystic ovary syndrome and their correlations with endocrine parameters. Fertil Steril. 2005;84:413–9. 30. Villa P, Rossodivita A, Sagnella F, Moruzzi MC, Mariano N, Lassandro AP, et
al. Ovarian volume and gluco-insulinaemic markers in the diagnosis of PCOS during adolescence. Clin Endocrinol. 2013;78:285–90.
31. Duleba AJ, Spaczynski RZ, Olive DL. Insulin and insulin-like growth factor I stimulate the proliferation of human ovarian theca-interstitial cells. Fertil Steril. 1998;69:335–40.
32. Will MA, Palaniappan M, Peefel H, Kayampilly P, Menon KM. Metformin: direct inhibition of rat ovarian theca-interstitial cell proliferation. Fertil Steril. 2012;98:201–14.
33. Tosi F, Negri C, Perrone F, Dorizzi R, Castello R, Bonora E, et al. Hyperinsulinemia amplifies GnRH agonist stimulated ovarian steroid secretion in women with polycystic ovary syndrome. J Clin Endocrinol Metab. 2012;97:1712–9.
34. Adams JM, Taylor AE, Crowley Jr WF, Hall JE. Polycystic ovarian morphology with regular ovulatory cycles: insights into the pathophysiology of polycystic ovarian syndrome. J Clin Endocrinol. 2004;89:4343–50. 35. Michelmore KF, Balen AH, Dunger DB, Vessey MP. Polycystic ovaries and
associated clinical and biochemical features in young women. Clin Endocrinol. 1999;51:779–86.
36. Carmina E, Wong L, Chang L, Paulson RJ, Sauer MV, Stanczyk FZ, et al. Endocrine abnormalities in ovulatory women with polycystic ovaries on ultrasound. Hum Reprod. 1997;12:905–9.
37. Chang PL, Lindheim SR, Lowre C, Ferin M, Gonzalez F, Berglund L. Normal ovulatory women with polycystic ovaries have hyperandrogenic pituitary-ovarian responses to gonadotropin-releasing hormone-agonist testing. J Clin Endocrinol Metab. 2000;85:995–1000.
• We accept pre-submission inquiries
• Our selector tool helps you to find the most relevant journal • We provide round the clock customer support
• Convenient online submission • Thorough peer review
• Inclusion in PubMed and all major indexing services • Maximum visibility for your research
Submit your manuscript at www.biomedcentral.com/submit