R E S E A R C H A R T I C L E
Open Access
Prevalence and associated factors of
protein- energy wasting among patients
with chronic kidney disease at Mulago
hospital, Kampala-Uganda: a cross-sectional
study
Lydia Namuyimbwa
1*, Collins Atuheire
2,3, Joel Okullo
1and Robert Kalyesubula
1Abstract
Background:Chronic kidney disease (CKD) is global health concern and priority. It is the 12th leading cause of death worldwide. Protein Energy Wasting occurs in 20–25% of patients with chronic kidney disease and can lead to a high morbidity and mortality rate. We determined the prevalence of protein energy wasting and factors associated among patients with chronic kidney disease at Mulago National Referral Hospital, Kampala, Uganda.
Methods:We conducted a cross-sectional study recruiting 182 (89 non-CKD patients and 93 CKD patients) consecutively from the outpatient clinic and wards on New Mulago Hospital complex. We took anthropometric measurements including heights, weights, Triceps skin fold (TSF), Mid- Upper Arm circumference (MUAC), Body Mass Index (BMI) and Mid-arm muscle circumference (MAMC). Serum albumin levels and lipid profile levels were also obtained. Following consent of study participants, Data was collected using questionnaires and analyzed using STATA 14.1. Percentages, frequencies, means, medians, standard deviation and interquartile range were used to summarise data. Crude and adjusted binary logistic regression was performed to assess unadjusted and adjusted effect measures of protein energy wasting due to several factors. Stratification by CKD status was performed during the analysis to minimize confounding. Results:The median age for CKD patients was 39 years compared to 27 years for non-CKD participants (p< 0.001). The prevalence of protein energy wasting (PEW) was 68.6% in this study with 47.3 and 21.3% among CKD and non-CKD participants respectively. Factors which were associated with PEW included CKD age between 18 and 24, being single, catholic religion, CKD stage 4, Hb < 11.5 g/dl and LDL > 160 mg/dl.
Conclusion:Protein energy Wasting is prevalent among patients with chronic kidney disease and clinicians should routinely screen for it during patient care.
Keywords:Protein energy wasting, Chronic kidney disease, Anthropometric measurements
* Correspondence:namuyimbwalydia@yahoo.com
1Department of Physiology, College of Health Sciences, School of Biomedical
sciences, Makerere University, P.O Box 7076, Kampala, Uganda Full list of author information is available at the end of the article
Background
Chronic kidney disease (CKD) has become a global health concern worldwide. Its incidence is growing by around 8% annually making it the 12th leading cause of death glo-bally. The prevalence of CKD in the general population in the United States of America(USA) is 14% and diabetes and hypertension are the leading causes of CKD [1]. The speculated increase in the burden of diabetes and cardio-vascular disease in Africa to 130% by 2020 will lead to arise in the number of people suffering from CKD [2]. Prevalence of CKD in Uganda has been reported to be 15.2% and the risk factors for CKD include being female, age above 30 years and a high social economic class [3]. The Uganda Ministry of Health ministerial policy state-ment 2014/2015 allocated 0.01% of the total Ministry of Health budget to Non Communicable Diseases (NCDs) which is 3% of the total departmental budget. This is how-ever supplemented by a five year grant from the World Diabetes Federation (WDF) which expires at the end of 2017. The total budget for NCDs is 27,000 USD per annum however this funding was increased by 25% of the departmental budget [4]. This shows that the burden of NCDs is increasing in Uganda and this has caused finan-cial implications since it has put constraints on the Uganda National budget. Protein energy wasting (PEW) is common among patients with chronic kidney disease and it worsens as the glomerular filtration rate detoriates. The prevalence of PEW has been reported to be 20–25% in early to moderate CKD and increases as CKD progresses [5]. It can lead to increased number of hospitalization, in-creased susceptibility to infections and poor patient out-come [6]. PEW is a strong and independent predictor of death and quality of life in patients with kidney disease as well as graft loss in kidney transplant recipients. The inter-national society of renal nutrition and metabolism (ISRNM) panel recommends use of four major categories for the diagnosis of PEW which include; serum chemistry, body mass, muscle mass and dietary intake. However diagnosis of PEW can be made if three characteristics are present(low serum levels of albumin, reduced body mass and reduced muscle mass) [7]. Chronic kidney disease be-ing prevalent in Uganda (15.2%), it is important to study the nutrition status of CKD patients so that PEW can be diagnosed early, managed and prevented by clinicians dur-ing patient care. We hypothesized that there is a difference is in the nutrition status among CKD patients and partici-pants without CKD. This is largely driven by the restrict-ive diets that are often recommended for CKD patients along with the metabolic alterations and inflammation that predispose them to wasting. Protein energy wasting (PEW) among patients with CKD at Mulago Hospital and Uganda at large has not been characterized. This creates a gap in the nutritional management of these patients due to lack of baseline data. We determined the prevalence of
PEW and associated factors among patients with chronic kidney disease at Mulago hospital, using a cross sectional study.
Methods
Design and setting of the study
This was a cross sectional study involving patients with CKD aged 18 years and above and participants without CKD. The study was conducted at MulagoNational Refferal Hospital renal outpatients clinic.
Study participants
This research was conducted at Mulago National Refer-ral and teaching hospital. It is one of the three National referral hospitals in the country in addition to Mbarara and Butabika. Mulago National Referral Hospital is the largest hospital in Uganda and the teaching hospital of the Makerere University College of Health Sciences. It also serves as the general hospital for the Kampala metropolitan. It is one of the two national referral hospi-tals in Uganda, the other being Butabika National Refer-ral hospital. It offers services in most medical and sub surgical specialties and the care system is public. The hospital has an official bed capacity of 1790 beds although it houses over 3000 patients. This hospital is representative of the Ugandan population because it is a national referral hospital where all cases are referred to for better management. At the time of conducting this study in 2013, Mulago Hospital was the only hospital with a dedicated clinic for patients with CKD in Uganda. Patients with CKD were recruited from the renal out-patient clinic which is located at the fourth floor of Mulago Hospital. Participants without CKD were atten-dants of patients admitted on the wards in New Mulago hospital complex.
Patients with chronic kidney disease had a glomerular filtration rate of < 60 ml/min/1.73m2 for ≥3 months or any GFR with proteinuria, were aged 18 years and above and able to consent. Admitted patients and those on dialysis were excluded.
Selection of participants
A systematic sampling procedure was used to enroll patients as they were registered in the renal unit out patients register. The expected number of participants to be enrolled on a particular day was divided by the number of patients who attended the clinic that day and systematic sampling method was used. The participants in the out patients’clinic were met after their consulta-tions with the physicians and participants were recruited on clinic days until the sample size was achieved.
Participants without CKD were conveniently selected from the first to fourth floor of the New Mulago com-plex. Twenty two participants were conveniently selected from the four wards of the first three floors and twenty three were selected from the fourth floor.
Study variables
The outcome variable, Protein Energy Wasting (PEW) was measured as participants who were having BMI < 18.5 kgm−2and serum albumin < 3.8 g/100 ml and Mid upper arm circumference (MUAC) > 10% in relation to 50th percentile which is 22.5 cm in our study population [8].
Chronic Kidney Disease (CKD) was obtained using CKD-EPI equation:GFR=141 * min(Scr/κ,1)α* max(Scr/κ, 1)-1.209* 0.993Age* 1.018 [if female] * 1.159 [if black]
Scr is serum creatinine (mg/dL),κis 0.7 for females and 0.9 for males, α is −0.329 for females and−0.411 for males, min indicates the minimum of Scr/κor 1, and max indicates the maximum of Scr/κor 1.
eFGR stages were classed as follows: CKD [yes; < 60 ml/ min/1.73m2; No: ≥60 ml/min/1.73m2]. Then staging was done as follows: stage 1: > 90 ml/min/1.73m2; stage2: 60– 90 ml/min/1.73m2; stage3: 30–59 ml/min/1.73m2; stage4: 15–29 ml/min/1.73m2; stage5: < 15 ml/min/1.73m2[9].
The serum total cholesterol, triglycerides, low density li-poproteins (LDL), high density lili-poproteins (HDL), serum albumin and CRP were then analyzed using the COBAS INTEGRA 400 PLUS chemistry analyzer. Hemoglobin was analyzed using coulter autoloader machine according to the manufacturer’s standard operating procedures and quality assurance instructions. The urine protein was de-termined using the standard urine dipstick method follow-ing manufacturer’s instructions (UriCheck 10 ®).
Weight and height were measured for each patient with CKD and participant without CKD and body mass index (BMI) calculated. The mid-upper arm circumfer-ences (MUAC), triceps skin fold thickness (TSF) were measured and the mid-arm muscle circumference (MAMC) calculated. The CKD patients and participants without CKD had fasted for at least eight hours and the following investigations were carried out: lipid profile levels, serum albumin levels, urine protein, hemoglobin levels and C-reactive protein (CRP). All investigations were carried out in the chemistry laboratory of Mulago hospital which is CAP certified.
Statistical analysis
All analyses were done using STATA 14.2 (Statacorp 4905 Lakeway Drive, College station Texas 77,845 USA). Participants were stratified into CKD and non-CKD groups basing on eGFR and baseline comparison was done using z-test for proportions or Median test/Smirnov Kolmogrov test for non-normally distributed data across the two strata. (See details of the data set in
Additional file 1). Prevalence of Protein Energy Wasting (PEW) was summarized using percentages. Statistical comparison of proportions PEW across CKD and non-CKD was done using 95% CIs. To Control for confounding of CKD status, stratified analysis was performed. Crude binary logistic regression and Adjusted binary logistic regression were carried out of potential predictors on Protein Energy Wasting (PEW). Crude and adjusted odds ratios were reported respectively for both strata. At analysis, effect modification (using chunk test) and confounding (at 10% cut-off) were done appropriately. Statistical significance was considered atα≤0.05.
Results
Socio-demographic factors of study participants
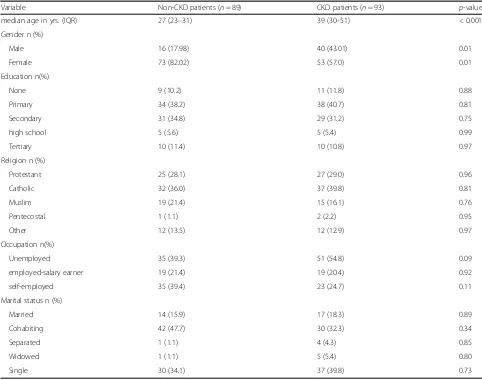
There were 93 participants with chronic kidney disease (CKD) and 89 without (non- CKD). There were significant differences in some of the socio-demographic factors among CKD and non-CKD participants. There were more females (126/182) than males (56/182) in our study. More females (60%, 73/126) were non CKD participants whereas more males (71%, 40/56) were CKD patients.
The median age for CKD patients was 39 years compared to 27 years for non-CKD participant (p< 0.001) as shown in Table1at the end of the document.
Anthropometric and biochemical parameters of study population
The major causes of CKD include; hypertension (48%), HIV (10.8%), Urological diseases (10.8%) and Diabetes mellitus (9.7%).
The median BMI was significantly lower (23.8 kg/m2) among patients with CKD compared to non CKD partic-ipants (25 kg/m2) with lower and upper quartile as 22 and 26.4 kg/m2respectively.
The median serum albumin was significantly lower (39.9 mg/dl) among CKD patients compared to non-CKD participants (41.5 mg/dl) with lower and upper quartile as 31.7 and 43.4 mg/dl respectively. Median Cholesterol level (4.91 mg/dl) and LDL (3.48 mg/dl) for CKD patients were significantly higher than those for non-CKD participants (3.95 mg/dl) and (3.48 mg/dl) (p= 0.001 andp= < 0.001 respectively).
Patients with CKD had a higher median creatinine level, as high as 1.8 mg/dl compared to 0.7 mg/dl for non-CKD participants, p< 0.001. Similarly the median CRP among CKD patients was as high as 4.48 mg/dl with lower and upper quartiles as 1.96 and 11.06 mg/dl respectively, much higher than that among non-CKD participants(1.53),p= 0.001.
Protein energy wasting among CKD patients
Prevalence of PEW among CKD patients was 44(47.3, 95%CI 37.2–57.5) as compared to 19(21.3, 95%CI 12.8– 29.9.) among the non-CKD participants.
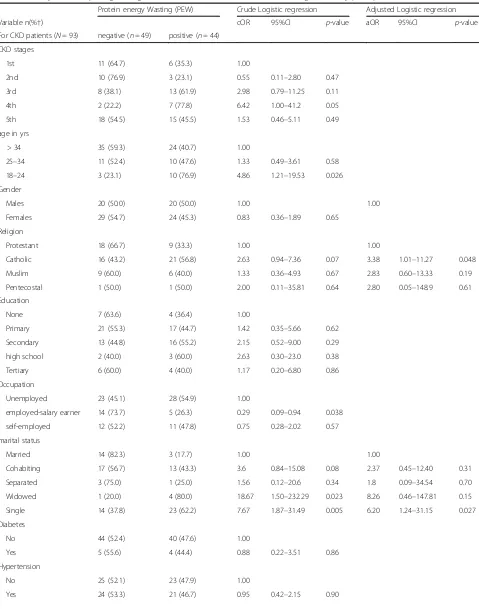
Factors associated with protein energy wasting among CKD patients attending Mulago hospital, Uganda
Among CKD patients; those participants aged 18–24 years were 5 times more likely to develop PEW compared to those over 34 years [cOR = 4.9; 95%CI 1.2–19.5]. Partici-pants who were single were 7.7 times more likely to de-velop PEW compared to those that were married [cOR = 7.7; 95%CI 1.9–31.5]. Catholics were 2.6 times more likely to develop PEW compared to participants who were of Anglican Faith [aOR = 3.4; 95%CI 1.01–11.3]. Participants who were salary earners were 70% less likely of developing PEW compared to those that were unemployed [cOR = 0.3; 95%CI 0.1–0.9].
HIV was positively associated with PEW, with about 3 times more risk of PEW among HIV positive as compared
to those that were HIV negative [cOR = 2.9; 95%CI 0.7– 12.0], however, the association was not statistically significant.
Patients with hemoglobin< 11.5 g/dl were approximately 3 times more likely to develop PEW compared to those with at least 11.50 g/dl [aOR = 2.85; 95%CI 1.0–8.4]. CKD patients with higher LDL, (> 160 mg/dl) were 2.9 times more likely to develop PEW compared to those with LDL of at most 160 mg/dl [cOR = 2.92; 95%CI 1.2–7.2].The stage of CKD was associated with PEW, especially CKD patients with 4th stage were 6.4 times more likely to de-velop PEW compared to stage 1 CKD as shown in Table3
at the end of the document.
Discussion
The results obtained from this study showed that Protein -energy wasting (PEW) was present in 47.3% (44/93) of the CKD patients compared to 21.3% (19/89) of the par-ticipants without CKD. This figure of 47.3% in this study is of significance to Uganda being a third world country.
Table 1Socio-demographic characteristics for the study population
Variable Non-CKD patients (n= 89) CKD patients (n= 93) p-value
median age in yrs. (IQR) 27 (23–31) 39 (30–51) < 0.001
Gender n (%)
Male 16 (17.98) 40 (43.01) 0.01
Female 73 (82.02) 53 (57.0) 0.01
Education n(%)
None 9 (10.2) 11 (11.8) 0.88
Primary 34 (38.2) 38 (40.7) 0.81
Secondary 31 (34.8) 29 (31.2) 0.75
high school 5 (5.6) 5 (5.4) 0.99
Tertiary 10 (11.4) 10 (10.8) 0.97
Religion n (%)
Protestant 25 (28.1) 27 (29.0) 0.96
Catholic 32 (36.0) 37 (39.8) 0.81
Muslim 19 (21.4) 15 (16.1) 0.76
Pentecostal 1 (1.1) 2 (2.2) 0.95
Other 12 (13.5) 12 (12.9) 0.97
Occupation n(%)
Unemployed 35 (39.3) 51 (54.8) 0.09
employed-salary earner 19 (21.4) 19 (20.4) 0.92
self-employed 35 (39.4) 23 (24.7) 0.11
Marital status n (%)
Married 14 (15.9) 17 (18.3) 0.89
Cohabiting 42 (47.7) 30 (32.3) 0.34
Separated 1 (1.1) 4 (4.3) 0.85
Widowed 1 (1.1) 5 (5.4) 0.80
This however lies within the reported 20 to 50% in the de-veloped world [10]. This figure also agrees with findings in India where the prevalence of PEW among chronic kidney patients was 42.7% [11]. Several studies have reported presence of PEW among dialysis patients than among other CKD groups; however this study highlights the pres-ence of PEW in the non dialysis kidney disease patients. It is important for clinicians to monitor routinely PEW in chronic kidney disease patients during patient care since PEW is a strong predictor of morbidity and mortality among this population [12]. These finding also have con-sequences as regards the management of patients with CKD in Uganda. PEW increases progression to ESRD as well as poor patient outcome. With the fewer dialysis cen-ters available in Uganda and the high cost for dialysis, this can cause financial constraints on the affected families and the country as well since part of the dialysis cost is covered by the Ugandan government. Early diagnosis and treatment of PEW among this population will delay pro-gression to End stage Renal Disease so the government costs on dialysis will reduce [13].
The median LDL was significantly high among the pa-tients with CKD as compared to participants without CKD [3.48(2.40–4.45) vs 3.48(2.4–3.25)]P= < 0.001.These finding compare with what was found in Jos university teaching hospital, Nigeria where the mean LDL was also significantly higher in the study group compared to the controls (2.90+ 1.56 mmol/L vs 1.87 + 1.00 mmol/L) [14]. These findings show that the LDL levels in this study were borderline high and since 48% of the CKD patients have hypertension as factor which would accelerate the devel-opment of coronary artery disease, maintaining their levels below 2.5 mmol/L would be protective against coronary artery disease.
The median total cholesterol was higher among the patients with CKD as compared to the participants with-out CKD [4.91(3.94–6.08) vs 3.95(3.31–4.80)] P= 0.001. These findings differ from Binyam Mamuye’s findings
where the mean total cholesterol was similar in both the kidney patients (166.8 ± 47.5 mg/dl) and the control group (166.3 ± 48.4 mg/dl)P = 0.400 [15]. Findings from this study show that the total cholesterol is still within the normal ranges. These patients may probably be on cholesterol lowering drugs for which this was not taken under consideration in this study which might have been one of our limitations .
The median CRP among CKD patients was as high as 4.48 mg/dl with lower and upper quartiles as 1.96 and 11.06 mg/dl respectively, much higher than that among non-CKD patients, p= 0.001 which was similar to what was reported in Nigeria. The increased levels of CRP in this study population indicate the inflam-matory response that usually occurs with chronic kid-ney disease. However it has also been reported that CRP is a valuable predictor of cardiovascular risk in CKD and it also plays a role in atherosclerosis. Levels> 3 mg/dl correspond to a high risk for cardio-vascular events, therefore patients in this study are at a high risk for cardiovascular events and therefore they should be monitored and interventions done in time to prevent cardiovascular events [16].
Factors associated with PEW
These finding of PEW being associated with age group 18–24 may probably be as a result of these young adults not being well familiar with the diet they are supposed to feed on as CKD patients. By their tender age, they are most likely to be psychologically affected by the disease more than any other age group. In Uganda it’s around this age that people finish school and start to think about start-ing their own families, this makes this age group to be-come more worried about their future and life span hence being at risk of developing PEW. Being single is a factor that can predispose to depression especially if someone has a chronic illness; therefore supportive care in form of counseling is usually helpful to single patients. Uganda is a
Table 2Anthropometric and biochemical parameters of the study population
Variable Non CKD Participants CKD Patients Pvalue
N= 89 N= 93
Mean MUAC(SD) 26.2 (3.1) 25.6 (3.3) 0.20
Median BMI in Kg/ m2(IQR) 25 (22.5–27.0) 23.8 (22.0–26.4) 0.04
Median serum albumin (IQR) 41.5 (39.9–44.1) 39.9 (31.7–43.4) 0.001
Median creatinine in mg/dl(IQR) 0.67 (0.57–0.79) 1.81 (1.09–7.08) < 0.001
Median total cholesterol in mmol/L(IQR) 3.95 (3.31–4.80) 4.91 (3.94–6.08) 0.001
Median HDL in mmol/L (IQR) 1.27 (1.01–1.54) 1.04 (0.79–1.34) 0.05
Median LDL in mmol/L (IQR) 3.48 (2.4–3.25) 3.48 (2.4–4.45) < 0.001
Median Hb in g/dl (IQR) 13.3 (12.6–14.4) 12.2 (10.3–14.0) 0.008
Median CRP in mg/dl(IQR) 1.53 (0.65–3.51) 4.48 (1.96–11.06) 0.001
Table 3Binary and Multiple logistic regression of factors associated with PEW among CKD study participants
Protein energy Wasting (PEW) Crude Logistic regression Adjusted Logistic regression
Variable n(%†) cOR 95%CI p-value aOR 95%CI p-value
For CKD patients (N= 93) negative (n= 49) positive (n= 44)
CKD stages
1st 11 (64.7) 6 (35.3) 1.00
2nd 10 (76.9) 3 (23.1) 0.55 0.11–2.80 0.47
3rd 8 (38.1) 13 (61.9) 2.98 0.79–11.25 0.11
4th 2 (22.2) 7 (77.8) 6.42 1.00–41.2 0.05
5th 18 (54.5) 15 (45.5) 1.53 0.46–5.11 0.49
age in yrs
> 34 35 (59.3) 24 (40.7) 1.00
25–34 11 (52.4) 10 (47.6) 1.33 0.49–3.61 0.58
18–24 3 (23.1) 10 (76.9) 4.86 1.21–19.53 0.026
Gender
Males 20 (50.0) 20 (50.0) 1.00 1.00
Females 29 (54.7) 24 (45.3) 0.83 0.36–1.89 0.65
Religion
Protestant 18 (66.7) 9 (33.3) 1.00 1.00
Catholic 16 (43.2) 21 (56.8) 2.63 0.94–7.36 0.07 3.38 1.01–11.27 0.048
Muslim 9 (60.0) 6 (40.0) 1.33 0.36–4.93 0.67 2.83 0.60–13.33 0.19
Pentecostal 1 (50.0) 1 (50.0) 2.00 0.11–35.81 0.64 2.80 0.05–148.9 0.61
Education
None 7 (63.6) 4 (36.4) 1.00
Primary 21 (55.3) 17 (44.7) 1.42 0.35–5.66 0.62
Secondary 13 (44.8) 16 (55.2) 2.15 0.52–9.00 0.29
high school 2 (40.0) 3 (60.0) 2.63 0.30–23.0 0.38
Tertiary 6 (60.0) 4 (40.0) 1.17 0.20–6.80 0.86
Occupation
Unemployed 23 (45.1) 28 (54.9) 1.00
employed-salary earner 14 (73.7) 5 (26.3) 0.29 0.09–0.94 0.038
self-employed 12 (52.2) 11 (47.8) 0.75 0.28–2.02 0.57
marital status
Married 14 (82.3) 3 (17.7) 1.00 1.00
Cohabiting 17 (56.7) 13 (43.3) 3.6 0.84–15.08 0.08 2.37 0.45–12.40 0.31
Separated 3 (75.0) 1 (25.0) 1.56 0.12–20.6 0.34 1.8 0.09–34.54 0.70
Widowed 1 (20.0) 4 (80.0) 18.67 1.50–232.29 0.023 8.26 0.46–147.81 0.15
Single 14 (37.8) 23 (62.2) 7.67 1.87–31.49 0.005 6.20 1.24–31.15 0.027
Diabetes
No 44 (52.4) 40 (47.6) 1.00
Yes 5 (55.6) 4 (44.4) 0.88 0.22–3.51 0.86
Hypertension
No 25 (52.1) 23 (47.9) 1.00
third world country with limited resources especially health workers. Scarcity of health workers who are in position to support patients psychologically creates a gap on how patients cope with the disease positively and they end up being depressed. This may alter their appetite leading to the development of PEW. A pa-tient having CKD and HIV is more likely to develop PEW because both illnesses can lead to wasting. The prevalence of HIV in Uganda has increased to 7.3% and the existence of both conditions together worsens PEW. LDL levels > 160 can predispose a patient to cardiovascular disease and the two conditions occur-ring together can increases the chances of developing PEW. Catholic region doesn’t forbid its followers from taking alcohol so patients with CKD and are Catholics are more likely to take alcohol which can impair their judgment and appetite leading to wast-ing. It is of importance that religious leaders preach against alcoholism especially emphasis being put on individuals with chronic illnesses. Patients in stage 4 are more likely to develop protein energy wasting since at this stage the levels of inflammation is so much and the increased levels of proinflammatory cy-tokines lead to anorexia and hence insufficient pro-tein and energy intake. This agrees with what was reported by Csaba where by PEW is more common
in the later stages of CKD and that stages 4 and 5 are more likely to be accompanied by worsening protein energy status [5].
Our study had several strengths; we were able to recruit a comparative arm to highlight the prevalence of PEW among CKD and non CKD participants. We undertook a comprehensive assessment of the anthropo-metric measurements for all the participants providing a comprehensive physical and biomedical assessment of wasting among our study participants.
However, our study had a few limitations, particularly on the area of dietary assessment. The dietary assess-ment is important in enabling us to assess the caloric intake of participants and may also help one to establish the cardiovascular risks associated with high caloric intakes and their contribution to CKD. This association could not be ascertained in this study. There are few studies which have used the ISRNM Criterion to diag-nose PEW and this has brought a gap in the comparison of findings from this study with findings from other settings where the same criterion has been used.
Conclusion
This study showed that PEW is common among patients with chronic kidney disease. Clinicians should routinely monitor and screen patients for PEW during patient care
Table 3Binary and Multiple logistic regression of factors associated with PEW among CKD study participants(Continued)
Protein energy Wasting (PEW) Crude Logistic regression Adjusted Logistic regression
Variable n(%†) cOR 95%CI p-value aOR 95%CI p-value
For CKD patients (N= 93) negative (n= 49) positive (n= 44)
urologic disease
No 45 (54.2) 58 (45.8) 1.00
Yes 4 (40.0) 6 (60.0) 1.78 0.47–6.76 0.40
Hb in g/dl
11.50–18.0 35 (62.5) 21 (37.5) 1.00 1.00
< 11.5 14 (37.8) 23 (62.2) 3.0 1.27–7.08 0.012 2.85 1.00–8.44 0.05
CRP in mg/dl
≤2.99 22 (57.9) 16 (42.1) 1.00
> 2.99 27 (49.1) 28 (50.9) 1.43 0.62–3.28 0.40
HIV
No 46 (55.4) 37 (44.6) 1.00
Yes 3 (30.0) 7 (70.0) 2.9 0.70–12.0 0.14
LDL in mg/dl
≤160 mg/dl 37 (61.7) 23 (38.3) 1.00 1.00
> 160 mg/dl 11 (35.5) 20 (64.5) 2.92 1.19–7.20 0.02 3.06 0.95–9.92 0.062
HDL in mg/dl
< 40 mg/dl 24 (52.2) 22 (47.8) 1.00
≥400 mg/dl 25 (53.2) 22 (46.8) 0.96 0.43–2.17 0.92
so as to reduce morbidity and mortality rates as well as improve patient outcome. Emphasis should not only be put on dialysis patients but also on the other stages of CKD since occurrence of PEW in these groups has been documented. This study was designed to determine the prevalence and associated factors of PEW among patients with chronic kidney disease at Mulago hospital. Further studies analyzing the contributions of dietary interven-tions and whether they can lead to improved patient outcome as regards to management of PEW are needed to develop policies and measures to prevent wasting.
Additional file
Additional file 1:Questionnaire. (ZIP 22 kb)
Abbreviations
BMI:Body Mass Index; CKD: Chronic Kidney Disease; CRP: C- Reactive Protein; eGFR: Estimated Glomerular Filtration Rate; ESRD: End Stage Renal Disease; ESRD: End Stage Renal Disease; HDL: High Density Lipoproteins; ISRNM: International Society of Renal Nutrition and Metabolism; LDL: Low Density Lipoproteins; MAMC: Mid Arm Muscle Circumference; MUAC: Mid-Upper Arm Circumference; NCDs: Non communicable Diseases; PEW: Protein Energy Wasting; SGA: Subjective Global Assessment; TSF: Triceps skin fold; WDF: World diabetes federation
Acknowledgements
We would like to warmly thank all the participants who voluntarily participated in this study and the physicians who collaborated with us to make this study possible. We also thank THRiVE and Carnegie for the financial support they provided in order for this work to be carried out.
Funding
This work was supported by Training Health Researchers into Vocational Excellence in East Africa (THRiVE), grant number 087540 funded by the welcome trust. It’s contents are solely the responsibility of the authors and do not necessarily represent the official views of the supporting offices. This work was also funded by Carnegie small competitive grants.
Availability of data and materials
The data sets supporting the conclusions of this manuscript are available in the additional supporting files.
Authors’contributions
LN was involved in the proposal development and writing, data collection, dissertation writing and manuscript writing. CA helped in study design, critical analysis of data and contributed to the whole process of manuscript writing. JO was involved proposal development and writing as well as dissertation writing. RK was involved in the proposal development and writing, dissertation writing as well manuscript writing. All authors read and approved the final manuscript.
Ethics approval and consent to participate
Ethical approval was obtained from Makerere University School of Biomedical Sciences Research Committee (SBSREC). Participants provided informed consent to participate in the study. Ethical approval was obtained on the 6th June 2012 and reference number (SBSREC-027).
Competing interests
The authors declare that they have no competing interests.
Publisher’s Note
Springer Nature remains neutral with regard to jurisdictional claims in published maps and institutional affiliations.
Author details
1Department of Physiology, College of Health Sciences, School of Biomedical
sciences, Makerere University, P.O Box 7076, Kampala, Uganda.2Department
of Biosecurity, Ecosystems and Veterinary Public Health, College of Veterinary Medicine, Animal Resources and Biosecurity (BEP), Makerere University, Kampala, Uganda.3Department of Public Health, School of Allied Health
Sciences, Kampala International University, Bushenyi, Kampala, Uganda.
Received: 2 December 2016 Accepted: 15 May 2018
References
1. States, K.D.S.f.t.U. [cited 2017 17/october]; Available from:https://www.niddk. nih.gov/health-information/health-statistics/kidney-disease.
2. Krzesinski J-M, Sumaili KE, Cohen E. How to tackle the avalanche of chronic kidney disease in sub-Saharan Africa: the situation in the Democratic Republic of Congo as an example. Nephrol Dial Transplant. 2007;22(2):332–5.
3. Kalyesubula R, et al. Kidney disease in Uganda: a community based study. BMC Nephrol. 2017;18(1):116.
4. Schwartz JI, et al. Looking at non-communicable diseases in Uganda through a local lens: an analysis using locally derived data. Glob Health. 2014;10(1):77. 5. Kovesdy CP, Kopple JD, Kalantar-Zadeh K. Management of protein-energy
wasting in non-dialysis-dependent chronic kidney disease: reconciling low protein intake with nutritional therapy. Am J Clin Nutr. 2013;97(6):1163–77. 6. Agaba EI, Agaba PA. Prevalence of malnutrition in Nigerians with chronic
renal failure. Int Urol Nephrol. 2003;36(1):89–93.
7. Fouque D, et al. A proposed nomenclature and diagnostic criteria for protein–energy wasting in acute and chronic kidney disease. Kidney Int. 2008;73(4):391–8.
8. Fouque D, et al. A proposed nomenclature and diagnostic criteria for protein–energy wasting in acute and chronic kidney disease. Int Soc Nephrol. 2008;73:391–8.
9. O’Callaghan CA, Shine B, Lasserson DS. Chronic kidney disease: a large-scale population-based study of the effects of introducing the CKD-EPI formula for eGFR reporting. BMJ Open. 2011;1:e000308.
10. Agaba EI, Agaba PA. Prevalence of malnutrition in Nigerians with chronic renal failure. Int Urol Nephrol. 2004;36(1):89–93.
11. Srivastava N, et al. Protein energy wasting in chronic kidney disease patients: a hospital based study. Indian J Prev Soc Med. 2012;43(4):390. 12. Peter Stenvinkel RP-F, Lindholm B. Leptin, ghrelin and proinflammatory
cytokines: compounds with nutritional impact in chronic kidney disease? Adv Chronic Kidney Dis. 2003;10(4):332–45.
13. Kuhlmann MK, et al. OPTA—malnutrition in chronic renal failure. Nephrol Dial Transplant. 2007;22(suppl_3):iii13–9.
14. Agaba I, et al. Serum lipids in pre Dialysis chronic renal failure patients in Jos University teaching hospital, Nigeria. Highland Med Res J. 2003;1(3):13–7. 15. Mamuye B. Assessement of Protein Energy Wasting in Patients with Chronic
Kidney disease attending Renal Unit at Tikuranbesa specialised hospital. Addis Ababa University: 2016.