R E S E A R C H
Open Access
MRI appearance of ovarian serous
borderline tumors of the micropapillary
type compared to that of typical ovarian
serous borderline tumors:
radiologic-pathologic correlation
Go Nakai
1*, Takashi Yamada
2, Kazuhiro Yamamoto
1, Yoshinobu Hirose
2, Masahide Ohmichi
3and Yoshifumi Narumi
1Abstract
Background:Serous borderline tumor (SBT) of the micropapillary type (SBT-MP) became one of the major pathological SBT diagnoses in addition to typical SBT, and was also defined as“non-invasive”low-gradeserous carcinoma according to the World Health Organization (WHO) classification in 2014. In this study, we investigated the MRI appearance of SBT-MP compared to that of typical SBT in order to identify specific imaging features of SBT-MP that correspond to pathological findings.
Methods:MR images of 6 histologically proven ovarian SBT-MP in four patients and 14 typical SBT in ten patients were reviewed retrospectively. Images were evaluated for laterality, size and morphology of the lesion and the solid component (SC) and signal intensity (SI) of the SC. MRI findings were correlated with pathological findings.
Results:The patients with SBT-MP (mean 26.3 years) were younger than those with typical SBT (mean 44.5 years).
Postoperative staging in patients with SBT-MP was II in two and III in two cases, while staging for typical SBT was I in seven, II in one and III in two cases. The morphologic patterns of SBT-MP were a unilateral cystic mass with intracystic mural nodules (CwMN) (n= 2), bilateral solid papillary masses (SM), and bilateral SM with CwMN. The pattern of typical SBT was CwMN (n= 13) in all but one lesion (SM with CwMN). All SCs showed inhomogeneous slight hyperintensity on T2 weighted images (WI) and high SI on diffusion-WI (DWI) except for in one typical SBT. Although diffuse proliferation of the tumor cells in micropapillary projections with little stroma seemed to correspond to inhomogeneous slightly hyperintense foci in SC on T2WI and high SI on DWI, similar MR findings were observed in typical SBT in all lesions on T2WI and 11 of 12 lesions on DWI. In typical SBT, inhomogeneous slightly hyperintense foci in SC on T2WI and high SI on DWI corresponded to highly cellular foci with densely branched papillae.
Conclusion:Pathological findings and clinical behavior of SBT-MP differed from those of typical SBT, but morphology and SI of SC on MRI were similar, with papillary projections demonstrating inhomogeneous slight hyperintensity on T2WI and high SI on DWI.
Keywords:Serous borderline tumor, Micropapillary, MRI, Imaging
* Correspondence:[email protected]
1Department of Radiology, Osaka Medical College, 2-7 Daigaku-machi, Osaka,
Takatsuki 569-8686, Japan
Full list of author information is available at the end of the article
© The Author(s). 2018Open AccessThis article is distributed under the terms of the Creative Commons Attribution 4.0
Background
Ovarian serous adenocarcinoma, which was defined as a malignant serous tumor according to the previous World Health Organization (WHO) classification in 2003 [1], was divided into two types, low-grade serous carcinoma (LGSC) and high-grade serous carcinoma, by the revised WHO classification in 2014 [2]. Serous borderline tumor (SBT) of the micropapillary type (SBT-MP) became one of the major pathological SBT diagnoses in addition to typical SBT, and was also defined as“non-invasive”LGSC. Several imaging reports regarding SBT have been published to date [3–5]. However, those cases might not be strictly divided into typical SBT and micropapillary type SBT because the previous WHO classification classified SBT into papillary cystic tumors, surface papillary tumors and adenofibromas, and cystadenofibromas primarily on the basis of macroscopic tumor cell proliferation as the major pathological diagnoses and did not include the micropapil-lary type until 2014.
Although SBT-MP account for only a small proportion of all SBT (10–15%), they exhibit more aggressive clin-ical behavior including invasive peritoneal implants and increased incidence of recurrence, which gives them a worse prognosis than that of typical SBT [6, 7]. Hence, it is important to distinguish between typical SBT and SBT-MP because aggressive surgical staging and debulking surgery may be recommended for SBT-MP.
MRI features specific to SBT-MP have never been in-vestigated in detail. In this study, we inin-vestigated the MRI appearance of SBT-MP compared to that of typical SBT in order to identify specific imaging features of SBT-MP that correspond to pathological findings.
Methods
Study subjects were selected from the four patients with SBT-MP and 20 patients with typical SBT who underwent surgery at our hospital between June 2009 and December 2016. Ten patients with typical SBT were excluded due to lack of availability of preoperative MR images (n= 4), col-lision tumor of the ovary associated with teratoma (n= 1), adnexal torsion (n= 1), rupture (n= 1) and recurrence (n= 3). Consequently, four patients with SBT-MP and ten patients with typical SBT were ultimately included in the study. Informed consent for clinical use of clinical data was obtained from each patient. The requirement for institutional review board approval was waived. Age and surgical staging were determined from medical records. MRI was performed with a 3.0-T superconducting magnet (Signa HDxt 3.0 T; GE Healthcare, Milwaukee WI, USA or 3 T MAGNETOM Skyra; Siemens Healthcare, Erlagen, Germany) for six patients (case 3 with SBT-MP and cases 3, 4, 5, 8 and 9 with typical SBT) and with a 1.5-T superconducting magnet (Signa HDxt; GE Healthcare, Milwaukee, WI or Achieva, Philips Healthcare, Best,
Netherlands or MAGNETOM Symphony; Siemens Health-care, Erlagen, Germany) using phased array coil for the others.
T2 weighted images (WI) were acquired in axial and sagittal planes. The scanning parameters for T2WI at 1.5 T [at 3.0 T] were as follows: TR (repetition time) range/TE (echo time) range, 3494–5117/90–108 [3750– 6315/52–103]; slice thickness, 5–7 mm [5–6 mm]; interslice gap, 1–2 mm [1–2 mm]; matrix, 192×256–276×400 mm [224 × 320–410 × 512]; FOV, 25–36 cm [26–36 cm]. Axial T1WI were acquired with a spin-echo [enhanced T1 high-resolution isotropic volume examination, eTHRIVE] TR range/TE range of 115–800/4.2–13 [3.85/1.92], a 5–7 mm [5 mm] slice thickness/1 mm [0 mm] interslice gap, and a 256×192–250×384 mm ] [224–244×304–320 matrix. For all patients except one (case 2 with typical SBT), diffusion-weighted (DW) images were acquired in the axial plane using the single-shot echo-planar technique. The scanning parameters at b values of 0 and 800 or 1000 [1000] s/mm2 were as follows: 2935–7500/65–70 [4700–6777/64–72]; slice thickness, 5–6 mm [5–6 mm]; interslice gap, 0–1 mm [0–1.2 mm]; matrix,144×112–128×192 mm [112×84– 192×128]; FOV, 36–40 [36]cm; NEX, 2–12 [1–5]. Diffusion-encoding gradients were applied along the three orthogonal directions of motion-probing gradi-ents. For ten patients (cases 1 and 4 with SBT-MP and all cases with typical SBT with the exception of cases 6 and 9), gadoxetic acid-enhanced images were obtained by fat-suppressed T1WI using the spectral attenuated inversion recovery (SPAIR) technique (Achieva, Philips Healthcare: 575–641/13; matrix, 288 × 201 mm; 5-mm section thickness and 25-cm field) or T1 weighted 3D sequence (liver acquisition with volume acceleration [LAVA] using the spectral presaturation with inversion recovery [SPIR] technique) (GE Healthcare: 3.37–3.65/ 1.74–2.07; flip angle, 12°; matrix, 256–320 × 192–224 mm; 5–6 mm section thickness and a 26–30 cm field). A 0.01 mmol/kg body weight dose of contrast agent was ad-ministered intravenously followed by a 20-ml saline flush.
MR images were analyzed by G.N., who has 12 years of experience in gynecological imaging. The MRI features of the tumors were assessed with respect to six categories: (1) laterality, (2) size and morphology, (3) septation of cys-tic components (CC), (4) size of the largest solid compo-nent (SC), (5) signal intensity (SI) of the largest SC and (6) the enhancement pattern.
classified as“hypointense”if it was equal to that of water, “hyperintense” if it was equal to that of fat, and “slightly hyperintense”if it was between hyperintense and hypoin-tense. On DWI, the SI of the SC was classified as “ hy-perintense” if the SI was equal to that of uterine endometrium, “hypointense” if it was equal to that of muscle, and “slightly hyperintense” if it was between hyperintense and hypointense.
Contrast enhancement was considered“intense”when the SI of the lesion was equal to that of uterine myometrium.
The amount of ascites was classified as small when it was limited to the pouch of Douglas, moderate when it was observed above the level of the uterine fundus, and large when abdominal distention due to ascites was ob-served. Peritoneal implantation was considered to have occurred when any nodule was observed in the intraper-itoneal space. The MRI findings were correlated with pathological findings by a gynecological pathologist (T.Y.) with 30 years of experience.
Statistical analyses were performed using the Wilcoxon rank sum test to confirm the difference in the maximum diameter of the tumor and the largest solid component between SBT-MP and typical SBT. The difference was regarded as significant when p-value was less than or equal to 0.05.
Results
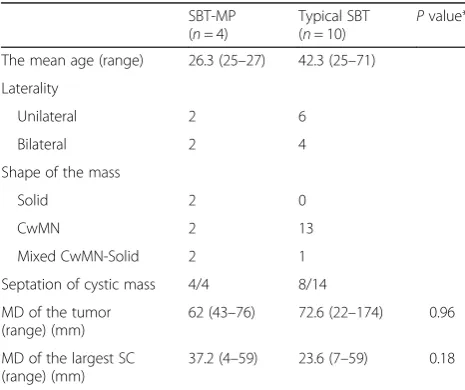
Age, laterality, size and morphology of lesions are sum-marized in Table 1. The age ranges for SBT-MP and typical SBT were 25–27 years (mean, 26.3 years) and 25–71 years (mean, 42.3 years), respectively. Two of four patients with SBT-MP and four of ten patients with typical SBT had bilateral ovarian involvement.
Fertility-sparing surgery was performed for two patients with SBT-MP and five patients with typical SBT, and standard ovarian borderline tumor surgery including total hysterectomy, bilateral salpingo-oophorectomy, and omentectomy was performed for the others. The stage of SBT-MP was IIa in two patients, IIIa in one patient, and IIIb in one patient, while that of typical SBT was Ia in five patients, Ib in one patient, Ic in one patient, IIc in one patient and IIIa in two patients. All six SBT-MP included mural nodules or solid components like typical SBT. The maximum diameter of SBT-MP ranged from 43 to 76 mm (mean, 62 mm), while that of typical SBT ranged from 22 to 174 mm (mean, 72.6 mm) (P= 0.96). The mean maximum diameter of the largest mural nodule or solid component of SBT-MP was 37.2 mm (range 4–59 mm), while that of typical SBT was 23.6 mm (range 7–59 mm) (P= 0.18).
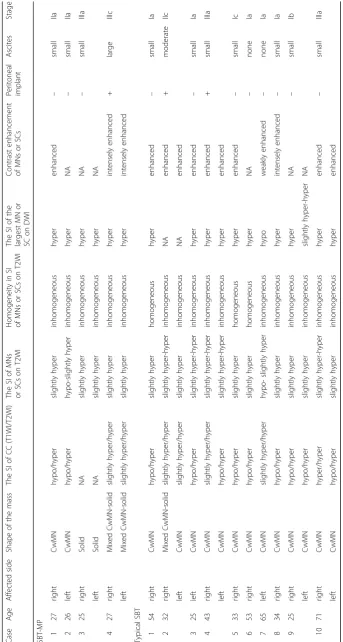
The MRI appearance of SBT-MP and typical SBT is summarized in Table 2. The morphologic pattern was bilateral tumors with a solid component on the surface of the normal ovarian structure (Fig. 1) in one patient with SBT-MP, bilateral tumors with solid components on the surface of a multicystic mass with intracystic mural nodules (Fig. 2) in another patient with SBT-MP, and a unilateral tumor with those features in one patient with typical SBT. The other lesions showed a multicystic mass with intracystic mural nodules (Fig. 3). Two of four CC of SBT-MP and four of 14 CC of typical SBT were slightly hyperintense on T1WI and hyperintense on T2WI, and the others were hypointense on T1WI and hyperintense on T2WI. The quality of CC in four of six cystic lesions which showed slight hyperintensity or hyperintensity on T1WI was mentioned in clinical records. Serous fluid was confirmed in two lesions and whitish mucinous fluid in the others. All mural nodules had a nodular shape and all SC had a papillary shape. All mural nodules and SC of SBT-MP showed inhomogeneous slight hyperintensity on T2WI and hyperintensity on DWI. Although SC of typical SBT also showed inhomogeneous slight hyperintensity on T2WI and hyperintensity on DWI, five lesions included hyperintense foci in their SC on T2WI (cases 2, 3, 4 and 10) (Fig. 4) and one lesion (case 7) showed hypointensity on DWI (Fig. 5). After administration of Gd-DTPA (gado-linium-diethylenetriamine pentaacetic acid), mural nod-ules and SC of the bilateral tumors in one patient with SBT-MP and (case 4; Fig. 2) and mural nodules of the uni-lateral mass in one patient with typical SBT were intensely enhanced. Mural nodules and SC of the other lesions were enhanced. A small amount of ascites was observed in three patients with SBT-MP and seven patients with typ-ical SBT, a moderate amount in one with typtyp-ical SBT, and a large amount in one with SBT-MP. Peritoneal dissemin-ation was obvious in one patient with SBT-MP (case 4; Fig. 2) and two patients with typical SBT (cases 2 and 4) but not detected in the others.
Table 1Age, laterality, size and morphology of lesions in
patients with ovarian SBT-MP and typical SBT
SBT-MP (n= 4)
Typical SBT
(n= 10) P
value*
The mean age (range) 26.3 (25–27) 42.3 (25–71)
Laterality
Unilateral 2 6
Bilateral 2 4
Shape of the mass
Solid 2 0
CwMN 2 13
Mixed CwMN-Solid 2 1
Septation of cystic mass 4/4 8/14
MD of the tumor (range) (mm)
62 (43–76) 72.6 (22–174) 0.96
MD of the largest SC (range) (mm)
37.2 (4–59) 23.6 (7–59) 0.18
Histopathological analysis of SBT-MP cases revealed that all mural nodules and solid components had a pap-illary architecture with a hierarchical internal branching fibrous stalk containing diffusely proliferating tumor cells in elongated micropapillary projections with little or no stromal support peripherally. Peripheral diffuse prolifera-tion of the tumor cells in elongated micropapillary projec-tions with little or no stromal support corresponded to areas of inhomogeneous slightly hyperintense foci on T2WI and hyperintense foci on DWI. In contrast, typical SBT lacked the peripheral diffuse proliferation of tumor cells in elongated micropapillary projections with little or no stromal support. Nevertheless, mural nodules and SC showing hyperintensity on DWI corresponded to highly cellular foci filled with densely branched papillae with little space among papillae. However, a scattered loose papillary architecture of peripheral vegetation with edema was ob-served in some cases, leading to hyperintense foci in solid components on T2WI and less signal intensity in those areas on DWI (case 3 with typical SBT; Fig. 4). Hyaline degeneration and edema within the proximal fibrous stalk were observed in both SBT-MP and typical SBT. These changes might make the stromal cellularity inhomogeneous and scanty, leading to the inhomogeneous hyperintensity on T2WI.
Discussion
The mean age of patients with typical SBT is reported to be 42 years (range, 36.8 to 43 years), whereas that of
patients with SBT-MP is 45 years, which is younger than patients with serous carcinoma. In our series the mean age was 26.3 years, which is much younger than patients with typical SBT or SBT-MP. Furthermore, the FIGO (International Federation of Gynecology and Obstetrics) stage of SBT-MP was stage II with noninvasive intrapel-vic implants in two patients and stage III with noninva-sive peritoneal implants in two patients. Considering that 65–80% of patients with typical SBT are in stage I, the stage of SBT-MP is more advanced than that of typical SBT, illustrating the aggressive feature. LGSC character-ized by KRAS, BRAF, and ERBB2 gene mutations is thought to show stepwise progression and develop from serous cystadenomas and SBT [8–10]. In fact, histopatho-logical analyses revealed transformation zones from typ-ical SBT in several places in our series (Fig. 3e).
The current WHO classification defines SBT-MP as a non-invasive tumor with a nonhierarchical branching architecture featuring micropapillary and/or cribriform patterns composed of rounded cells with scant cytoplasm and moderate nuclear atypia [2]. Although the characteris-tic shape and SI of SBT-MP on MRI resembled typical SBT, the causes of the SI corresponded to different histopatho-logical findings in this study. The inhomogeneous slight hyperintensity of papillary projections in patients with SBT-MP on T2WI corresponded to tumor cells prolif-erating densely as elongated thin micropapillae with little or no stromal support resulting in fewer spaces between papillary clusters. Although typical SBT lack
elongated thin micropapillae with little or no stromal support, the foci with densely branched papillae with little space among papillae seemed to result in slight hyperintensity on T2WI and hyperintensity on DWI. However, a loose papillary architecture of peripheral vegetation with edema was observed in some mural nodules and solid components of typical SBT, leading to hyperintensity on T2WI and less signal intensity on DWI. Consequently, mural nodules and solid components of SBT-MP can show lower signal intensity with obscure internal branching architecture on T2WI and higher sig-nal intensity on DWI than typical SBT. However, it is diffi-cult to differentiate SBT-MP from typical SBT by referring to SI of mural nodules and SC on MRI. Furthermore, hya-line degeneration and edema within the fibrous stalk in both SBT-MP and typical SBT were randomly observed histopathologically, further contributing to the inhomo-geneity in SI of mural nodules and SC on MRI. According to previous literature, the common MR finding of typical SBT is papillary projections that show high SI equal to water with a hypointense internal branching architecture
on T2WI, intermediate SI on DWI, and enhancement after administration of Gd-DTPA [5, 11]. The hypointen-sity of the internal branching architecture on T2WI corre-sponds to the fibrous stalk histopathologically. In contrast, the high SI of papillary projections on T2WI and inter-mediate SI on DWI are attributed to the peripheral edematous stalk with superficial epithelial cells, the loose structure of papillary projections, and fluid permeating multiple spaces between papillary clusters [3–5, 11, 12]. In contrast, most papillary projections of typical SBT showed inhomogeneous slight hyperintensity on T2WI and hyperintensity on DWI in this study. The discrepancies in SI imply that SI of papillary projections may depend on the number of spaces between papillary clusters and the amount of loose papillary architecture of peripheral vegetation with edema (Figs. 4, 5). In fact, the spaces between papillary clusters of mural nodules and SC in typical SBT varied due to their shape, even within the same tumor. Furthermore, the internal fibrous stalk did not always show hypointensity on T2WI due to its hya-line degeneration and edema (Figs. 1, 2).
Fig. 2Case 4 with SBT-MP. 27-year-old woman with bilateral ovarian SBT-MP. Sagittal T2WI (a) shows left solid papillary masses on the surface of multicystic masses with intracystic mural nodules. On axial T2WI (b), bilateral solid papillary masses demonstrate inhomogeneous slight hyperintensity and its internal branching architecture is partially detected as an inhomogeneous low signal branch-like structure is detected on T2WI (black arrow,a,
On fat-saturated gadolinium-enhanced T1WI, SBT-MP showed enhancement or intense enhancement with a slightly enhanced internal fibrous stalk. This enhancement pattern is similar to that of typical SBT, which indicates that although contrast-enhanced MRI may not be helpful in differentiating SBT-MP from SBT, it does increase the conspicuity of papillary projections, especially when they are small and endophytic (Fig. 4b) [13].
Basically, the SI of CC was equal to that of water, but two of four CC of SBT-MP and five of 14 CC of typical SBT showed slight hyperintensity or hyperin-tensity on T1WI. In previous literature, a yellow-green
mucoid fluid in the CC corresponded to hyperintense signal on T1WI [5].
Bilateral tumors were observed in two of four patients with SBT-MP and four of ten patients with typical SBT. In case 2 with SBT-MP, the patient underwent left salpingo-oophorectomy and had a relapse at the contralateral ovary after 2 years and 7 months. The relapsed contralateral ovary included several tiny lesions in the cortex that were not detected preoperatively on MRI. In cases with bilateral ovarian involvement, it is not easy to distinguish whether one is primary or metastatic or both are primary, even by pathological analysis of resected specimens. However, many
tiny cystic lesions that appeared deceptively normal on MRI were confirmed in both ovarian cortexes in case 3 with SBT-MP (Fig. 1). These findings suggest that SBT may be related to synchronous and metachronous disease.
They also imply a causal connection that incorporation of fallopian tube epithelium into ovarian cortical inclusion cysts during ovulation may also be the cause of low-grade serous neoplasms as well as high grade serous carcinoma.
Therefore, radiologists should carefully evaluate both ovaries when one ovary seems to be SBT on MRI.
This study has some limitations. Due to its retrospective nature and the small number of SBT-MP cases (n= 4), further investigation using MRI on more patients with SBT-MP is warranted.
Conclusions
Pathological findings and clinical behavior of SBT-MP differed from those of typical SBT, but their morphology and SI of SC on MRI were similar, with papillary projec-tions demonstrating inhomogeneous slight hyperinten-sity on T2WI and high SI on DWI.
Abbreviations
CA:carbohydrate antigen; CC: cystic component; CEA: carcinoembryonic antigen; CwMN: cystic mass with intracystic mural nodules; DWI: diffusion-weighted images; eTHRIVE: enhanced T1 high-resolution isotropic volume examination; FIGO: International Federation of Gynecology and Obstetrics; Gd-DTPA: gadolinium-diethylenetriamine pentaacetic acid; LAVA: liver acquisition with volume acceleration; LGSC: low-grade serous carcinoma; MRI: magnetic resonance imaging; SBT: serous borderline tumor; SBT-MP: serous borderline tumor of the micropapillary type; SC: solid component; SI: signal intensity; SM: solid papillary masses; SPAIR: spectral attenuated inversion recovery; SPIR: spectral presaturation with inversion recovery; T: tesla; TE: echo time; TR: repetition time; WHO: World Health Organization; WI: weighted images
Acknowledgements
Not applicable.
Funding
Not applicable.
Availability of data and materials
Please contact author for data requests.
Authors’contributions
GN corrected clinical data and drafted the manuscript. TY provided clinical and pathological information. KY helped with editing the manuscript. YH helped with editing the pathology section. MO and YN supervised and revised the final version of the manuscript. All authors have read and approved the final manuscript.
Ethics approval and consent to participate
No institutional review board approval was required. Informed consent for clinical use of clinical data was obtained from each patient.
Consent for publication
Informed consent for publication was obtained from each patient.
Competing interests
The authors declare that they have no competing interests.
Publisher’s Note
Springer Nature remains neutral with regard to jurisdictional claims in published maps and institutional affiliations.
Author details
1Department of Radiology, Osaka Medical College, 2-7 Daigaku-machi, Osaka,
Takatsuki 569-8686, Japan.2Department of Pathology, Osaka Medical College, 2-7 Daigaku-machi, Osaka, Takatsuki 569-8686, Japan.3Department of Obstetrics and Gynecology, Osaka Medical College, 2-7 Daigaku-machi, Osaka, Takatsuki 569-8686, Japan.
Received: 17 August 2017 Accepted: 2 January 2018
References
1. Wells M. WHO classification of tumors pathology and genetic tumors of the breast and female genital organs. Lyon: IARC Press. 2003;15(9):262–76. 2. Kurman R, et al. WHO classification of Tumours of female reproductive
organs. No 6. IARC WHO classification of Tumours, fourth edition. IARC: Lyon; 2014.
3. Naqvi J, Nagaraju E, Ahmad S. MRI appearances of pure epithelial papillary serous borderline ovarian tumours. Clin Radiol. 2015;70(4):424–32. 4. Tanaka YO, et al. Ovarian serous surface papillary borderline tumors form
sea anemone-like masses. J Magn Reson Imaging. 2011;33(3):633–40. 5. Zhao SH, et al. MRI appearances of ovarian serous borderline tumor: pathological correlation. J Magn Reson Imaging. 2014;40(1):151–6. 6. Burks RT, Sherman ME, Kurman RJ. Micropapillary serous carcinoma of the
ovary. A distinctive low-grade carcinoma related to serous borderline tumors. Am J Surg Pathol. 1996;20(11):1319–30.
7. Seidman JD, Kurman RJ. Subclassification of serous borderline tumors of the ovary into benign and malignant types. A clinicopathologic study of 65 advanced stage cases. Am J Surg Pathol. 1996;20(11):1331–45.
8. Malpica A, et al. Grading ovarian serous carcinoma using a two-tier system. Am J Surg Pathol. 2004;28(4):496–504.
9. Kuhn E, Kurman RJ, Shih IM. Ovarian cancer is an imported disease: fact or fiction? Curr Obstet Gynecol Rep. 2012;1(1):1–9.
10. Zeller C, et al. The DNA methylomes of serous borderline tumors reveal subgroups with malignant- or benign-like profiles. Am J Pathol. 2013;182(3): 668–77.
11. Zhao SH, et al. Diffusion-weighted MR imaging for differentiating borderline from malignant epithelial tumours of the ovary: pathological correlation. Eur Radiol. 2014;24(9):2292–9.
12. Outwater EK, et al. Papillary projections in ovarian neoplasms: appearance on MRI. J Magn Reson Imaging. 1997;7(4):689–95.
13. Van Vierzen PB, et al. Borderline ovarian malignancy: ultrasound and fast dynamic MR findings. Eur J Radiol. 1998;28(2):136–42.
• We accept pre-submission inquiries
• Our selector tool helps you to find the most relevant journal
• We provide round the clock customer support
• Convenient online submission
• Thorough peer review
• Inclusion in PubMed and all major indexing services
• Maximum visibility for your research
Submit your manuscript at www.biomedcentral.com/submit