Micronutrients among Normal, Overweight, and Obese Children
Under 5 Years in Amman
Loay S. Ibrahim and Reema F. Tayyem*
Department of Nutrition and Food Technology, Faculty of Agriculture, University of Jordan, Amman, Jordan. *Corresponding author: Dr. Reema F. Tayyem, Department of Nutrition and Food Technology, Faculty of Agriculture, The University of Jordan, Amman 11942, Jordan, Email: r.tayyem@ju.edu.jo.
Received: 23 Augaust 2017 Accepted: 29 Novmber 2017
Abstract
Background: This study primarily aimed to investigate the possible association between the risk of suffering from Iron Deficiency (ID) and body weight status among a group of obese, overweight, and normal body weight children. The second aim of this study was to assess Serum Iron (SI), Serum Ferritin (SF), Total Iron Binding Capacity (TIBC), Hemoglobin (Hb), and Body Mass Index (BMI) among the recruited children.
Materials and Methods: In this case-control study, a total of 150 disease-free children aged between 6-59 months were recruited conveniently from Amman. Children were grouped as normal body weight, overweight, and obese. BMI and BMI Z-scores were determined and the intake of many macro- and micronutrients were estimated. Serum iron, SF, TIBC, and Hb were measured to detect the presence of ID.
Results: The mean concentration of SI was significantly higher in normal body weight than in overweight and obese children. The mean concentration of TIBC was significantly lower in normal body weight children than that in overweight and obese children (P<0.05). Nutrients intake findings showed that daily intakes of saturated fat and sugar were significantly higher in overweight and obese children than those in normal children. Iron intake was significantly lower in normal body weight than in obese children. The daily intake of selenium was significantly higher among normal body weight and obese children than overweight children (p<0.05).
Conclusion: This study supports the findings of the presence of an association between weight gain and ID despite that iron intake among obese children was higher than those with normal body weight.
Keywords: Iron Deficiency, Obesity, Overweight, Macronutrients, Micronutrients
Introduction
Iron deficiency (ID) is the most common
nutritional deficiency in children
especially infants and toddlers (1), which could be related to their rapid growth and increased iron need as compared to older children (1). ID is a nutritional deficit that occurs due to inadequate levels of iron in
the body (2). The World Health
Organization (WHO) estimates that iron deficiency anemia (IDA) affects one quarter of the world's population and is
concentrated within preschool-aged
children and women; a majority of the anemia is due to ID. The negative consequences of IDA on cognitive and physical development of children, and work productivity of adults are of major concern (3). ID affects growth and
development during early life; both are associated with impaired cognitive abilities (4). Additionally, Fallah et al., (2013) demonstrated that iron deficiency can be an important risk factor for development of febrile convulsion (5).
Overweight and obesity are major risk factors for chronic illnesses such as cardiovascular diseases. Children with overweight or obesity are also at high risk of non-communicable diseases (NCDs),
premature death and disability in
adulthood (6). In addition, the economic costs of escalating problem of childhood overweight and obesity are considerable, both in terms of the enormous financial strains which places on health-care systems and in terms of lost economic productivity (7). The incredible increase in
obesity prevalence among children and adolescents could be attributed to the time spent in sedentary leisure activities such as watching television, playing video games,
and using computers because of
technology progress (8). Moreover, the increase in the consumption of foods high
in energy density and low in
micronutrients, especially iron, lead to the rise in obesity and ID occurrence among
children and adolescents (9). The
prevalence of ID in the United States is much higher among obese toddlers reaching a level of 20.3%, while for overweight and normal weight toddlers it was 8.1% and 7.1% respectively (2). However, in Jordan, the prevalence of
overweight between children almost
doubled between 1997 (4%) and 2009 (7%) according to Jordan Population and Family Health Survey (JPFHS) in 1997, 2002, 2009, while the prevalence of anemia among Jordanian children aged 6-59 months was about (32-34%) and remained stable during the period of 2009-2013 (10).
To our knowledge, there are no studies that focused on the association between body weight status and ID among children aged below 5 years in Jordan. Furthermore, the increase in the prevalence of ID as well as obesity among Jordanian children is alarming and more attention should be paid to this health problem. Therefore, the objectives of this study were to assess the levels of serum iron, serum ferritin, total iron binding capacity and hemoglobin in a selected group of sample of obese, overweight and normal body weight children; to evaluate nutrients' intake (macro- and micronutrients particularly iron intake) for the selected children by using 3 days’ food records; to investigate the correlation between the children nutrients' intake (of some macro- and micronutrients) and their body mass index (BMI) and the obtained biochemical
parameters; and to investigate the
association between body weight status
and the risk of suffering from ID among the recruited children.
Materials and Methods
Design and Study Sample
A case-control study was carried out during July 2016 to April 2017 to evaluate ID among overweight and obese children above 6 months and below 5 years, in a group of Jordanian children in Amman, Jordan. Infants below 6 months were excluded because most of them were breastfed and it was difficult to estimate precisely the nutrients intake. In this study, BMI and BMI Z-scores were calculated and the intake of many macro- and micronutrients were estimated. Serum iron (SI), serum ferritin (SF), total iron binding capacity (TIBC), and hemoglobin (Hb) were measured to detect the presence of ID. In this study, ID was defined using TIBC cut-off values which equal 240-450(µg/dl). A total of 175 children were assessed from Jordan University Hospital (Pediatric clinic) and from three Maternal and Child Centers of Ministry of Health for eligibility to participate in this study. Twenty-five participants were excluded because of their withdrawal due to blood
sampling or incomplete dietary
assessment. A total of 150 apparently healthy male and female children aged between 6-59 months were recruited conveniently according to inclusion and exclusion criteria and their medical history. The participants were divided into three groups of 50 obese, 50 overweight and 50 normal weight children depending on the BMI values. Children recruitment was carried out under the supervision of
pediatrician. Inclusion criteria were
Jordanian with normal body weight, overweight or obese boys or girls and 6 to less than 59 months old. Children who were suffering from known case of ID
anemia, celiac, rheumatoid, liver,
pulmonary, or kidney diseases, carcinoma, thalassemia, intestinal parasitic infections, physical disability, endocrine disorders
and neurological illness, taking
supplements containing iron and being on special therapeutic diet were excluded from the study. Parents of eligible children were asked to participate in the study.
Parents were provided with an
informational form containing a brief description of the nature of the study. Then written consent form was obtained from parents. Furthermore, parents have been told that all children’s results will be kept strictly confidential. Parents of children with ID were informed about their children ID status after collecting all the required information including dietary habits and medical history to make sure that no changes will take place until documenting the required information. The study was approved by the IRB committee of Jordan University Hospital and Ministry of Health. The ethical code for the IRB of Jordan University Hospital was 2016/131, while of the MOH was 2016/3741.
Anthropometric Measurements
Anthropometric measurements, including length, height and weight were determined according to Lee and Neiman (2013). Recumbent length (for children under age 24 months) was measured using calibrated length board while height (for children age 24 months and older) was measured
without shoes using a calibrated
Harpenden portable stadiometer. All the measurements were taken in duplicate with the children wearing light clothing and no shoes. Length and height was measured to the nearest 0.1 cm; and weight was measured to the nearest 0.1 kg on a portable Seca scale (model 0213) (Seca,
Hammer Steindamm, Hamburg,
Germany). BMI was calculated as: weight (kg)/ height (m)2. Overweight and obesity were categorized according to weight-for- age (z-score), according to WHO child growth standards (z- scores) (WHO, 2006) which defined overweight and obesity as ≥2SD and ≥ 3SD, respectively, and normal weight between 0 SD and less than 2 SD (12).
Blood Samples Collection and Biochemical Analyses
SI, SF, Hb, and TIBC were measured to find out children with ID. All parents kindly were asked to donate 5 ml venous blood sample from their children. The blood sample was drawn by a pediatric nurse at the nurse room. Tubes were labeled and transported in an ice box within an hour and analyzed at a private laboratory to check for SI, TIBC, and Hb according to the following biochemistry methods.
Non-hemolyzed serum samples were collected in the morning in order to avoid low results due to diurnal variation. Blood samples centrifuged at room temperature for 5 min at 6500xg. SF levels were examined using commercially available ELISA kit (Tina-quant Ferritin Gen. 4 Cobas c system, Ref. No. 04885317 190, Roche, Germany). Hemoglobin (Hb), SI, and TIBC were also analyzed in duplicate. Hemoglobin concentration was estimated by Colorimetric techniques based on light intensity principle. SI and TIBC were determined by quantitative calorimetric analysis, using commercial kit (Iron Gen.2 Cobas Integra/Cobas C System Ref. No.031836922 Roche, Germany) for measuring serum iron.
Cut-Off Values for Biochemical Iron Markers
Internationally accepted cut-off values for biochemical iron markers used in this study were as follows: Hb (g/l)= 9.5-14.5; SF (ng/ml) =29-160; and SI (µg/dl)= 25-115 (13).
Dietary Assessment
“Twenty-four- hour record” method was used for a duration of 3 days using the surrogate techniques to evaluate the daily intake of macronutrients, micronutrients and iron. Mothers were asked to record all foods and beverages (including snacks) at the time of eating during the food record period (2 random days and one weekend) of the food intakes (11). Standard
measuring tools were used to help mothers estimate portion size. After completing the records, subject’s dietary intakes were also analyzed using dietary analysis software (ESHA Food Processor SQL version 10.1.1; ESHA, Salem, OR) with additional data on foods consumed in Jordan (14).
Statistical Analysis
The data were statistically analyzed using SPSS (version 20). Categorical variables were analyzed by Chi square and reported as frequencies and percentages; whereas, continuous variables were presented as mean ± standard error. Post-hoc and Least Significant Difference (LSD) tests were used for multiple comparisons. Analysis of Variance (ANOVA) was used to determine differences of biochemical parameters (hemoglobin, iron serum, TIBC and ferritin), nutrients intake and BMI status among children which was stratified to three groups according to BMI status (normal weight, overweight and obese). The correlation between hemoglobin (g/l), iron serum, TIBC, ferritin serum levels with body mass index and different nutrients intake was tested by Pearson test (r). Linear Regression was performed to
examine the association of being
overweight or obese and the risk of having ID after adjusting for age. The risk was reported as odd ratio (OR) with 95% confidence interval (CI). Values at P-values < 0.05 was considered statistically significant.
Results
General Characteristic of the Sample Population
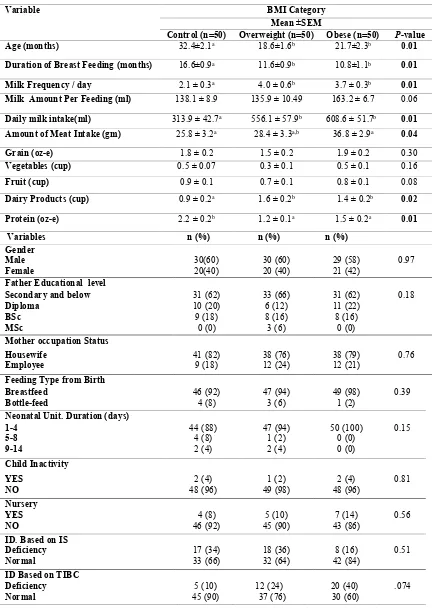
Table I presents the demographic and lifestyle characteristics of the sample of Jordanian children aged from 6 to 59 months based on their BMI status. For participant's age (months), duration of breast feeding (months), and frequency of milk consumption per day, a significant
statistical difference (P-value <0.01) was
detected between normal weight,
overweight and obese children, with
normal weight children showing oldest age, longest breast feeding duration, and least frequent to consume milk per day as compared to the other two groups. Amount of meat intake per day was found to be significantly (P-value=0.04) higher in obese body weight than overweight and normal children. On the other hand, the
dairy intake was significantly (P=0.02)
higher in overweight (1.6 ± 0.2) and obese (1.4±0.2) than in normal body weight children (0.9±0.2). Moreover, protein
intake was significantly (P=0.001) higher
in normal body weight children (2.2±0.2) than overweight (1.2±0.1) and obese weight children (1.5± 0.2). No significant difference was observed between children of three different groups of BMI status in the rest of variables.
Biochemical Measurements of Participants
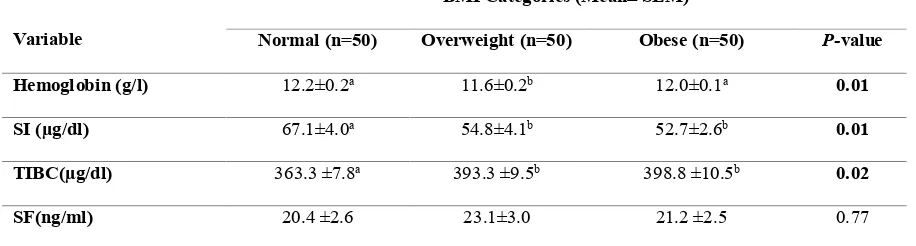
The study findings illustrated in Table II revealed that the mean of hemoglobin is
significantly (P=0.01) higher (12.2±0.2
g/l) in normal body weight and obese (12.0±0.1 g/l) children as compared with overweight children (11.6±0.2). The mean
concentration of SI (µg/dl) was
significantly (P=0.01) higher (67.1±4.0) in
normal body weight children than in overweight and obese children (54.8±4.1 and 52.7±2.6, respectively). On the other hand, the mean concentration of TIBC
(µg/dl) was significantly (P=0.02) lower
(363.3±7.8) in normal body weight children than that in overweight and obese
children (393.3±9.5 and 398.8±10.5,
respectively). No significant differences were found among children in the three groups concerning mean concentration of ferritin.
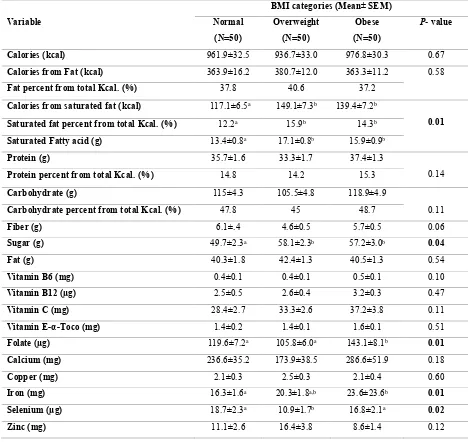
Daily Nutrients Intake of Participants
Table III shows that the means of daily intakes of saturated fat (g) and sugar (g) were significantly higher in overweight and obese children than those in normal children. No significant difference was found between body weight status and daily total calories intake and daily calories that
come from fat, except for calories from saturated fat which was significantly
(P=0.01) higher in overweight (149.1±7.3
Kcal) and obese (139.4±7.2 Kcal) than in
normal body weight children (117.1±6.5 Kcal). On the other hand, daily folate intake
was significantly (P<0.001) lower in
overweight (105.8±6.0 µg) and normal body weight (119.6±7.2 µg) than that in obese children (143.0 ±8.0µg). Similarly, the daily intake of iron was significantly
(P=0.01) lower in normal body weight
(16.3±1.6mg) than in obese (23.6.0±23.6.0
mg) children. The daily intake of selenium
was significantly (P=0.02) higher among
normal body weight and obese children
(18.7±2.3µg and 16.8±2.1 µg, receptively)
than overweight children (10.9±1.7µg). No significant differences were detected among normal body weight, overweight, and obese children regarding daily intake of other nutrients.
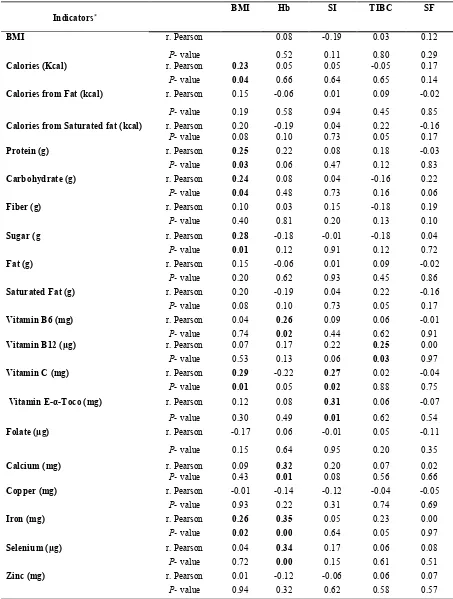
Correlations among Biochemical Indicators and Different Nutrients Intakes
In order to examine the association between hemoglobin, SI, TIBC, SF levels with BMI and different nutrients intake, partial correlations (r) were performed and
the results are summarized in Table IV. The study findings revealed that BMI was positively and significantly correlated with, protein, carbohydrate, sugar, iron, vitamin C, and calories intake. While Hb was significantly correlated with vitamin (vitamin B6) and three minerals (calcium, selenium and iron), IS was positively and significantly correlated only with vitamin
E-α-tocopherol and vitamin C.
Additionally, TIBC was positively and significantly correlated with the intake of
vitamin B12. However, all the correlations
were weak and not more than 0.35.
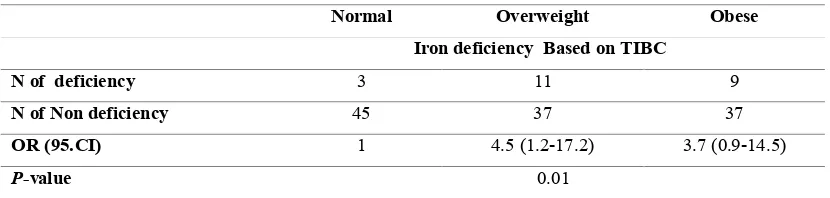
Association between BMI and Iron Deficiency:
Table V shows the OR (95% CI) of the risk of suffering from ID among overweight and obese weight children as compared to normal body weight children for the dependent variable TIBC level. The results revealed that overweight children had 4.5 times the risk of ID compared with normal body weight children. However, the obese children had 3.7 times the risk of ID compared with normal weight children,
(P-value = 0.01).
Table I: General and lifestyle characteristics of participants.
Data are presented as the mean ± SEM and as percentages; all are considered statistically significant at P< 0.05. Means within the same row with different superscript letters are significantly different. Abbreviations: SI: Serum Iron and TIBC: Total Iron Binding Capacity.
Variable BMI Category
Mean ±SEM
Control (n=50) Overweight (n=50) Obese (n=50) P-value
Age (months) 32.4±2.1a 18.6±1.6b 21.7±2.3b 0.01
Duration of Breast Feeding (months) 16.6±0.9a 11.6±0.9b 10.8±1.1b 0.01
Milk Frequency / day 2.1 ± 0.3a 4.0 ± 0.6b 3.7 ± 0.3b 0.01
Milk Amount Per Feeding (ml) 138.1 ± 8.9 135.9 ± 10.49 163.2 ± 6.7 0.06
Daily milk intake(ml) 313.9 ± 42.7a 556.1 ± 57.9b 608.6 ± 51.7b 0.01
Amount of Meat Intake (gm) 25.8 ± 3.2a 28.4 ± 3.3a,b 36.8 ± 2.9a 0.04
Grain (oz-e) 1.8 ± 0.2 1.5 ± 0.2 1.9 ± 0.2 0.30
Vegetables (cup) 0.5 ± 0.07 0.3 ± 0.1 0.5 ± 0.1 0.16
Fruit (cup) 0.9 ± 0.1 0.7 ± 0.1 0.8 ± 0.1 0.08
Dairy Products (cup) 0.9 ± 0.2a 1.6 ± 0.2b 1.4 ± 0.2b 0.02
Protein (oz-e) 2.2 ± 0.2b 1.2 ± 0.1a 1.5 ± 0.2a 0.01
Variables n (%) n (%) n (%) Gender
Male Female
30(60) 20(40)
30 (60) 20 (40)
29 (58) 21 (42)
0.97 Father Educational level
Secondary and below Diploma
BSc MSc
31 (62) 10 (20) 9 (18)
0 (0)
33 (66) 6 (12) 8 (16) 3 (6)
31 (62) 11 (22) 8 (16)
0 (0)
0.18
Mother occupation Status Housewife
Employee
41 (82) 9 (18)
38 (76) 12 (24)
38 (79) 12 (21)
0.76
Feeding Type from Birth Breastfeed
Bottle-feed
46 (92) 4 (8)
47 (94) 3 (6)
49 (98) 1 (2)
0.39
Neonatal Unit. Duration (days) 1-4
5-8 9-14
44 (88) 4 (8) 2 (4)
47 (94) 1 (2) 2 (4)
50 (100) 0 (0) 0 (0)
0.15
Child Inactivity
YES NO
2 (4) 48 (96)
1 (2) 49 (98)
2 (4) 48 (96)
0.81
Nursery YES NO
4 (8) 46 (92)
5 (10) 45 (90)
7 (14) 43 (86)
0.56
ID. Based on IS Deficiency Normal
17 (34) 33 (66)
18 (36) 32 (64)
8 (16) 42 (84)
0.51
ID Based on TIBC Deficiency
Normal
5 (10) 45 (90)
12 (24) 37 (76)
20 (40) 30 (60)
.074
Table II: Biochemical measurements of participants
Variable
BMI Categories (Mean± SEM)
Normal (n=50) Overweight (n=50) Obese (n=50) P-value
Hemoglobin (g/l) 12.2±0.2a 11.6±0.2b 12.0±0.1a 0.01
SI (µg/dl) 67.1±4.0a 54.8±4.1b 52.7±2.6b 0.01
TIBC(µg/dl) 363.3 ±7.8a 393.3 ±9.5b 398.8 ±10.5b 0.02
SF(ng/ml) 20.4 ±2.6 23.1±3.0 21.2 ±2.5 0.77
- Data are presented as the mean ± SEM and as percentages; all are considered statistically significant at P< 0.05.
- Abbreviations: SI: Serum Iron, SF: Serum ferritin and TIBC: Total Iron Binding Capacity.
Table III: Nutrient intakes of participants according to the BMI categories.
Variable
BMI categories (Mean± SEM)
Normal
(N=50)
Overweight
(N=50)
Obese
(N=50)
P- value
Calories (kcal) 961.9±32.5 936.7±33.0 976.8±30.3 0.67
Calories from Fat (kcal) 363.9±16.2 380.7±12.0 363.3±11.2 0.58
Fat percent from total Kcal. (%) 37.8 40.6 37.2
Calories from saturated fat (kcal) 117.1±6.5a 149.1±7.3b 139.4±7.2b
0.01
Saturated fat percent from total Kcal. (%) 12.2a 15.9b 14.3b
Saturated Fatty acid (g) 13.4±0.8a 17.1±0.8b 15.9±0.9b
Protein (g) 35.7±1.6 33.3±1.7 37.4±1.3
0.14
Protein percent from total Kcal. (%) 14.8 14.2 15.3
Carbohydrate (g) 115±4.3 105.5±4.8 118.9±4.9
0.11
Carbohydrate percent from total Kcal. (%) 47.8 45 48.7
Fiber (g) 6.1±.4 4.6±0.5 5.7±0.5 0.06
Sugar (g) 49.7±2.3a 58.1±2.3b 57.2±3.0b 0.04
Fat (g) 40.3±1.8 42.4±1.3 40.5±1.3 0.54
Vitamin B6 (mg) 0.4±0.1 0.4±0.1 0.5±0.1 0.10
Vitamin B12 (µg) 2.5±0.5 2.6±0.4 3.2±0.3 0.47
Vitamin C (mg) 28.4±2.7 33.3±2.6 37.2±3.8 0.11
Vitamin E-α-Toco (mg) 1.4±0.2 1.4±0.1 1.6±0.1 0.51
Folate (µg) 119.6±7.2a 105.8±6.0a 143.1±8.1b 0.01
Calcium (mg) 236.6±35.2 173.9±38.5 286.6±51.9 0.18
Copper (mg) 2.1±0.3 2.5±0.3 2.1±0.4 0.60
Iron (mg) 16.3±1.6a 20.3±1.8a,b 23.6±23.6b 0.01
Selenium (µg) 18.7±2.3a 10.9±1.7b 16.8±2.1a 0.02
Zinc (mg) 11.1±2.6 16.4±3.8 8.6±1.4 0.12
- Data are presented as the mean ± SEM; and are considered statistically significant at P<0.05.
- Means within the same row with different superscript letters are significantly different.
Table IV. Correlations among biochemical indicators and different nutrients intakes SF TIBC SI Hb BMI Indicators* 0.12 0.03 -0.19 0.08 r. Pearson BMI 0.29 0.80 0.11 0.52
P- value
0.17 -0.05 0.05 0.05 0.23 r. Pearson Calories (Kcal) 0.14 0.65 0.64 0.66 0.04
P- value
-0.02 0.09 0.01 -0.06 0.15 r. Pearson
Calories from Fat (kcal)
0.85 0.45
0.94 0.58
0.19
P- value
-0.16 0.22 0.04 -0.19 0.20 r. Pearson
Calories from Saturated fat (kcal)
0.17 0.05
0.73 0.10
0.08
P- value
-0.03 0.18 0.08 0.22 0.25 r. Pearson Protein (g) 0.83 0.12 0.47 0.06 0.03
P- value
0.22 -0.16 0.04 0.08 0.24 r. Pearson Carbohydrate (g) 0.06 0.16 0.73 0.48 0.04
P- value
0.19 -0.18 0.15 0.03 0.10 r. Pearson Fiber (g) 0.10 0.13 0.20 0.81 0.40
P- value
0.04 -0.18 -0.01 -0.18 0.28 r. Pearson Sugar (g 0.72 0.12 0.91 0.12 0.01
P- value
-0.02 0.09 0.01 -0.06 0.15 r. Pearson Fat (g) 0.86 0.45 0.93 0.62 0.20
P- value
-0.16 0.22 0.04 -0.19 0.20 r. Pearson
Saturated Fat (g)
0.17 0.05
0.73 0.10
0.08
P- value
-0.01 0.06 0.09 0.26 0.04 r. Pearson
Vitamin B6 (mg)
0.91 0.62
0.44 0.02
0.74
P- value
0.00 0.25 0.22 0.17 0.07 r. Pearson
Vitamin B12 (µg)
0.97 0.03
0.06 0.13
0.53
P- value
-0.04 0.02 0.27 -0.22 0.29 r. Pearson
Vitamin C (mg)
0.75 0.88
0.02 0.05
0.01
P- value
-0.07 0.06 0.31 0.08 0.12 r. Pearson
Vitamin E-α-Toco (mg)
0.54 0.62
0.01 0.49
0.30
P- value
-0.11 0.05 -0.01 0.06 -0.17 r. Pearson Folate (µg) 0.35 0.20 0.95 0.64 0.15
P- value
0.02 0.07 0.20 0.32 0.09 r. Pearson Calcium (mg) 0.66 0.56 0.08 0.01 0.43
P- value
-0.05 -0.04 -0.12 -0.14 -0.01 r. Pearson Copper (mg) 0.69 0.74 0.31 0.22 0.93
P- value
0.00 0.23 0.05 0.35 0.26 r. Pearson Iron (mg) 0.97 0.05 0.64 0.00 0.02
P- value
0.08 0.06 0.17 0.34 0.04 r. Pearson Selenium (µg) 0.51 0.61 0.15 0.00 0.72
P- value
0.07 0.06 -0.06 -0.12 0.01 r. Pearson Zinc (mg) 0.57 0.58 0.62 0.32 0.94
P- value
* Data are considered statistically significant at P<0.05.
- Abbreviations: BMI: Body Mass Index, Hb: Hemoglobin, SI: Serum Iron, SF: Serum ferritin and TIBC: Total Iron Binding Capacity.
Table V: Odds ratios (95% confidence intervals) of overweight and obese weight children for
association with iron deficiency based on TIBC*
Normal Overweight Obese
Iron deficiency Based on TIBC
N of deficiency 3 11 9
N of Non deficiency 45 37 37
OR (95.CI) 1 4.5 (1.2-17.2) 3.7 (0.9-14.5)
P-value 0.01
* Data are considered statistically significant at P<0.05.
Values are age-adjusted correlation coefficients.
Discussion
Obesity is a low grade chronic
proinflammatory disease that leads to
imbalance between levels of iron
biomarkers (15). The present study showed a significant negative correlation between the duration of BF and being overweight and obese (as duration of breastfeeding decreased, the possibility of being overweight and obesity increased). In other words, breastfed children for shorter durations were more likely to gain weight than breastfed infant for longer duration and it appears to be protective role against overweight and obesity in this selected sample of children. Similar result was obtained by Baker et al., (2014) who revealed that infants who are breastfed (≥20 weeks), gain less weight at 1 year than those who were formula fed or mixed-fed. Children who were breastfed (6 months or more) were less likely to be overweight and obese as compared to those who were never breastfed (17). Prolonged bottle-feeding was found to be
significantly associated with both
overweight and iron-deficiency in children 18 to 56 months of age (18).
A key finding of this study was the high occurrence of ID among overweight and obese children as compared to normal weight children. The present study showed a significant difference in ID variables (SI, Hb, TIBC) among overweight and obese
children as compared to healthy ones. The risk of having ID is 4.5 and 3.7 odds among overweight and obese children, respectively, then normal weight children (P-value = 0.01). This finding agrees with results of Cepeda et al., (2010) who revealed that the risk of iron deficiency in Mexican obese children is 2-4 times higher
than normal-weight children (4).
However, the occurrence of ID in the present study based on TIBC was higher than the prevalence of ID reported for obese and overweight Swiss children which was (20% and 12%, respectively) (19). The frequency of ID reported by the present and the two studies cited above is noticeably higher compared to the result reported from the USA, specifically, the prevalence of ID reported for obese children in the Third National Health and Nutrition Examination Survey (NHANES) which was 2.4% and 9.1%, respectively (20). The analysis of hematological iron markers used in this study revealed significant differences in SI, TIBC, and Hb among the 3 groups of BMI; all of which are markers used to measure the level of circulating iron. These results are in agreement with the results reported by Sharif et al., (2014) who found that mean SI levels were lower among obese children
in comparison with control group;
however, ferritin concentrations were similar in both groups (21). The mean
concentration of TIBC (ug/dl) was also significantly lower in normal body weight children than that in overweight and obese children. This is similar to results of Cepeda et al., (2010) and Nosrat et al., (2015) who found that the level of TIBC were higher in obese children than in normal body weight children (4, 22). By contrast, ferritin -based diagnosis of ID- is more likely to conclude that BMI is not associated with-or may even play a protective role in- the development of ID since there was no difference between groups in ferritin. In the present study, ferritin concentration was higher in overweight/obese children than those with normal body weight. The same result was reported by Hamza et al., (2013) who found that serum ferritin concentration was higher in overweight and obese Egyptian children, while other markers were indicative of a poorer iron status (23). The inflammatory state caused by obesity, may increase serum ferritin levels and higher levels of ferritin are a normal situation in obese people (21). Therefore, children with obesity-related ID may have normal or even elevated levels of serum ferritin;
specifically, compared with
non-overweight subjects. Obesity is associated with low-grade inflammation of White Adipose Tissue (WAT) due to chronic activation of the innate immune system
(24). Both WAT and infiltrated
macrophages can be a major source of inflammatory cytokines, such as tumors necrosis factor-α, which is an activator of ferritin transcription (25). Different factors have been proposed for the explanation of association between iron deficiency and obesity. These may include one or more of the following mechanisms. Firstly, the primary causes of ID include low intake of bioavailable iron; increased iron requirements as a result of rapid growth; excess blood loss caused by pathologic infections, such as hook worm and whipworm causing gastrointestinal blood loss (4), and impaired absorption of iron (26); secondly, inappropriate diet with
intake of iron deficient foods and genetic factors (27, 20); thirdly, inflammation status related to the increased fat mass that mediates the suboptimal iron levels and consequently increase the risk for ID and anaemia (5); and finally, the combination of nutritional and functional factors (5). Another explanation of the association between iron deficiency and obesity is the
role of hepcidin-mediated iron
sequestration in obesity-related ID (28). The results of the current study showed that calories intake and sugar are positively correlated with BMI. Many studies have examined the link between sugary drink consumption and weight and it has been continually found to be a contributing factor to become overweight
(29-30). Furthermore, the Scientific
Advisory Committee on Nutrition (31) reviewed randomized control trials, which indicated that consumption of sugars-sweetened beverages, as compared with
non-calorically sweetened beverages,
results in weight gain and an increase in BMI among children. Prospective cohort studies also generally confirmed the link between sugars-sweetened beverages and increased obesity (32). Another factor that contributes to childhood obesity is the consumption of empty calorie snack foods. Snack foods include foods such as chips, baked goods, and candy which provide high calories with few nutrients, including iron. While snacking has been shown to increase overall caloric intake, no studies have been able to find a link between snacking and overweight (29). The positive correlation detected in this study between the two major macronutrients (carbohydrates and protein) and BMI is similar to Grantham' et al., (2014) findings, who reported -in modern diet- carbohydrates are digested to satisfy body’s energetic needs while protein is converted and stored as fat. In addition,
carbohydrates are among the
macronutrients that provide energy and can thus contribute to excess energy intake
and subsequent weight gain (34).
Regarding the protein intake, a study by Scaglioni et al., (2000) revealed that preschool overweight children had a higher percentage intake of proteins at the age of one year than non-overweight children (35). In our study, meat intake was found to be significantly associated with BMI. This finding is in agreement with the previous findings which indicate that high intakes of both red and processed meat have been shown to be positively related to weight gain (36). A recent study by Wenpeng et al., (2016) showed that meat availability is most highly correlated with prevalence of obesity and overweight and BMI (37). In addition, other studies mentioned that meat when consumed at high level, may increase weight gain due to its high energy density and/or fat content (38-39). The significant difference (p<0.005) between the study groups in the percent of energy intake from SFAs (12.5% to 16.4%) to the total energy intake is quite comparable with that reported by Rosa et al., (2001) who concluded that SFAs provided (15.2%) of the energy intake of the diet (40). Similar findings were documented by Niinikoski et al., (1997) who found that in 2-year-old children the percent of energy intake from SFAs was about 14.5% (41). Furthermore, the percent could reach 15% in 2- to 14-year-old Greek children (42). However, other studies indicated that transition towards a lower fat intake in preschool children should not be advised since this may be accompanied by reductions in energy and nutrient intakes (43, 44). Our data showed positive and significant correlations between vitamin B6 intake and hemoglobin. These results are in agreement with Leklem et al., (1999) who found that vitamin B6 helps in the synthesis of hemoglobin, by acting as a coenzyme for the enzyme Aminolevulinic Acid (ALA) synthase which is involved in the synthesis of heme, an iron-containing component of hemoglobin (45). Moreover, we found a positive correlation between hemoglobin and some minerals such as
calcium, selenium and iron (45). In a previous study by Lind et al., (2004), a significant increase in Hb with increasing iron intake was reported, and the relation between dietary iron intake and Hb was linear (46). Miranda et al., (2014) found thatcombined calcium and iron is equally effective as single iron in reducing the prevalence of iron deficiency anemia in children (47).
Dalton et al., (1997) examined whether calcium of infant formula affects the healthy full-term infants after 4 to 9 months. They didn't find any differences between the experimental and control groups on Hb, SF, and TIBC (48). Lynch et al., (2000) reported that calcium has only a limited effect on iron absorption in a wide variety of foods and various concentrations of other inhibitors and enhancers (49). Absorption of iron is tightly regulated and affected by individual iron status more than dietary factors (50). In addition, calcium is an essential nutrient for normal growth and development, and requirements are higher during infancy and adolescence than in adulthood (51). A higher calcium intake may lead to the achievement of maximal bone mass (52-53). In the present study, obese children were found to consume more milk and calcium than did normal body weight children. This may help them in achieving a heavier weight and greater bone mass which may later protect them from diseases such as osteoporosis (53-54). The significant correlation detected in the present study between selenium and Hb is in agreement with a study by Herbert et
al., (1996) concluding that the
concentrations of reactive oxygen species (ROS) are kept extremely low due to the activity of anti-oxidative enzyme systems, including glutathione peroxidases (GPx) (55). This enzyme contains selenium as a potent cofactor; therefore, an adequate daily intake of selenium may protect against harmful effects of ROS (55). The present study results showed a significant association between vitamin E
and vitamin C and SI. Herbert et al., (1996) highlighted that, in addition to adequate amounts of the anti-oxidative components vitamin C (ascorbate) and vitamin E, it should be noted that ferric complexes, react very slowly with H2O2 compared to ferrous forms of iron. Reducing agents can thereby stimulate the Fenton reaction and this may occur with simultaneous overdosing with vitamin C and iron: (Fe (III) + vitamin C> Fe (II) + Semi dehydroascorbate). Hence, whereas vitamin C in reasonable doses acts as an antioxidant, the same vitamin in mega doses (>1000 mg/day) may act as a prooxidant, especially in subjects with Fe overload (55). Reduction of oxidative stress by vitamin E may result in a significant increase in hemoglobin (56). On another hand, deficiency of vitamin E, especially in the infant, will lead to red blood cell rupture, and the magnitude of the anemia appears related to the presence of associated factors such as the lipid composition of the RBC membrane and the nature of associated oxidant stresses (57).
Regarding the relationship between the intake of iron and vitamin B12 and TIBC, we found a significant association between those two nutrients and TIBC. These findings are in agreement with the recent findings which indicate that, a reduced rate of iron intake represents a more advanced stage of iron depletion, which is associated with higher TIBC (58). On the other hand, iron and vitamin B12 deficiency, either singly or in combination, could be presented with not only disordered hematopoiesis, but also can precede the appearance of hematological abnormalities (59). The study had several limitations. First, blood iron status can be influenced by a variety of factors, including the contents of the meal consumed prior to sampling; although, other confounders were likely present. Second, though a
significant association was detected
between obesity and ID, no causal relationship can be inferred because of the
merits of cross-sectional studies. Thus, longitudinal research is required in order to test the putative causal relationship between obesity and ID. Third, researchers in Jordan used to assess the dietary intake of Jordanians using an international food database (ESHA) that tracks the general market availability of different food types,
not the actual and bioavailable
consumption. There are no direct measures of actual human consumption that can account for food wastage and provide precise measures of food consumption nationally. These studies were generally limited in sample size. The sample in this study is not representative of the population as the children in this study were selected by convenience sampling from hospital, and three comprehensive health centers, and not from the general population, and we cannot generalize the results to the whole population. Therefore, a large scale study is warranted.
Conclusion
In conclusion, present study provided evidence supporting the presence of an association between obesity and ID. Weight gain measured by BMI is found to be a risk factor for developing ID. Different associations were found between
the intake of some micronutrients
(vitamins B6, C and E and calcium, iron, and selenium) and the measured ID blood biomarkers. Dietary assessment results revealed that the intake of saturated fat, sugar, and energy from saturated fat was significantly higher in overweight and obese children than that in normal children. While, the intake of folic acid and iron was higher in obese children as compared to normal body weight and
overweight children, the intake of
selenium was the lowest in overweight children as compared to the other two groups. TIBC is a promising candidate in detecting ID; although, the standardized assay system is still required. Overweight and obese individuals should undergo periodical screening for iron status, to
prevent reaching to latent ID or even early stage of IDA.
Conflict of interest
The authors report no conflict of interest.
References
1. Brotanek M, Jacqueline G, Michael W, Glenn F. Iron deficiency in early childhood in the United States: risk factors and racial/ethnic disparities. Pediatrics 2007; 120(3): 568-75.
2. CDC. Centers for Disease Control and Prevention. Recommendations to prevent and control iron deficiency in the United States. Morb Mortal Wkly Rep 2001; 47(RR-3):1-36.
3. WHO/UNICEF/UNU. Iron deficiency anaemia: assessment, prevention and control. A guide for programme managers. Geneva: World Health Organization; 2001 4. Cepeda A, Aeberli I, Zimmermann MB. Does obesity Increase risk for Iron deficiency? a review of the literature and the potential mechanisms. Int J Vitam Nutr Res 2010; 80 : 263–70.
5. Fallah R, Tirandazi B, Akhavan Karbasi S, Golestan M. Iron deficiency and iron deficiency anemia in children with febrile seizure. JPHO 2013; 3(1), 200-4.
6. WHO | Fact Sheets. Noncommunicable Diseases Fact sheets: noncommunicable diseases index. Congenital anomalies. 2010.
7. WHO and United Nations Children's Fund. Focusing on anemia towards an integrated approach for effective anemia control. PAHO SCI P 2014.
8. Neumark S, Story M, French S. Individual and environmental influences on eating behaviors. J Am Diet Assoc 2010; 102(3): S40–51.
9. Eftekhari M, Mozaffari H, Shidfar F. The relationship between BMI and iron status in iron-deficient adolescent Iranian
girls. Public Health Nut 2009;
12(12):2377- 81.
10. Government of Jordan. Population and Family Health Survey (JPFHS) 2012. Amman: Department of Statistics; 2012.
11. Lee R, Nieman D. Nutritional Assessment. 6th Ed. New York: MC Graw; 2013.
12. WHO child growth standards:
length/height-for age, weight for age, weight for length, weight for height and body mass index for age: methods and development.
13. Larner NB, Sills R, Kliegman RM, Stanton BF, Geme JW, Schor NF, Behrman RE. Nelson text book of pediatrics. 19th ED. Philadelphia: Elsevier Saunders; 2011.
14. Pellet P, Shadarevian S. The food composition tables for use in the Middle East. 3rd ED. Lebanon, Beirut: Am University of Beirut; 2013.
15. Falzacappa M, Spasic M, Kessler R, Stolte J, Hentze M, Muckenthaler M.
STAT3 mediates hepatic hepcidin
expression and its inflammatory
stimulation. Blood 2007; 109(1), 353– 8. 16. Baker JL, Michaelsen KF, Rasmussen KM, Sorensen TIA. Maternal prep regnant
body mass index, duration of
breastfeeding, and timing of
complementary food introduction are associated with infant weight gain. Am J Clin Nutr 2004; 80(6): 1579-88.
17. Jane A, Scott SY, Lynne C. The relationship between breastfeeding and weight status in a national sample of Australian children and adolescents. BMC Public Health 2012; 12:107.
18. Bonuck KA, Kahn R, Prolonged bottle use and its association with iron deficiency anemia and overweight: a preliminary study. Clin Pediatr 2012; 41(8):603–7. 19. Pinhas-Hamiel O, Newfield RS, Koren I, Agmon A, Lilos P, Phillip M. Greater
prevalence of iron deficiency in
overweight and obese children and adolescents. Int J Obes Relat Metab Disord 2003; 27(3): 416–8.
20. Nead KG, Halterman JS, Kaczorowski JM, Auinger P, Weitzman M. Overweight children and adolescents: a risk group for iron deficiency. Pediatrics 2004; 114(1): 104–8.
21. Sharif MR, Madani M, Tabatabaie F. Comparative Evaluation of iron deficiency among Obese and Non-Obese Children. Ira J of Ped Hem Onc 2014; 4(4):160–6. 22. Nosrat G, Sepideh B, Mohsen J. Are obese children at increased risk of micronutrient deficiency? Pak Peds J 2015; 9(1): 35-8.
23. Hamza RT, Hamed AI, Kharshoum RR. Iron homeostasis and serum hepcidin-levels in obese children and adolescents: relation to body mass index. Horm Res Paediatr 2013;80(1):11-7.
24. Park CH, Valore EV, Waring A, Ganz
T. a urinary antimicrobial peptide
synthesized in the liver. J Biol Chem 2001; 276(11):7806 –10.
25. Laftah A, Ramesh B, Simpson R. Effect of hepcidin on intestinal iron absorption in mice. Blood 2004; 103(10), 3940 – 4.
26. Zimmermann MB, Aeberli I, Hurrell RF. Nutritional iron deficiency circulating hepcidin concentrations and lower iron status but have dietary iron intakes and bioavailability comparable with normal weight children. Lancet 2007; 370:115-20. 27. G, Halterman J, Kaczorowski JM, Auginar P, Weitzman M. Overweight children and adolescents: a risk group for iron deficiency anemia. Pediatrics 2004; 114(1): 104-8.
28. Aeberli I, Hurrell RF, Zimmermann MB. Overweight children have higher circulating hepcidin concentrations and lower iron status but have dietary iron intakes and bioavailability comparable with normal weight children. Int J Obes 2009; 33(10): 1111–17.
29. Anderson PM, Butcher KE. Childhood obesity: Trends and potential causes. Future Child 2006; 16(1):19–45.
30. Malik VS, Willett WC, Hunond FB. Sugar-sweetened beverages and BMI in children and adolescents: re analyses of a meta-analysis. Am J Clin Nut 2009; 89(1):438-39.
31. SACN, Scientific Advisory
Committee on Nutrition. Draft
carbohydrates and health Report 2014.
32. NHS Choices. Obesity 2014.
33.Grantham JP, Staub K, Rühli FJ, Henneberg M. Modern diet and metabolic variance - a recipe for disaster. Nutr J 2014;13:15.
34. Van Dam RM, Seidell JC.
Carbohydrate intake and obesity. Eur J Clin Nut 2007; 61 ( 1):S75-99
35.Scaglioni S, Agostoni C, Notaris RD, Radaelli G, Radice N, Valenti M, et al. Early macronutrient intake and overweight at five years of age. Int J Obes Relat Metab Disord 2000; 24:777–81.
36. Wagemakers JMF, Prynne CJ, Stephen AM, Wadsworth MEJ. Consumption of red or processed meat does not predict risk factors for coronary heart disease, results from a cohort of British adults in 1989 and 1999. Eur J Clin Nutr 2009; 63(3):303–11. 37. You W, Henneberg M. Meat consumption providing a surplus energy in
modern diet contributes to obesity
prevalence: an ecological analysis. BMC Nutrition 2016; 2:22.
38. Rastrollo M B, Sa´nchez-Villegas A, Go´mez-Gracia E. Predictors of weight gain in a Mediterranean cohort Study. Am J Clin Nutr 2006 ; 83(2):362–70.
39. Vergnaud A, Anne CV, Teresa N, Dora R, Traci M, Anne MM, et al. Meat consumption and prospective weight change in participants of the EPIC-PANACEA study. Am J Clin Nutr 2010; 92(2):398–407.
40. Rosa M, Ortega V, Maria E Q, Maria JG, Pedro AM, Maria LS. The Influence of Saturated Fatty Acid Consumption on Energy and Nutrient Intake, Blood Lipid Levels and Iron. Nutr Res 2001; 18(4):671-82.
41.Niinikoski H, Jula A, Viikari J, Ronnemaa T, Heino P, Lagstrom H. Blood pressure is lower in children and adolescents with a low-saturated-fat diet
since infancy. Hypertension
2009;53(6):918–24.
42. Roma-Giannikou E, Adamidis D, Gianniou M, Nikolara R, Matsaniotis N. Nutritional survey in Greek children:
nutrient intake. Eur J Clin Nutr 1997; 51(5):273-85.
43. Ortega RM. The benefits and risks of following dietary guidelines aimed at
decreasing cardiovascular risk from
childhood. Ann Esp Pediatr 1999;
50(6):576-80.
44.Akerblom HK, Chandra RK, Franklin FA, Giovannini M, Grobbee DE, Innis SM, et al. Conclusions, guidelines and recommendations from the IUNS/WHO Workshop: Nutrition in the pediatric age group and later cardiovascular disease. J Am Coll Nutr 1992; 11(l):1S–2S.
45. Leklem JE, Shils M, Olson JA, Shike M, Ross AC. Vitamin B-6 in Modern Nutrition in Health and Disease. 10th ED. Philadelphia: Williams and Wilkins 2006; 452-69.
46. Lind T, Rnolle H, Nnerdal B, Hans S, Domello F, Lars-Åke P. Dietary Iron Intake Is Positively Associated with Hemoglobin Concentration During Infancy But Not During The Second Year Of Life. ASNS 2004; 134(5): 1064-70.
47. Melissa M, Olivares M, Brito A, Fernando D. Reducing iron deficiency anemia in Bolivian children: Calcium and
iron combined versus iron
supplementation alone. Nutrition 2014; 30(8):771–5.
48. Dalton MA, Connor O, Olmstead ME. Calcium and phosphorus supplementation of iron-fortified infant formula: no effect on iron status of healthy full-term infants. Am J Clin Nutr 1997;65(4):921-6.
49. Lynch SR, Maira AG, Bes-Rastrollo, A, Enrique GJ, Alfredo M. The Effect of Calcium on Iron Absorption. Nutr Res Rev 2000; 13:141-58.
50. Hallberg L. Bioavailability of dietary iron in man. Annu Rev Nutr 1981; 1;123-47.
51. Aline LB, Mauro A, Czepielewsk I. The importance for growth of dietary intake of calcium and vitamin D. J Pediatr 2008;84(5):386-94
52. Pettifor JM, Moodley GP.
Appendicular bone mass in children with a high prevalence of low dietary calcium
intakes. J Bone Miner Res
1997;12(11):1824-32.
53. Saggese G, Baroncelli G, Kunze D, Ufshitz I. Nutritional aspects of calcium
and vitamin D from infancy to
adolescence. Ann Super Sanita
1995;31(4):461-79.
54. Renner E. Dairy calcium, bone
metabolism, and prevention of
osteoporosis. J Dairy Sci 1994;
77(12):3498-505.
55. Herbert VS, Shaw E, Jayatilleke M. Vitamin C-driven free radical generation from iron. J Nutr 1996;126(4):1213S-20S. 56. Nemeth I, Turi S, Haszon I, Bereczki C. Vitamin E alleviates the oxidative stress of erythropoietin in uremic children. Pediatr Nephrol 2000;14(1):13-7.
57. Oski FA. Anemia in Infancy: Iron Deficiency and Vitamin E Deficiency Pediatrics in Review. AAP 1980;1(8):247-53.
58. NIH, Iron Dietary Supplement Fact Sheet. 2016.
59. Rachel M, Bernard D. Iron vitamin b12 and Folate. Medicine 2017;45(4): 198-203.