IJHR
Open Access
Abstract
Background and Objectives: Patient satisfaction is a key feature of quality improvement in modern health care systems. The focus of patient satisfaction studies has been on inpatient satisfaction measurement. As such, valid and reliable instruments for assessment of outpatient satisfaction are lacking in the field. This study aimed to develop and validate a brief scale to facilitate assessing outpatient satisfaction.
Methods: Based on the existing literature and patient interviews, an initial pool of 20 items was generated. Item analysis and principal components analysis were carried out to evaluate the psychometric quality of items. Internal consistency of the instrument was evaluated by calculating Cronbach’s alpha for the whole scale and subscales. Findings: Results supported the appropriateness of all items. Moreover, principal components analysis us-ing Varimax rotation yielded a four-factor solution. Reliability coefficients of the subscales were within the acceptable range. The existing brief 20-item scale was developed with four subscales of staff, physician care, clinical atmosphere, and overall satisfaction.
Conclusions: Therefore, this brief scale may be served as a valid and reliable instrument in clinics, hos-pitals, and research settings.
Keywords: Psychometrics; Patient satisfaction; Outpatients; Reliability and validity; Factor analysis; Quality improvement; Scale development
Background and Objectives
Assessment of patient satisfaction is of absolute im-portance in order to improve the quality of healthcare services [1, 2]. Patient satisfaction aspects differ from country to country, and its content also depends on many patient characteristics such as age, gender, edu-cational level and socio-economic status [3]. Further-more, the evaluation of patient satisfaction includes methodological difficulties [4].
The research literature on patient satisfaction is di-verse. As Hall and Dornan [5] noted in their review
of the satisfaction research literature, the aspects of the medical setting chosen for study vary in a way that some aspects (e.g. humaneness of health pro-fessionals) are investigated extensively while others (e.g. outcomes) are assessed to a relatively lesser degree. Satisfaction is indeed a multi-factorial con-cept. Patients make cognitive and emotional evalu-ations about the process of care as well as the out-come of their treatment.
It has been reported that patient satisfaction is influenced by communications, cost, continuity of services and providers, physical environment of the hospital, humanity, information, time spent on patient, technical quality, official procedures, doctor’s gender, and nursing care [6-9]. It was also reported that wait-ing for long times, havwait-ing no alternative choices, and possessing insufficient information are the causes of
Developing a Psychometric Scale for Brief
Evaluation of Outpatient Satisfaction
Maryam Attari
1, Hadi Bahrami-Ehsan
2, Mohammad Attari
2*1 Faculty of Management, University of Tehran, Tehran, Iran 2 Department of Psychology, University of Tehran, Tehran, Iran
dissatisfaction in outpatient clinics [10-12]; however, assessment of all these factors is psychometrically difficult and may result in long questionnaires. To be more realistic, it is a fact that satisfaction with service quality is based on multiple dimensions. Yet, there is no broad consensus on the nature or even content of the dimensions. Thus, evaluation of these domains is considered to be a highly complex process [13] as stated before.
Another review [14] reported that the majority of pa-tient satisfaction studies identified in the international literature used survey instruments have been spe-cifically designed for the study in question. This is of concern with regard to establishing reliability and va-lidity of instruments. Achieving comparability across various settings is another problem of this manner of collecting data on patient satisfaction. Moreover, most of the utilized measurement approaches focused on specific healthcare systems, and few focused on outpatient clinics. Using inpatient satisfaction instru-ments for outpatient clinics raises the issue of content validity, and is methodologically questionable. More-over, using long surveys in outpatient clinics is practi-cally difficult as these patients may stay in the clinic for only few minutes.
Much of the activity in patient satisfaction research has focused on the experience of inpatient care; however, outpatient services account for many more patient-professional encounters than other services. Thus there is a growing need to develop systems and instruments to measure outpatient satisfaction. Un-doubtedly, utilizing inpatient satisfaction surveys for measurement of outpatient satisfaction runs a high risk of yielding erroneous results [15]. Around the world, hospital managers make an effort to establish an integrated method of patient satisfaction measure-ment in order for quality-improvemeasure-ment purposes [16]. Additionally, adopting non-validated approaches of measurement is psychometrically problematic [17]. This may also lead to inappropriate data and conse-quently troublesome decisions in managerial levels. Measures of patient satisfaction should adhere to the basic principles of psychometric measurement [18]. Analysis of 195 studies [19] of patient satisfaction yielded that authors demonstrated a poor understand-ing of the importance of core measurement properties required if a measure is to assess satisfaction with confidence.
Psychometrically suitable instruments are lacking in order for accurate evaluation of outpatient satis-faction. Research literature on patient satisfaction and especially outpatient satisfaction indicates that there is a need for a very brief scale to measure
out-patient satisfaction. The primary aim of the present study was to develop and validate a brief self-report multi-dimensional scale to measure outpatient satis-faction in a valid and reliable manner with satisfac-tory factor structure.
Methods
Item generationConsidering existing literature on outpatient satisfac-tion in different countries, an initial item pool of 50 items was generated. Two hospital managers, two psy-chologists, and one physician examined the content validity of the items. All of the five raters were asked to rate the items in a 7-point Likert scale. Higher scores indicated the higher quality of the items, and lower scores suggested poor items in terms of content valid-ity. Items with scores lower than 25 were discarded in this step. Then the authors examined remaining items, and chose 20 items to form the final item pool. Items consisted of five 4-item parts: admission, personnel, clinic atmosphere, physician care, and overall satis-faction. The response option for respondents was pro-vided in a 6-point Likert-type scale.
Item selection
As suggested by Nunnaly and Bernstein [20], a broad item analysis was conducted prior to Principal Compo-nents Analysis (PCA). In this step, the items’ exclusion criteria were set: (a) missing more than 10% of data, and (b) having inappropriate indices of skewness and kurtosis.
Data transformation
Questionnaires with more than five missing values were excluded from the statistical analysis. Each item was scored from 5 (complete satisfaction) to 0 (complete dissatisfaction). No reverse scoring was re-quired. Total patient satisfaction score was calculated by summing all the items’ scores.
Factor structure
and loadings under 0.4 were suppressed.
Reliability
Cronbach’s alpha coefficient was calculated to assess the internal consistency of each subscale and total scale as a measure of reliability.
Procedure
A total number of 246 participants were given a ques-tionnaire consisting of the above-mentioned 20-item scale (Brief Outpatient Satisfaction Scale, BOSS) and demographic details. Demographics were age, gender, marital status, educational level, Socio-Economic Sta-tus (SES), reason of admission, and admission time. The verbal consent of all participants was obtained before administering the questionnaires in the clinic. Moreover, all respondents were assured of the confi-dentiality of their responses.
Statistical analysis
Data entry and analysis were performed in a blinded manner by personnel who were not involved in the pro-cess of data collection. Statistical analysis was per-formed using SPSS 22. Finally, one-way Analysis of Variance (ANOVA) was used to evaluate total satisfac-tion among different groups derived from the demo-graphic details.
Results
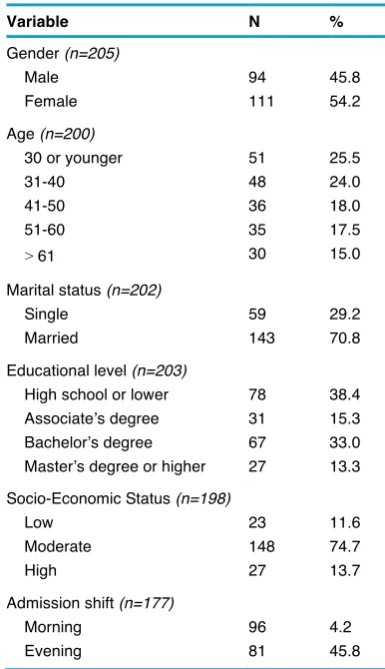
Initially, 246 questionnaires were obtained; however, after meeting the exclusion criteria for participants, 208 valid questionnaires were included for statistical analysis. Demographic characteristics of the outpa-tients are summarized in Table 1.
Item analysis
Item analysis provided all items with appropriate char-acteristics. All items’ indices of skewness and kurtosis were within acceptable range; therefore, no item was discarded in this step.
Factor structure
PCA was performed on the response set of 20 items. The KMO measure of sampling adequacy was 0.911. Since the minimum value of this measure for
adequa-cy of data matrix for factorability is 0.6 [21], it could be concluded that data matrix had the required as-sumptions for factor analytic purposes. Bartlett’s test was also significant. These tests suggest the factor-ability of the instrument. Four components had eigen-values greater than one. These components were la-beled: staff, overall satisfaction, physician care, and clinic atmosphere, which components accounted for 39.5%, 10.8%, 7.7%, and 5.1% of the total variance, respectively. Thus, 63.1% of the total variance was explained via these four components. Within the re-sults of 20 items, only three items had cross-loadings. Loadings of the items on the components are pre-sented in Table 2.
Reliability
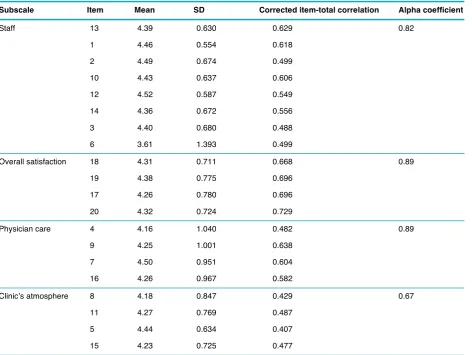
The alpha coefficient of the scale was 0.91. Descrip-tive data, reliability coefficients, and item-subscale co-efficients of the subscales are presented in Table 3.
Table 1 demographic characteristic of the respondents
Variable N %
Gender (n=205) Male Female 94 111 45.8 54.2 Age (n=200)
30 or younger 31-40 41-50 51-60
> 61
51 48 36 35 30 25.5 24.0 18.0 17.5 15.0 Marital status (n=202)
Single Married 59 143 29.2 70.8 Educational level (n=203)
High school or lower Associate’s degree Bachelor’s degree Master’s degree or higher
78 31 67 27 38.4 15.3 33.0 13.3 Socio-Economic Status (n=198)
Low Moderate High 23 148 27 11.6 74.7 13.7 Admission shift (n=177)
Further analysis
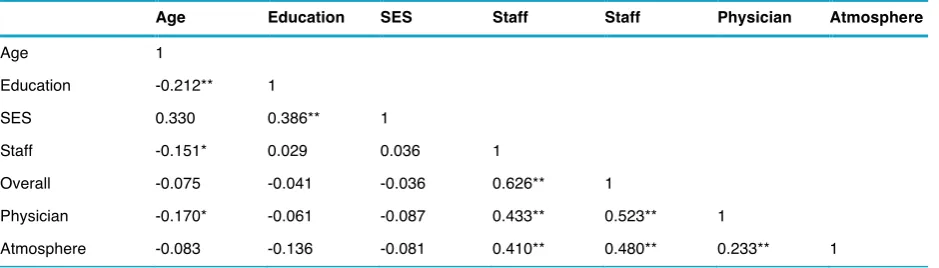
Pearson’s correlation coefficients between some de -mographic characteristics and four subscales of the instrument are present in Table 4. One-way ANOVA detected no significant difference in satisfaction of
pa-tients in gender, marital status, education, and socio-economic status (P > 0.05); however, those patients who were admitted in the evening were significantly more satisfied (F = 5.89; P < 0.05).
Table 2 Loadings of items on their related subscales
Staff (8 items) Overall (4 items) Physician (4 items) Atmosphere (4items)
Item Loading Item Loading Item Loading Item Loading
13 0.745 18 0.794 4 0.848 8 0.750
1 0.733
2 0.709 19 0.765 9 0.838 11 0.532
10 0.655
12 0.643 17 0.735 7 0.818 15 0.459
14 0.604
3 0.574 20 0.650 16 0.807 5 0.419
6 0.540
Table 3 Descriptive data, item-total correlation coefficients, and internal consistency of subscales
Subscale Item Mean SD Corrected item-total correlation Alpha coefficient
Staff 13 4.39 0.630 0.629 0.82
1 4.46 0.554 0.618
2 4.49 0.674 0.499
10 4.43 0.637 0.606
12 4.52 0.587 0.549
14 4.36 0.672 0.556
3 4.40 0.680 0.488
6 3.61 1.393 0.499
Overall satisfaction 18 4.31 0.711 0.668 0.89
19 4.38 0.775 0.696
17 4.26 0.780 0.696
20 4.32 0.724 0.729
Physician care 4 4.16 1.040 0.482 0.89
9 4.25 1.001 0.638
7 4.50 0.951 0.604
16 4.26 0.967 0.582
Clinic’s atmosphere 8 4.18 0.847 0.429 0.67
11 4.27 0.769 0.487
5 4.44 0.634 0.407
Discussion
This study aimed to develop and undertake prelimi-nary psychometric evaluation of a new measure of outpatient satisfaction. A 20-item scale comprising of four subscales was developed with good internal consistency and adequate indices of validity. Assess-ing outpatient satisfaction relatAssess-ing to staff, physician care, overall satisfaction, and clinic atmosphere sub-scales will allow quality-improvement executives to set a plan in order to improve the quality of services in an operational manner.
The findings of this study are consistent with a study based on grounded theory (GT) [22], which findings identified service quality dimensions through open coding, axial coding, and selective coding. The analysis was done for the assessment of overall sat-isfaction, and four dimensions of doctors, quality of care, nursing care, and operative quality of care were identified. While the current results do not precisely replicate those findings, they are quite consistent in terms of content validity.
The authors expected a five-factor solution from the PCA; however, a four-factor solution was obtained. Three emerged factors were consistently matched with the initial taxonomy of expected subscales. Items pertaining to admission and personnel were an-ticipated to form two distinct factors though they were loaded on a single factor, which was then labeled as “staff”. This subscale appears to measure satisfaction with all staff members. Interestingly, in some inpatient satisfaction scales [23], satisfaction with different staff members is clearly distinct. It may be explained by the fact that interaction of a typical outpatient with various nurses and admission personnel in outpatient clinics is limited; however, the distinction of interac-tions of a typical inpatient with different staff
mem-bers in his/her stay is clearer.
The items in satisfaction with physician care sub-scale were especially designed to cover potential Doctor-Patient Relationship (DPR) components. It has been suggested that an ideal DPR has six com-ponents, namely voluntary choice, doctor’s compe -tence, good communication, empathy by the doctor, continuity, and no conflict of interest [24]. It has been reported that poor DPR may simply result in lowered satisfaction of patients [25]. As the current scale was meant to be brief, the most crucial aspects of DPR were incorporated into the “physician care” subscale. As stated before, this subscale showed high level of internal consistency and may be considered a point of strength in the developed instrument.
Furthermore, the alpha coefficient was calculated to assess the internal consistency of the scale though, test-retest approach was not utilized due to some ir-regularities reported in previous studies [26]. Another reason for not using test-retest approach was inac-cessibility of the patients after discharge. The total Cronbach’s alpha was high, and supported the reli -ability of the developed instrument. Internal consis-tency of the four subscales was also satisfactory.
Demographic data provided no evidence for signifi-cant difference of satisfaction among gender, marital status, educational level, and socio-economic status. Moreover, there was a significant difference between the morning and evening admissions, suggesting that those referring in the evening admission were more satisfied with services. This may have multiple rea-sons. First, it might be because of different shifts of staff and their behavior. Second, patients who refer in the morning shift are either unemployed or have left their job for several hours for treatment. There-fore, they might hold higher expectations of clinical services. Though, replication of this finding in various
Table 4 Correlation coefficients between demographic variables and subscales
Age Education SES Staff Staff Physician Atmosphere
Age 1
Education -0.212** 1
SES 0.330 0.386** 1
Staff -0.151* 0.029 0.036 1
Overall -0.075 -0.041 -0.036 0.626** 1
Physician -0.170* -0.061 -0.087 0.433** 0.523** 1
Atmosphere -0.083 -0.136 -0.081 0.410** 0.480** 0.233** 1
settings may bring to light more in this respect. Given the exploratory nature of this study, further validation of this scale is required and strongly rec-ommended. Since this scale has been developed upon data from one hospital, assessment of its psy-chometric properties in other settings may facilitate its application. It may also result in somewhat differ-ent factor structure because of the nature of items in the first subscale.
Few limitations of the current study are worth noting. First, although an interpretable factor structure was found, it is unlikely that this scale captures all relevant domains of outpatient satisfaction. For instance, this scale does not measure satisfaction with labs, radiol-ogy staff, and pharmacy [27]. The authors believe that satisfaction with those sections should be assessed in a different manner with specifically designed instru-ments as they may not be required for all outpatients. Second, the used sampling method was convenience sampling. Utilizing probability sampling strategies with larger samples can be of great help to assess external validity of the instrument in future research [28].
Conclusions
While the development of the brief outpatient satisfac-tion scale (BOSS) is at its preliminary stage, with con-tinued research and development, this scale may be utilized as a valid and reliable instrument in outpatient clinics, hospitals, and research settings.
Abbreviations
(PCA): principal components analysis; (KMO): Kaiser-Meyer-Olkin; (SES): socio-economic status; (BOSS): brief outpatient satisfaction scale; (ANOVA): analysis of variance; (DPR): doctor-patient relationship
Competing Interests
The authors declare no competing interests.
Authors’ Contributions
MA designed the study, conceptualized the instrument, and collected the data. HB provided methodological suggestions and statistical guidance. MA was involved in interpretation of results and drafting the manuscript. All authors approved the final manuscript.
References
1. Jabbari A, Khorasani E, Jafarian Jazi M, Mofid M, Mardani R. The profile of patients’ complaints in a regional hospital.
Int J Health Policy Manag 2014, 2(3):131-5.
2. Chahal H, Sharma R, Gupta M. Patient satisfaction in pub-lic outpatient health care services. J Health Manage 2004, 6(1):23-45.
3. Vuori H. Patient satisfaction--an attribute or indicator of the quality of care? QRB Qual Rev Bull 1987, 13(3):106-08. 4. Avis M, Bond M, Arthur A. Questioning patient satisfaction:
an empirical investigation in two outpatient clinics. Soc Sci Med 1997, 44(1):85-92.
5. Hall JA, Dornan MC. What patients like about their medical care and how often they are asked: a meta-analysis of the satisfaction literature. Soc Sci Med 1988, 27(9):935-9. 6. Andrzejewski N, Lagua RT. Use of a customer satisfaction
survey by health care regulators: a tool for total quality man-agement. Public Health Rep 1997, 112(3):206-10.
7. McKinley RK, Manku-Scott T, Hastings AM, French DP, Baker R. Reliability and validity of a new measure of patient satisfaction with out of hours primary medical care in the United Kingdom: development of a patient questionnaire. BMJ 1997, 314(7075):193-8.
8. Delgado A, Lopez-Fernandez LA, Luna JD. Influence of the doctor’s gender in the satisfaction of the users. Med Care 1993, 31(9):795-800.
9. Jones RB, Carnon AG, Wylie H, Hedley AJ. How do we measure consumer opinions of outpatient clinics? Public Health 1993, 107(4):235-41.
10. Dufrene RL. An evaluation of a patient satisfaction survey: validity and reliability. Eval Program Plann 2000, 23(3):293-300.
11. Atari M, Atari M. Brief Emergency Department Patient Sat-isfaction Scale (BEPSS); development of a new practical instrument. Emergency 2015, 3(3):103-8.
12. Kurata JH, Nogawa AN, Phillips DM, Hoffman S, Werblun MN. Patient and provider satisfaction with medical care. J Fam Pract 1992, 35(2):176-9.
13. Carman JM. Consumer Perceptions Of Service Quality: An Assessment Of T. J Retailing 1990, 66(1):33.
14. Crow R, Gage H, Hampson S, Hart J, Kimber A, Storey L, Thomas H. The measurement of satisfaction with health-care: implications for practice from a systematic review of the literature. Health Technol Assess 2002, 6(32):1-244. 15. Atari M, Akbari Zardkhaneh S, Atari M, Naderi-far N.
De-velopment and validation of the preliminary version of Brief Inpatient Satisfaction Scale (BISS). Int J Hosp Res 2014, 3(1):49-54.
16. Haj-Ali W, Bou Karroum L, Natafgi N, Kassak K. Exploring the relationship between accreditation and patient satisfac-tion - the case of selected Lebanese hospitals. Int J Health Policy Manag 2014, 3(6):341-6.
17. DeVellis R. Scale development: Theory and applications. Thousand Oaks: Sage publications; 2012.
18. PaulaRoberts. Testing user satisfaction tools. Nurs Res 1999, 6(3):67-76.
19. Sitzia J. How valid and reliable are patient satisfaction data? An analysis of 195 studies. Int J Qual Health Care 1999, 11(4):319-28.
McGraw Hill; 1994.
21. Tabachnick BG, Fidell LS. Using multivariate statistics. New York: Allyn and Bacon; 2007.
22. D’Souza SC, Sequeira A. Measuring the customer-per -ceived service quality in health care organization: A case study. J Health Manag 2012, 14(1):27-41.
23. Labarere J, Francois P, Auquier P, Robert C, Fourny M. De-velopment of a French inpatient satisfaction questionnaire. Int J Qual Health Care 2001, 13(2):99-108.
24. Emanuel EJ, Dubler NN. Preserving the physician-patient relationship in the era of managed care. JAMA 1995, 273(4):323-9.
25. Shrivastava SR, Shrivastava PS, Ramasamy J. Explor-ing the dimensions of doctor-patient relationship in clini-cal practice in hospital settings. Int J Health Policy Manag 2014, 2(4):159-60.
26. Rubin HR. Patient evaluations of hospital care. A review of the literature. Med Care 1990, 28(9 Suppl):S3-9.
27. Horvat N, Kos M. Development and initial validation of a pa-tient satisfaction with pharmacy performance questionnaire (PSPP-Q). Eval Health Prof 2010, 33(2):197-215.
28. Green LW, Glasgow RE. Evaluating the relevance, general-ization, and applicability of research: issues in external vali-dation and translation methodology. Eval Health Prof 2006, 29(1):126-53.
Please cite this article as: