Iranian Chemical Society
Anal. Bioanal. Chem. Res., Vol. 2, No. 2, 99-112, December 2015.
Simultaneous RP-HPLC and UV Spectroscopic Method Development and
Validation for Estimation of Ibandronate Sodium in Bulk and Pharmaceutical
Dosage Form
P. Bose
a,*, S. Dey
a, S. Basak
a, S. Shah
band A. De
aa
Dr. B.C. Roy College of Pharmacy and Allied Health Sciences, Bidhan Nagar, Durgapur-713206, West Bengal, India
bSigma Institute of Pharmacy, Bakrol, Vadodara 390019, Gujarat, India
(Received 22 April 2015, Accepted 24 August 2015)
The present study describes a simple, accurate, precise and cost effective UV-Vis Spectroscopic and RP-HPLC method for the estimation of Ibandronate sodium (IBN). The determination of Ibandronate sodium (IBN) was performed by both UV and RP-HPLC method using 215 nm as the determination wavelength. The drug was dissolved in NaOH solution (0.1N NaOH) for estimation in UV and in distilled water for the estimation in RP-HPLC using mobile phase 0.01 M Sodium dihydrogen phosphate (NaH2PO4): Acetonitrile
(80:20), pH being adjusted to 3.3 with 10% ortho-phosphoric acid. A linear response was observed in the range of 10-50 μg ml-1 (R2 = 0.9981) for UV-Spectroscopy, whereas for RP-HPLC the linear response was observed in the range of 20-70 μg ml-1 (R2 = 0.9965). The limits of quantitation (LOQ) were estimated as 0.1 μg ml-1 and 0.05 μg ml-1, respectively for UV and RP-HPLC respectively. The recoveries of IBN from the marketed formulation were found to be within 100 ± 2% by both the methods. These methods were then effectively applied for the estimation of Boniva (tablet) and the results were obtained according to nominal content. The statistical analysis revealed that there is no significant difference (p > 0.05) between UV and HPLC methods regarding validation parameters and assay content.
Keywords: Ibandronate sodium (IBN), UV-Vis spectroscopy, RP-HPLC, Calibration curve, LOD
INTRODUCTION
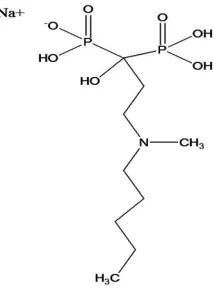
Ibandronate sodium [(1-hydroxy-3-(methyl pentyl
amino) propylidene bisphosphonic acid monosodium monohydrate)] is the sodium salt of ibandronic acid, a synthetic nitrogen-containing bisphosphonate drug. This new third generation bisphosphonate is used to treat patients with bone disease like Paget’s disease, malignant hypercalcemia and postmenopausal osteoporosis [1,2]. For quantification of impurities and assay of ibandronate sodium, a few analytical methods have been reported so far [3-5]. For example, indirect fluorescence detection was used in a high performance ion exchange chromatographic method; which proceeded via formation of a non-
*Corresponding author. E-mail: [email protected]
fluorescent Al3+-ibandronate complex after post-column addition of fluorescent Al3+-morin reagent. In another report, Ibandronate was determined by high performance ion exchange chromatography with UV detection at 240 nm after complex formation with Cu2+ ion [4]. Furthermore, Ibandronate and related impurities (phosphate, phosphite) were determined by capillary zone electrophoretic method within the direct detection at 254 nm [5], The limit of detection (LOD) values reported for phosphate, phosphite and ibandronate were 5 μg ml-1, 3 μg ml-1 and 176 μg ml-1, linearity ranges were 92-460 μg ml-1, 24-384 μg ml-1 and
352-1760 μg ml-1 [6]. Stability indicating ion
[8] and HPLC with anion column [9]. However, all these methods are costly and need sample resource to determine a single drug like Ibandronate. In addition, no such method is available with HPLC using UV detector which would have been more cost, resource effective and simpler to operate. Hence, the aim of this study was to develop a simple,
sensitive, and precise method by both UV-Vis
spectrophotometry and HPLC-UV for the first time to estimate Ibandronate sodium in tablet dosage form.
MATERIAL AND METHODS
Reagents and Chemicals
Ibandronate sodium (IBN) (Fig. 1) was obtained from Natco Pharmaceuticals, Hyderabad. Solution of NaOH (0.1 N NaOH, Analytical Grade) was used for UV method development and validation, whereas sodium dihydrogen phosphate (NaH2PO4) made phosphate buffer has been used
for HPLC. All Analytical Grade (AR) solvents were purchased from Merck (Mumbai, India) while HPLC grade water and acetonitrile were procured from Sigma Aldrich (Aldrich, USA).
Instrumentation
The instruments used for the present study were UV-Vis double beam spectrophotometer (model Shimadzu, Kyoto, Japan 1800) with 1cm matched pair quartz cell. The data acquisition was made with UV-Prove Version 2.3. HPLC (Waters, USA) system was composed of a 515 HPLC Pump solvent delivery module, having manual rheodyne injector with a 20-µl fixed loop and having a Waters 2489 UV-Vis detector. The separation has been done by using a waters Nova-Pak® C8G column (Column Length: 150 mm × 3.9 mm i.d.; 4 µm; particle size) at an ambient temperature. The data acquisition was made with Empower 2 Software Build 2154® (Waters Corporation).
Methods
Preparation of Stock and Working Standard Solution of Ibandronate Sodium (IBN). Stock solution (100 μg ml-1) of the drug was prepared by sonicating the drug with the suitable solvent (0.1 N NaOH for UV and H2O for HPLC). A working concentration of 50 µg ml-1 was
prepared by appropriate dilution of the stock solution.
Fig. 1. Chemical structure of ibandronate sodium.
High Performance Liquid Chromatography (HPLC). High-Performance Liquid Chromatography (Isocratic, Waters, USA) system was composed of a pump (model no 515), solvent delivery module having manual rheodyne injector with a 20-µl fixed loop and having a UV-Vis detector (model no 2489). Analytes were separated by using Waters Nova-Pak C8 Column (50 mm × 3.9 mm, particle size 4 µm) at an ambient temperature. The data acquisition was made with Software (M-power, Waters, USA). The mobile phase consisted of 0.01M NaH2PO4: Acetonitrile
(80:20, v/v); pH was adjusted to 3.5 with 10% ortho -phosphoric acid and the flow rate was set at 0.5 ml min-1.
Method Development for UV and HPLC
Determination of λmax. A working sample solution (50
μg ml-1) in 0.1 N NaOH solution was prepared by suitable solvent addition, dilution and subsequently scanned with UV-Vis spectrophotometer in the range 400-200 nm against 0.1 N NaOH solution as blank.
Preparation of calibration curve for UV and HPLC. From the stock solution (100 μg ml-1) in 0.1 N NaOH, further dilutions were made to produce series concentrations such as 10 μg ml-1, 15 μg ml-1, 20 μg ml-1, 30 μg ml-1, 40 μg ml-1 and 50 μg ml-1, 60 μg ml-1 and 70 μg ml-1and the absorbance was noted at a wavelength of 215 nm. The construction of calibration curve showed a straight line with a coefficient of determination (r2) of 0.9981 for UV.
at 215 nm. The construction of calibration curve showed a straight line with a coefficient of determination (r2) of 0.9965 for HPLC.
Method Validation
Validation is a process of establishing documented evidence, which provides a high degree of assurance that a specific activity will consistently produce a desired result or product meeting its predetermined specifications and quality characteristics.
The proposed method was validation according to the ICH guidelines by UV and HPLC using parameters like Linearity, Accuracy, Precision, Robustness, Ruggedness, Limit of detection (LOD) and Limit of quantitation (LOQ) (ICH, Methodology, 19th May 1997, and ICH, Q2 (R1), Step. 4 2005).
Linearity
The linearity was tested for both UV and HPLC over the concentration range of 10, 15, 20, 30, 40 and 50 μg ml-1 and 20, 30, 40, 50, 60 and 70 μg ml-1, respectively for IBN. The calibration curve was constructed and evaluated by its coefficient of determination (r2). The calibration plot for UV (concentration of IBN versus Absorbance of IBN at 215 nm) and HPLC (concentration of IBN versus the Peak Area of IBN at 215 nm) was generated by replicate analysis (n = 6) at all concentration levels and a linear relationship was evaluated using the least square method by Microsoft Excel® program. For minimum error with precise, concise and accurate data, six different concentrations were being taken which gave a wide range of linearity. The coefficient of determination (r2) for IBN was 0.9981 for UV and 0.9965 for HPLC.
Accuracy
Accuracy of the method was determined by replicate analysis of three sets of samples spiked with three different levels of IBN at level 80%, 100% and 120% and comparing the difference between the spiked value (theoretical value) and that actually found value by both UV and HPLC methods.
Precision
The precision of the method based on within-day
repeatability was determined by replicate analysis of three sets of samples spiked with three different concentrations of IBN 10, 30 and 50 μg ml-1 for UV and 20, 40 and 70 μg ml-1 for HPLC, respectively. The reproducibility (day-to-day variation) of the method was validated using the same concentration range as described above, but only a single determination of each concentration was made in three different days by both the methods. Relative standard deviation (R.S.D.) was calculated from the ratios of standard deviation (S.D.) to the mean and expressed as percentage for both the methods.
Specificity
Specificity study was performed by analyzing standard solution in the presence of an excipient to find out is there any interference of excipients in %recovery of IBN. Amount of IBN was spiked with 50%, 100% and 150% of excipient (magnesium stearate) and the samples were analyzed for IBN recovery by UV-Vis spectrophotometer and HPLC.
Limit of Detection and Limit of Quantitation The limit of detection of an individual analytical procedure is the lowest amount of analyte in a sample which can be detected but not necessarily quantitated as an exact value. The limit of quantitation of an individual analytical procedure is the lowest amount of analyte in a sample which can be quantitatively determined with suitable precision and accuracy. The quantitation limit is a parameter of quantitative assays for low levels of compounds in sample matrices. A limit of detection (LOD) and a limit of quantitation (LOQ) were established based on the calibration curve parameters, according to the formula:
LOD = 3.3*S. D./Slope
LOQ = 10*S. D./Slope
absorbance maxima (λmax) for UV-Spectroscopy.
Statistical Analysis
ONE way ANOVA (Analysis of variance) was performed to compare the output parameters between UV and HPLC methods. Considering the two methods mutually exclusive, independent sample t-test was performed. First, F-test was carried out to characterize whether the output parameters had been evolved from the same population or not. If found from the same population (F-test p value > 0.05), Student’s t-test with equal variance was performed; otherwise Student’s t-test with unequal variance was executed. The result was considered significant if the result lies within 95% confidence interval (i.e.p < 0.05).
RESULT AND DISCUSSION
Determination of λmax and Retention Time
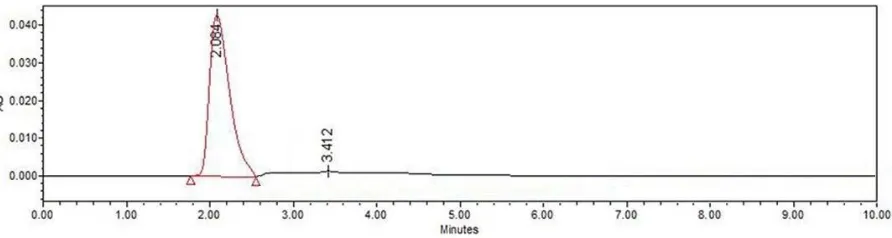
The λmax was found from UV scanning of the sample
solution and was exhibited as 215 nm (Fig. 2). Using this as detection wavelength, the retention time of the compound was found as 2.08 min (Fig. 3).
Calibration Curve
The correlation coefficient, r2, slope and intercept were estimated 0.9981, 0.0058 and 0.6173 by UV method and 0.9965, 1.298.8543 and 668173.0571 by HPLC with absorbance maxima set at 215 nm. Linear regression of data from the calibration curve indicated a linear response over the concentration range by both the methods. The curves can therefore be used for determination of Ibandronate sodium in pharmaceutical dosage form.
ANALYTICAL METHOD VALIDATION
Linearity
The coefficient of determination (r2) for IBN were 0.9981 and 0.9965, respectively for UV and HPLC methods
Fig. 3. Chromatogram of Ibandronate sodium.
Table 1a. Linear Regression Equations Generated from Validation of Ibandronate Sodium: Slope, Intercept and Coefficient of Determination for UV Spectrophotometry
Analyte
Ibandronate sodium
Conc. (µg ml-1)
Peak area (mV s)
10 0.681
15 0.701
20 0.734
Slope: 0.0058 Intercept: 0.6173 r2: 0.9981
30 0.787
40 50
0.851 0.911
Table 1b. Linear Regression Equations Generated from Validation of Ibandronate Sodium: Slope, Intercept and Coefficient of Determination for RP-HPLC
Analyte
Ibandronate sodium
Conc. (µg ml-1)
Peak area (mV s)
20 695753
30 705483
40 718597
Slope: 1298.8543 Intercept: 668173.0571 r2: 0.9965
50 734177
60 70
(Tables 1a and 1b)
Precision
The relative standard deviation was found to be < 2.0% for both UV and HPLC methods (Tables 3a and Table 3b). The interday and intraday precisions have been expressed as %RSD (Tables 4a, 4b, 5a and 5b).
Accuracy
The accuracy of both the methods was determined by preparing solutions of different concentrations that is 80%, 100% and 120% in which the amount of marketed formulation was kept constant (10 mg) and the amount of
pure drug was varied that is 8 mg, 10 mg and 12 mg for 80%, 100% and 120%, respectively. The solutions were prepared in triplicates and the accuracy was indicated by the %recovery (Tables 6a and 6b). The mean %recoveries of IBN were found to be in the range 99.6667-101.73 for UV and 99.87-101.0667% for HPLC. From the results, it can be concluded that the accuracy of determination has been well within the acceptable limit.
Specificity
Specificity study was performed by analyzing standard solution in the presence of an excipient (magnesium stearate). 10 mg each IBN was spiked with 50% (5 mg),
Table 2. Spectral and Statistical Data for Determination of Ibandronate Sodium by Proposed UV & RP-HPLC Method
Parameters Value for IBN in UV Value for IBN in HPLC
Absorption maxima, λmax (nm) 215 nm 215 nm
Linearity range (µg ml-1) 10-50 20-70
Coefficient of determination (r2) 0.9981 0.9965
Correlation coefficient (r) 0.9974 0.9982
Regression equation (Ya) y = 0.005x + 0.617 1,298.8543x + 668,173.0571
Slope (b) 0.0058 1298.8543
Intercept (a) 0.6173 668173.0571
Limit of detection, LOD (µg ml-1) 0.0303 0.0151
Limit of quantitation, LOQ (µg ml-1) 0.1 0.05
aY = mx + c, where x is the concentration (µg ml-1).
Table 3a. Repeatability of IBN by UV-Spectrophotometry
Analyte
Ibandronate sodium Conc.
(µg ml-1)
Conc. found at (µg ml-1)
Avg. (µg ml-1)
S.D. RSD
(%)a
30 28.22414
30 29.08621
30 28.74138
30 27.87931 28.39655 0.404346 1.423927
30 27.87931
30 28.22414
30 28.39655
30 28.74138
30 28.39655
a
Table 3b. Repeatability of IBN by RP-HPLC
Analyte
Ibandronate sodium Conc.
(µg ml-1)
Conc. found at (µg ml-1)
Avg. (µg ml-1)
S.D. RSD
(%)a
40 38.7279
40 38.9527
40 37.9441
40 38.7964 38.56283 0.375113 0.972733
40 38.8988
40 38.2829
40 38.8811
40 38.4754
40 38.1058
a
%RSD = SD/Mean*100.
Table 4a. Inter-Day (n = 3) Precision by UV-Spectrophotometry
Analyte
Ibandronate sodium Conc.
(µg ml-1)
Conc. found in (µg ml-1)
Avg. (µg ml-1)
S.D. RSD
(%)a
10 10.8103 10.63793
10 10.6379
10 10.4655
0.172414 1.620746
30 27.8793
30 28.2241
30 28.3966
28.16667 0.263366 0.935029
50 50.4655
50 50.2931
50 50.6379
50.46552 0.172414 0.341647
a
%RSD = SD/Mean*100.
Table 4b. Inter-Day (n = 3) Precision by RP-HPLC
Analyte
Ibandronate sodium Conc.
(µg ml-1)
Conc. found in (µg ml-1)
Avg. (µg ml-1)
S.D. RSD
(%)a
20 21.1817 21.23713
20 21.4157
20 21.1139
0.158354 0.745649
40 38.7279
40 38.9527
40 37.9441
38.54162 0.529476 1.373777
70 69.4912
70 68.5095
70 68.6720
68.89093 0.526159 0.763756
a
Table 5a. Intra-Day (n = 3) Precision by UV-Spectrophotometry
Analyte
Ibandronate sodium Conc.
(µg ml-1)
Conc. found in (µg ml-1)
Avg. (µg ml-1)
S.D. RSD
(%)
10 10.9827
10 11.1551
10 11.3275
11.15517 0.172414 1.545595
30 28.7413
30 27.8793
30 27.8793
28.16667 0.497716 1.767038
50 50.6379 50.46552 0.172414 0.341647
50 50.4655
50 50.2931
a
%RSD = SD/Mean*100.
Table 5b. Intra-Day (n = 3) Precision by RP-HPLC
Analyte
Ibandronate Sodium Conc.
(µg ml-1)
Conc. found in (µg ml-1)
Avg. (µg ml-1)
S.D. RSD
(%)
20 21.3326
20 21.2617
20 21.2971
21.29719 0.035416 0.166293
40 37.9441
40 38.2829
40 38.4754
38.23416 0.268954 0.70344
70 68.5095 68.89709 0.337387 0.489697
70 69.0562
70 69.1254
a
%RSD = SD/Mean*100.
Table 6a. Accuracy by UV-Spectrophotometry
Analyte Added
(%)
Constant amount
added (µg ml-1)a
Amount added (µg ml-1)b
Total amount
found (µg ml-1)c
Amount found (µg ml-1)d
Recovery (%)e
Average recovery
(%)
RSD (%)
IBN 80 5 4 9.05 4.05 101.25
(µg ml-1) 80 5 4 8.99 3.99 99.75
80 5 4 8.97 3.97 99.25
100.0833 1.0399
100 5 5 10.17 5.17 103.4
100 5 5 10.11 5.11 102.2
100 5 5 9.98 4.98 99.6
101.7333 1.6328
120 5 6 11.07 6.07 101.1667
120 5 6 10.89 5.89 98.16667
120 5 6 10.98 5.98 99.66667
99.66667 1.6402
a
Table 6b. Accuracy by RP-HPLC
Analyte Added
(%)
Constant amount
added (µg ml-1)a
Amount added (µg ml-1)b
Total amount
found (µg ml-1)c
Amount found (µg ml-1)d
Recovery (%)e Average recovery (%) RSD (%)
IBN 80 5 4 8.96 3.96 99
(µg ml-1) 80 5 4 8.97 3.97 99.25
80 5 4 9.05 4.05 101.25
99.8333 1.2352
100 5 5 10.12 5.12 102.4
100 5 5 9.96 4.96 99.2
100 5 5 10.08 5.08 101.6
101.0667 1.6477
120 5 6 11.11 6.11 101.8333
120 5 6 11.07 6.07 101.1667
120 5 6 10.96 5.96 99.3333
100.7778 1.2845
a
Preanalyzed sample found to be 3 µg ml-1. bPure drug added. cTotal concentration found i.e. c = a + b. dAmount found i.e. d = c - a. e%Recovery of ibandronate sodium = ibandronate sodium recovery (µg ml-1)/ ibandronate sodium input (µg ml-1)*100 OR d/b*100.
Table 7a. Specificity by UV-Spectrophotometry
Analyte Added
(%) Excipient amount added (mg) Conc. found (µg ml-1)a
Recovery (%)b
Avg. recovery
(%)
S.D. RSD
(%)
50 5 10.1 101
50 5 10.01 100.1
50 5 9.89 98.9
100 10 10.01 100.1
100 10 9.91 99.1
100 10 10.01 100.1
150 15 10.09 100.9
150 15 10.11 101.1
Ibandronate sodium (10 mg)
150 15 10.15 101.5
100.311 0.8978 0.895
a
The final dilution was made to 10 µg ml-1 and analyzed for %recovery. b%Recovery of ibandronate sodium = ibandronate sodium recovery (µg ml-1)/ibandronate sodium input (µg ml-1)*100.
Table 7b. Specificity by RP-HPLC
Analyte Added
(%) Excipient amount added (mg) Conc. found (µg ml-1)a
Recovery (%)b
Avg. recovery
(%)
S.D. RSD
(%)
50 5 9.96 99.6
50 5 9.89 98.9
50 5 10.05 100.5
100 10 10.11 101.1
100 10 10.07 100.7
100 10 10.09 100.9
150 15 10.13 101.3
150 15 10.16 101.6
Ibandronate sodium (10 mg)
150 15 10.15 101.5
100.678 0.901 0.895
a
Table 8. Determination of Robustness for Ibandronate Sodium by UV-Spectrophotometry
Sample I.D.
Analytical condition
IBN input (mg)
IBN Rec. (mg)
IBN Sod. Rec. (%)a
Mean Rec. IBN (%)
S.D. RSD
(%)
Solvent pH: 3.3 Ratio of solvent: 60:40 Set-1
Temperature: 18
10 9.89 98.9
Solvent pH: 3.3 Ratio of solvent: 60:40 Set-2
Temperature: 18
10 10.22 102.2
Solvent pH: 3.3 Ratio of solvent: 60:40 Set-3
Temperature: 18
10 9.85 98.5
Solvent pH: 3.3 Ratio of solvent: 60:40 Set4
Temperature: 18
10 10.2 102
Solvent pH: 3.3 Ratio of solvent: 60:40 Set-5
Temperature: 18
10 9.91 99.1
Solvent pH: 3.3 Ratio of solvent: 60:40 Set-6
Temperature: 18
10 10.11 101.1
100.3 1.66 1.655
a
%Recovery of ibandronate sodium = ibandronate sodium recovery (mg)/ibandronate sodium input (mg)*100.
Table 8. Determination of Robustness for Ibandronate Sodium by RP-HPLC
Sample I.D.
Analytical condition IBN input
(mg)
IBN Rec. (mg)
Ibandronate sodium Rec.
(%)a
Mean Rec. IBN (%)
S.D. RSD
(%)
Flow rate: 0.52 ml min-1 Mobile phase pH: 3.3 Mobile phase ratio: 60:40 Set-1
Column: C8 waters 10 9.98 99.8
Flow rate: 0.48 ml min-1 100.26
Mobile phase pH: 3.3 0.84 0.84
Mobile phase ratio: 60:40 Set-2
Column: C8 waters 10 10.1 101
Flow rate: 0.5 ml min-1 Mobile phase pH: 3.2 Mobile phase ratio: 60:40 Set-3
Column: C8 waters 10 10.02 100.2
Flow rate: 0.5 ml min-1 Mobile phase pH: 3.4 Mobile phase ratio: 60:40 Set-4
Column: C8 waters 10 10.12 101.2
Flow rate: 0.5 ml min-1 Mobile phase pH: 3.3 Mobile phase ratio: 58:42 Set-5
Column: C8 waters 10 9.89 98.9
Set-6 Flow rate: 0.5 ml min-1
Mobile phase pH: 3.3
Mobile phase ratio: 62:38 10 10.05 100.5
Column: C8 waters
a
100% (10 mg), and 150% (15 mg) of magnesium stearate and the samples were analyzed for IBN recovery by UV-Vis spectrophotometer and HPLC. Interference was found to be 98.9-101.5% of UV and 98.9-101.5% for HPLC, respectively which is again within the acceptable limit. Hence the excipients do not interfere with the estimation of drug. The detailed data has been provided in Tables 7a and 7b.
Limit of Detection and Limit of Quantitation The limit of quantification (LOQ) for IBN has been estimated as 0.1 µg for UV-Vis Spectrophotometer and 0.05 µg for HPLC (Table 2).
Determination of Assay Content
Ten tablets of IBN having brand name Boniva (150 mg) (Genetech, USA) were triturated and the powder was diluted to obtain a concentration of 50 μg ml-1 of IBN for further analysis in UV-Spectrophotometry (Fig. 4) and in HPLC (Fig. 5). The results have been summarized in Tables 9a and 9b for UV and HPLC.
Statistical Analysis
The UV and HPLC methods are compared based on output parameters such as repeatability, Interday and Intraday precession, accuracy, specificity and assay content. For all of the cases p-value obtained is greater than 0.05
Fig. 5. Chromatogram of ibandronate sodium tablet (Boniva) assay containing 50 µg ml-1 of ibandronate sodium.
Table 9a. Determination of %Assay for Ibandronate Sodium (Boniva) by UV-Spectroscopy
Trade name
Drug Label claim
mg/tablet
Conc. taken (mg)
Conc. estimated
(mg)
Mean conc. estimated
(mg)
%Assay (w/w) ± a
RSD (%)b
75 74.56
75 76.51
75 73.21
75 77.36
75 78.06
Boniva Ibandronate
sodium
150mg
75 74.48
75.6967 100.9288 1.8783
a
%Recovery of ibandronate sodium = ibandronate sodium recovery (mg)/ibandronate sodium input (mg) * 100 ± SD. b%RSD = SD/Mean*100.
Table 9b. Determination of %Assay for Ibandronate Sodium (Boniva) by RP-HPLC
Trade name
Drug Label claim
mg/tablet
Conc. taken (mg)
Conc. estimated
(mg)
Mean conc. estimated
(mg)
%Assay (w/w) ± a
RSD (%)b
75 75.36
75 76.07
75 74.48
75 76.89
75 74.89
Boniva Ibandronate
sodium
150 mg
75 77.01
75.7833 101.0444 1.3823
a
Table 10. System Suitability Parameters for Ibandronate Sodium by HPLC
S. No. Parameters Ibandronate sodium
(min)
1 Retention time, Rt (min) 2.089
2 Theoretical plates (USP) 1649.7
3 HETP (mm) 0.09
4 Capacity factor (k) 1.611
Table 11. Statistical Analysis of the UV & RP-HPLC Methods
Name of the measured parameter
UV HPLC p-value by
F-test
p-value by Student’s t-test
Average (mg)
Stdev. (±)
Average (mg)
Stdev. (±) Repeatability (Difference
between theoretical and
measured concentration) 1.603 0.0404 1.437 0.375
0.837 0.379
Inter day precision (Difference between theoretical and measured concentration)
0.979 0.670 1.268 0.411 0.094 0.286
Intra day precision (Difference between theoretical and measured concentration)
1.151 0.654 1.389 0.366 0.060 0.356
Accuracy (%Recovery) 100.494 1.635 100.559 1.343 0.296 0.928
Specificity (%Recovery)
100.311 0.898 100.677 0.901 0.496 0.400
%Assay (Amount found out of 75.00 mg)
(Table 10) which indicates there is no significant difference between output parameters of UV and HPLC methods.
CONCLUSIONS
Linearity was determined at different concentration IBN shows linearity in the concentration range of 10-50 μg ml-1 and 20-70 μg ml-1 of UV and HPLC, respectively. The percent recovery of the drug was within the rage 95-105% for UV and HPLC which indicates the method accuracy. The %RSD values for precision were < 2.0% for both the methods. Both the methods showed a positive response to all validation parameters. The result of the marketed formulation (Boniva) was found to be within 100.42 ± 0.03% for both UV and HPLC. The above proposed both the methods were found to be simple, rapid and sensitive. Also, the statistical analysis unraveled no significant difference between these two High Throughput Screening Methods that means both these methods are equally comparable to extract satisfactory output from the proposed drug estimation procedure. Therefore, validated UV spectrophotometric and HPLC method will play an important role for the determination of Ibandronate sodium in pharmaceutical dosage form.
ACKNOWLEDGEMENTS
The authors are grateful to Natco Pharmaceutical, Hyderabad, India for providing gift samples of Ibandronate sodium (IBN) and towards the management for providing
the necessary chemicals and an instrument for the study.
REFERENCES
[1] F. Bauss, S. Lalla, R. Endele, LA. Hothorn, J.
Rheumatol. 29 (2002) 2200.
[2] F. Bauss, R.R. Graham, Osteoporos Int. 15 (2004) 423.
[3] M.J. Lovdahl, D.J. Pietrzyk, J. Chromatogr. A. 868 (2000) 141.
[4] H. My, Z. Xq, W. Bc, S. Pu, 18 (2000) 18.
[5] J.A.B. Rodriguez, M.F. Desimone, S.L. Iglesias, S.L.
Giorgieri, L.E. Diaz, J. Pharm. Biomed. Anal. 44 (2007) 305.
[6] Y. Xie, Z. Jiang, Chromatogr. 62 (2005) 257.
[7] M. Narendra Kumar, K.S.R. Pavan Kumar, V.
Jagadeesh Kumar, S. John Prasanna, H. Kumar Sharma, V. Krishna Reddy, J. Pharm. Biomed. Anal. 54 (2011) 596.
[8] B. Jineet Kumar Gawad, S. Pritam Jain, Int. J.
Innovative Pharmaceutical Res. 3 (2012) 220. [9] B. Jineet Kumar Gawad, S. Pritam Jain, B. Sanjay
Bari, Int. J. Chem. Tech. Res. 5 (2013) 1733.
[10] ICH: Guideline on the Validation of Analytical
Procedures: Methodology, 62 (96), 19th May 1997.
[11] International Conference on Harmonization of
Technical Requirements for Registration of