Study on Financial Awareness of Households With
Reference to Financial Products and Holding
Dr. Sweety Shah
Asst. Professor, L.J. Institute of Mgmt Studies Ahmedabad, Gujarat (India) sweety_pdubey@yahoo.co.in
Abstract: Financial literacy helps people develop the skill required to make informed decisions that improves their financial well-being. Hence, it involves an efficient and effective allocation of one’s income and other resources, such that the needs, wants and desires of the individual are fulfilled. The aim of this research was to know the practices of households for selection of financial products and services and to analyze the awareness of financial products among the households with respect to the different socio economic indicators. Based on empirical analysis, it was found that households prefer product information followed by best buy guidance from experts and general advice while investing in financial products. The demographic factor education has impact on financial awareness and practices used for financial product information. Further it was found that most of the households are aware about the different financial products but holding pattern found that holding in complex financial assets is dependent on gender and education but investment in tradition financial assets or products does not have any association with these two factors.
Key Words: financial literacy, financial products, financial well-being.
1. INTRODUCTION
mere access to the affordable delivery of various financial products and services. This is where financial literacy and awareness of various financial products, services and institutions can play a crucial path breaking role.
The definition given by the Presidents’ Advisory Council on Financial Literacy (PACFL) Financial education is the process by which people improve their understanding of financial products, services and concepts, so they are empowered to make informed choices, avoid pitfalls, know where to go for help and take other actions to improve their present and long-term financial well-being [1]. Financial literacy education helps people develop the skill required to make informed choices and to take action that improves their financial well-being [2].
each-other can help households diversify risk effectively. Having financial literacy skills is an essential basis for both avoiding and solving financial problems which in turn are vital to living prosperous life.
Poor savings and investment decisions may be less visible, but carry serious implications for long-term financial security for major parts of population. Research in behavioral finance suggests that many households do not in fact make optimal savings and investment decisions, and the realization that these choices may well lead to unacceptable standards of living has also increased economic anxiety. Recent evidence suggests an underlying, more fundamental problem that has heightened such concerns: large segments of the populations have low levels of financial literacy. The less financially literate may be more likely to unknowingly commit financial mistakes, less likely to engage in recommended financial practices, and less likely to be able to cope with sudden economic shocks.
2. LITERATURE REVIEW
The information about the financial products and services and the ability to decipher and using information in decision making becomes more essential as they persist to grow and as new delivery channels for financial services develop [3]. As market forces continue to expand the range of providers of financial services, consumers will have much more choice and flexibility in how they manage their financial matters. They will also need to accumulate the appropriate knowledge on how to use new technologies and on how to make financial decisions in an informed manner [4].
As liberalization and new technology have created new financial products and services widely available, much of the households remains ill equipped to make informed financial decisions or can evaluate complex financial products [8]. The cognitive components of financial literacy that includes knowledge of the individual, education and ability of making decisions related to banking, credit, insurance, investments and taxes along with the basic conceptual knowledge of interest rates, time value of money and risk association [9].
In article ‘Financial literacy and its role in promoting a sound financial system’, state that “for some, financial literacy is a wide-ranging concept, incorporating an understanding of economics and how household decisions are affected by economic conditions and circumstances while for others, it means focusing quite narrowly on basic money management skills – budgets, savings, investment, insurance” [10].
Financial literacy at young age has always been given prime importance by so many researches and many of the studies are conducted to check the financial literacy of the students studying in colleges. To know the opinion of students on financial matters and examine the relationship between literacy and student characteristics, the study of personal finance literacy was conducted among 924 students at 14 colleges. They study was conducted. They found that the students with non-business major, female, lower work experience and age below 30 had poor knowledge of personal finance and financial products [11]. In University of Australia, same kind of study was conducted across five faculties. The students were tested five main skills of household finance like basic concepts, markets and financial markets, planning, analysis and decision making, insurance. In this study total ten independent variables were taken into consideration to know the financial literacy level of the students. The study analysed that male students, having work experience, higher income had higher financial literacy level but entire survey concluded that university students were not knowledgeable in financial matters. This would impact on their future household finance management [12].
of the financial services and financial products is low due to limited financial literacy and education [13]. One more experimental study was undertaken to identify impact of financial literacy on three distinct dimension of financial knowledge; (i) numeracy skills, (ii) basic financial awareness and (iii) attitude towards financial decisions. For the study they surveyed 1200 urban households in Ahmedabad city of Gujarat, India. The findings suggest that financial education has limited impact on financial numeracy. However study concludes that financial education and literacy creates awareness and change the attitude of households towards financial products [14].
Education of the households has effect on financial behavior of people and it does have significant impact on financial market participation higher or smaller [15]. The cognitive abilities developed by financial education increased financial participation, attitude, borrowing behavior and risk aversion. Factors such as lack of income or wealth may restrict ability to gain valuable market experience. It is important to consider the value of employment to financial literacy and financial behaviour. Significant causes of financial exclusion included unemployment and lack of personal and household income among other things [16]. High income provides greater levels of disposable income which can be allocated to saving, investing and other optimal financial activities.
Many researchers have been developed to find the impact of gender factor on financial literacy, personal finance decisions and investment planning; as men and women act differently with financial decisions [17]. The women are more risk averse than men as they protect their capital while making financial decisions. Female investors are more holistic in their investment decisions and consider all the relevant factors like they are detail oriented and want to read and know more about the financial decisions [18] whereas men are more overconfident in their investment decisions than women, they trade with high numbers and frequency but earn less returns [19]. Apart from the financial and psychological studies there are some theories which focus on the social aspects of the female gender which makes them conservative adaptionist and more averse to uncertain situation [20].
the gender differences in choice of investments and found that both men and women invest in asset class those were risky but the portion of investment in risky assets was smaller of women than men counterparts.
3. RESEARCH METHODOLOGY
On the basis of review of literature the present study has been planned with the following objectives: 1. To know the practices adopted by households for selection of financial products and services.
2. To analyze the awareness of different financial products among the households in relation to the different socio-economic indicators.
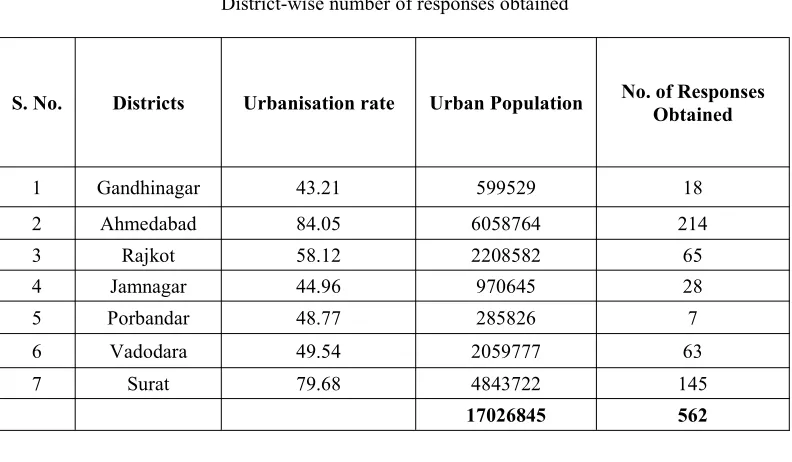
The sample has been taken from the districts of Gujarat having urbanization rate higher than Gujarat’s average urban ratio 42.58%. The study has been conducted in the seven districts based on their urbanisation rate, Ahmedabad (84%), Surat (79%), Rajkot (58%), Vadodara (49%), Porbandar (48%), Jamnagar (45%) and Gandhinagar (43%), all had higher urbanization rate than Gujarat as per Economic Census Survey- 2011. To conduct the survey, Proportionated Stratified Random Sampling Design was adopted for sample size of 562 respondents.
Table 1
District-wise number of responses obtained
S. No. Districts Urbanisation rate Urban Population No. of ResponsesObtained
1 Gandhinagar 43.21 599529 18
2 Ahmedabad 84.05 6058764 214
3 Rajkot 58.12 2208582 65
4 Jamnagar 44.96 970645 28
5 Porbandar 48.77 285826 7
6 Vadodara 49.54 2059777 63
7 Surat 79.68 4843722 145
17026845 562
4. DATA ANALYSIS
platform of financial market, the need of financial literacy and awareness has been arisen (Atkinson and Flore-Anne Messy, 2009)[21]. For financial awareness, respondents were asked about their practices for selection of the financial product or services.
4.1 Practices for selection of financial product or services
Table 2 Sources of information
Sources Count Percent (%)
Product information 286 51%
Best buy guidance 124 22%
General advice 110 19%
Media coverage 38 7%
Advertisements 4 1%
(Source: Sample Survey)
From table 4.1, it is evident that more than 51 percent of respondents try to collect all the information about financial product before they invest in the same. Out of all 22 percent take best buy guidance from financial experts, 20 percent just follow general advice of people around them and only 8 percent take decisions based on media coverage and advertisement. It can be concluded that household believe to find accurate information of complex products and even take the help of professionals for selection.
4.1.1 Association between Gender and practices of financial product selection
To identify the practices of financial product selection of male and female, One Way Analysis of Variance (ANOVA) has been applied.
H0:There is no association between the source of information and gender
H1:There is association between the source of information and gender
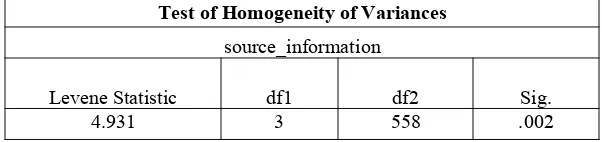
As the assumption of Levene's equality is violated (Appendix table 1) Welch ANOVA test has been applied to check association.
Table 3 Welch ANOVA
Robust Tests of Equality of Means Source of information
Statistic df1 df2 Sig.
As per Welch Robust ANOVA (F (1,403.471) = 0.089, p= 0.765) so null hypothesis is accepted at 5 percent level of significance and there is no association between the source of information and male and female. So both male and female follow equal practices for product awareness.
4.1.2 Association between Education and practices of financial product selection
To identify association the practices of financial product selection and formal education, One Way Analysis of Variance (ANOVA) has been applied.
H0:There is no association between the source of information and education
H1:There is association between the source of information and education
As the assumption of Levene's equality is violated (Appendix table 2) Welch ANOVA test has been applied to check association.
Table 4 Welch ANOVA
Robust Tests of Equality of Means Source of information
Statistic df1 df2 Sig.
Welch 12.427 3 55.027 .000
As per Welch Robust ANOVA (F (3, 55.027) = 12.427, p= 0.000); null hypothesis is rejected at 5 percent level of significance and there is association between the practice of information and education. Furthermore, the Gomes-Howell Post hoc testing revealed that there is marginal difference among undergraduate (1.41 ± 0.996, p=0.023) and graduates (0.93 ± 1.039) but significant difference with post graduates (0.56 ± 0.858).
4.2 Financial Product awareness and holding
Following table represent the data of different financial product awareness and holding in households of Gujarat.
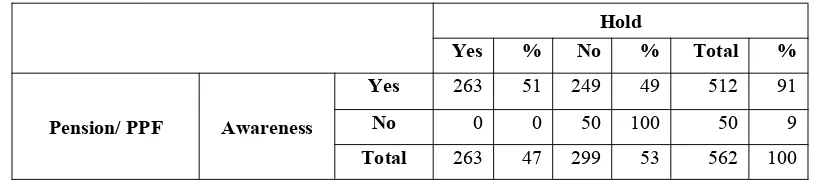
Table 5
Product awareness and holding
Hold
Yes % No % Total %
Pension/ PPF Awareness
Yes 263 51 249 49 512 91
No 0 0 50 100 50 9
Mutual Fund Awareness
Yes 265 52 241 48 506 90
No 0 0 56 100 56 10
Total 263 47 297 53 562 100
Home loan Awareness
Yes 149 29 357 71 506 90
No 0 0 56 100 56 10
Total 149 27 413 73 562 100
Secured loan Awareness
Yes 89 20 349 80 438 78
No 0 0 124 100 124 22
Total 89 16 473 84 562 100
Fixed Deposit Awareness
Yes 390 71 160 29 550 98
No 0 0 12 100 12 2
Total 390 69 172 31 562 100
Credit card Awareness
Yes 336 66 172 34 508 90
No 0 0 54 100 54 10
Total 336 60 226 40 562 100
Saving account Awareness
Yes 562 100 0 0 562 100
No 0 0 0 0 0 0
Total 562 100 0 0 562 100
Insurance Awareness
Yes 472 87 72 13 544 97
No 0 0 18 100 18 3
Total 472 84 90 16 562 100
Share/ stock Awareness
Yes 283 57 211 43 494 88
No 0 0 68 100 68 12
Total 283 50 279 50 562 100
Bond/ Debenture Awareness
Yes 107 28 269 72 376 67
No 0 0 186 100 186 33
From the table 5, it is evident that household in Gujarat are mostly aware about different financial products. Financial product like saving accounts, 100 percent are aware and each household hold at least one saving account. Total 98 percent respondents are aware about the Fixed deposit which is secured investment avenue and out of that 71 percent hold this asset followed by 97 percent respondent are aware about Insurance products used for personal risk management and 71 percent hold insurance policy. More than 90 percent households are aware about the Public Provident Fund (PPF) which is secured saving avenue and Mutual fund which is also saving instrument but risky investment, the holding of these two small saving investments are 50 percent and 51 percent respectively. Credit card a consumer credit financial product for short term borrowing; 90 percent are aware and 66 percent hold credit card same way in long term finances 90 percent of them were aware about home/mortgage loan but 29 percent only hold it and study has also found that 88 percent of respondents are aware about capital market investment which is the most speculative investment and 57 percent invest in these products. Secured loans offered by banks and financial Institutes only 78 percent knew about these finances and 20 percent of them hold them. The lowest awareness 67 percent is found for the debt instruments like bond and debenture and out of that 28 percent invest in it.
4.3 Impact of different demographic factors on financial products’ holding
Gender, Education and Household income are considered as important demographic factors for holding of financial products. To analyse the impact of these factors on holding of financial assets, chi-square test has been applied.
4.3.1 Gender and holding of different financial products
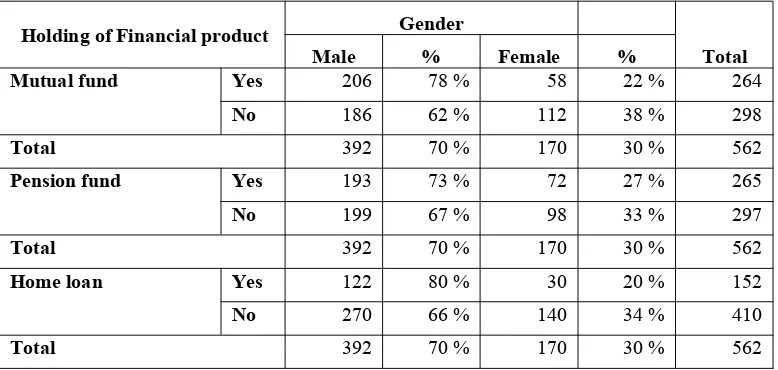
Table 6
Gender wise holding of different financial products
Holding of Financial product Gender
Total
Male % Female %
Mutual fund Yes 206 78 % 58 22 % 264
No 186 62 % 112 38 % 298
Total 392 70 % 170 30 % 562
Pension fund Yes 193 73 % 72 27 % 265
No 199 67 % 98 33 % 297
Total 392 70 % 170 30 % 562
Home loan Yes 122 80 % 30 20 % 152
No 270 66 % 140 34 % 410
Secured loan Yes 75 82 % 16 18 % 91
No 317 67 % 154 33 % 471
Total 392 70 % 170 30 % 562
Fixed Deposits Yes 262 66 % 134 34 % 396
No 130 78 % 36 22 % 166
Total 392 70 % 170 30 % 562
Credit Card Yes 228 68 % 109 32 % 337
No 164 73 % 61 27 % 225
Total 392 70 % 170 30 % 562
Saving Account Yes 380 70 % 162 30 % 542
No 12 60 % 8 40 % 20
Total 392 70 % 170 30 % 562
Insurance Yes 331 70 % 142 30 % 473
No 61 69 % 28 31 % 89
Total 392 70 % 170 30 % 562
Share stock Yes 195 68 % 92 32 % 287
No 197 72 % 78 28 % 275
Total 392 70 % 170 30 % 562
Bond/ Debenture Yes 78 71 % 33 30 % 110
No 314 70 % 137 30 % 451
Total 392 70 % 170 30 % 562
(Source: Sample Survey)
H0:Gender and holding of financial asset are statistically independent.
H1:Gender and holding of financial asset are statistically dependent.
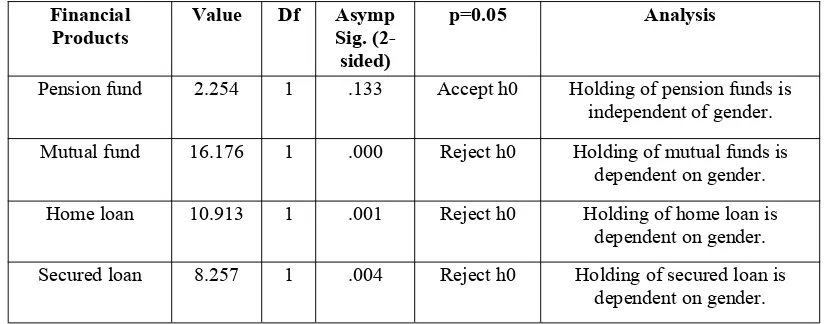
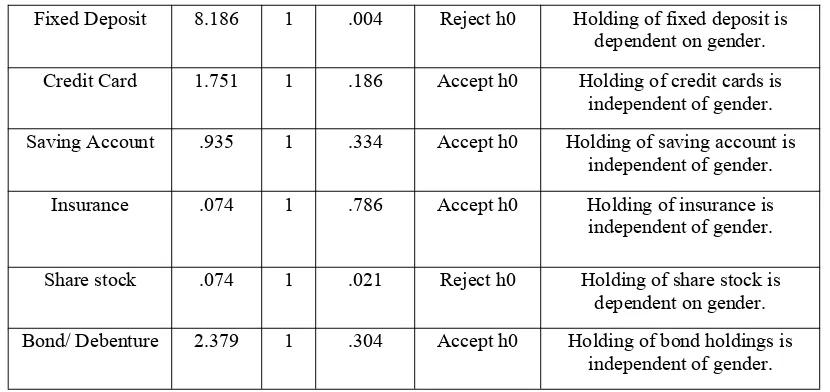
Table 7
Chi- Square Test (Gender and Holding of Financial Assets)
Financial
Products Value Df AsympSig. (2-sided)
p=0.05 Analysis
Pension fund 2.254 1 .133 Accept h0 Holding of pension funds is independent of gender. Mutual fund 16.176 1 .000 Reject h0 Holding of mutual funds is
dependent on gender. Home loan 10.913 1 .001 Reject h0 Holding of home loan is
dependent on gender. Secured loan 8.257 1 .004 Reject h0 Holding of secured loan is
Fixed Deposit 8.186 1 .004 Reject h0 Holding of fixed deposit is dependent on gender. Credit Card 1.751 1 .186 Accept h0 Holding of credit cards is
independent of gender. Saving Account .935 1 .334 Accept h0 Holding of saving account is
independent of gender. Insurance .074 1 .786 Accept h0 Holding of insurance is independent of gender.
Share stock .074 1 .021 Reject h0 Holding of share stock is dependent on gender. Bond/ Debenture 2.379 1 .304 Accept h0 Holding of bond holdings is
independent of gender.
Study found (table 7) that holding in financial assets like Mutual fund, Home loan, Secured loan, Fixed deposits and Capital market shares and stocks (p<0.05) are dependent on gender and male and female differ in holding these financial products. Holding in assets like Pension funds, Credit cards, Saving accounts, Insurance and Debenture/bonds (p>0.05) are independent of gender and no significant difference is between male and female.
4.3.2 Household Income and holding of different financial products
Table 8
Household Income wise holding of different financial products
Holding of Financial
Product
Household Income
Total upt
o
1L % 1L-5L % 10L5L- % 10L-15L % 15L-20L % 20L-50L % Pension
fund YesNo 169 53 176114 5943 7589 2830 388 143 152 16 146 25 265297
Total 25 4 290 52 164 29 46 8 17 3 20 4 562
Mutual
fund YesNo 1015 63 109181 4161 8579 3227 2224 79 134 15 182 17 264298
Total 25 4 290 52 164 29 46 8 17 3 20 4 562
Home
loan NoYes 196 45 22070 4654 11747 3129 406 104 134 19 1010 27 152410
Total 25 4 290 52 164 29 46 8 17 3 20 4 562
Secured
loan YesNo 187 48 24743 5247 14321 3023 3610 118 170 04 10 1110 2 47191
Fixed
Deposit YesNo 1510 64 100190 6048 12044 3027 406 104 152 14 164 24 396166
Total 25 4 290 52 164 29 46 8 17 3 20 4 562
Credit
card YesNo 187 82 142148 6344 10757 3225 388 114 170 05 200 06 337225
Total 25 4 290 52 164 29 46 8 17 3 20 4 562
Saving
account YesNo 250 50 2828 5240 1604 3020 424 208 134 202 200 04 54220
Total 25 4 290 52 164 29 46 8 17 3 20 4 562
Insuran
ce YesNo 178 49 23555 5062 14222 3025 442 29 170 04 182 24 47389
Total 25 4 290 52 164 29 46 8 17 3 20 4 562
Share
Stock NoYes 1510 54 141149 4954 8678 3028 2422 98 134 15 1010 43 287275
Total 25 4 290 52 164 29 46 8 17 3 20 4 562
Bond/ Debent ure
Yes 3 3 35 32 39 35 15 14 11 10 8 7 110
No 22 5 255 57 125 28 31 7 6 1 12 3 451
Total 25 4 290 52 164 29 46 8 17 3 20 4 562
H0:Household income and holding of financial asset are statistically independent.
H1:Household income and holding of financial asset are statistically dependent.
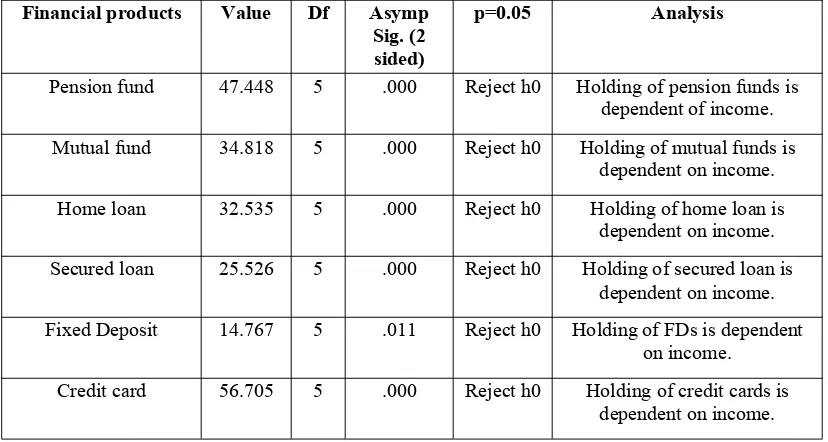
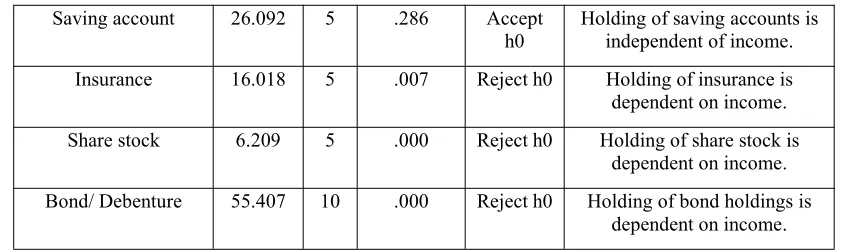
Table 9
Chi- Square Test (Household Income and Holding of Financial Assets)
Financial products Value Df Asymp Sig. (2 sided)
p=0.05 Analysis
Pension fund 47.448 5 .000 Reject h0 Holding of pension funds is dependent of income. Mutual fund 34.818 5 .000 Reject h0 Holding of mutual funds is
dependent on income. Home loan 32.535 5 .000 Reject h0 Holding of home loan is
dependent on income. Secured loan 25.526 5 .000 Reject h0 Holding of secured loan is
dependent on income. Fixed Deposit 14.767 5 .011 Reject h0 Holding of FDs is dependent
on income. Credit card 56.705 5 .000 Reject h0 Holding of credit cards is
The study found that holding of only one financial asset saving accounts (chi square= 26.092. p>0.05) was independent of Income there is no difference in different income groups for holding it so irrespective of income level all the households hold at-least one saving account. For rest all financial assets (p<0.05) so null hypothesis cannot be rejected and holding of all these assets depend on household income and it can be inferred that households invest in all these traditional and risky assets as per their level of household income.
4.3.2 Education and holding of different financial products
Table 10
Education wise holding of different financial products
Holding of Financial Products
Education
Total Unde
rgrad
uate % Graduate % aduatePostgr % Ph.d. %
Pension fund Yes 18 7 124 47 114 43 9 3 265
No 26 9 165 56 100 34 6 2 297
Total 44 8 289 51 214 38 15 3 562
Mutual fund Yes 14 5 123 47 118 45 9 3 264
No 30 10 166 56 96 32 6 2 298
Total 44 8 289 51 214 38 15 3 562
Home loan Yes 6 4 74 49 66 43 6 4 152
No 38 9 215 52 148 36 9 2 410
Total 44 8 289 51 214 38 15 3 562
Secured loan Yes 8 9 44 48 32 35 7 8 91
No 36 8 245 52 182 39 8 2 471
Total 44 8 289 51 214 38 15 3 562
Fixed
Deposits YesNo 3212 87 20584 5251 14668 3741 132 13 396166
Total 44 8 289 51 214 38 15 3 562
Saving account 26.092 5 .286 Accept
h0 Holding of saving accounts isindependent of income. Insurance 16.018 5 .007 Reject h0 Holding of insurance is
dependent on income. Share stock 6.209 5 .000 Reject h0 Holding of share stock is
dependent on income. Bond/ Debenture 55.407 10 .000 Reject h0 Holding of bond holdings is
Credit card Yes 18 5 154 46 152 45 13 4 337
No 26 12 135 60 62 28 2 1 225
Total 44 8 289 51 214 38 15 3 562
Saving
account YesNo 440 80 27910 5150 20410 3850 150 03 54220
Total 44 8 289 51 214 38 15 3 562
Insurance Yes 38 8 236 50 186 39 13 3 473
No 6 7 53 60 28 31 2 2 89
Total 44 8 289 51 214 38 15 3 562
Share stock Yes 18 6 149 52 110 38 10 3 287
No 26 9 140 51 104 38 5 2 275
Total 44 8 289 51 214 38 15 3 562
Bond/
Debenture YesNo 422 29 24445 5441 15856 5135 87 26 110451
Total 44 8 289 51 214 38 15 3 562
H0:Education and holding of financial asset are statistically independent.
H1:Education and holding of financial asset are statistically dependent.
Table 11
Chi- Square Test (Education and Holding of Financial Assets)
Value Df Asymp. Sig. (2-sided)
p=0.05 Analysis
Pension fund 6.988 3 .072 Accept h0 Holding of pension funds is independent of education. Mutual fund 13.069 3 .004 Reject h0 Holding of mutual funds is
dependent on education. Home loan 7.152 3 .067 Accept h0 Holding of home loan is independent of education Secured loan 10.835 3 .013 Reject h0 Holding of secured loan is
dependent on education. Fixed Deposit 2.547 3 .467 Accept h0 Holding of FDs is independent
of education Credit card 27.388 3 .000 Reject h0 Holding of credit cards is
dependent on education. Saving account 2.959 3 .398 Accept h0 Holding of saving accounts is
independent of education. Insurance 2.805 3 .423 Accept h0 Holding of insurance is
independent of education Share stock 3.315 3 .034 Reject h0 Holding of share stock is dependent on education. Bond/ Debenture 23.017 6 .001 Reject h0 Holding of bond is dependent
Study found (table 11) that holding in financial assets like Pension fund, Home loan, Fixed Deposit, Saving accounts, Insurance (p>0.05) were independent of education so there was no difference between different education categories for holding these products whereas holding of financial assets like Mutual fund, Secured loan, Credit cards, Capital market shares and stocks and bond/ debenture (p<0.05) were dependent on education and respondents of different education category differed in holding such financial assets which are complex in nature and require analytical skills for holding them and gaining return out of them.
5. CONCLUSION
The present study aims at finding out the financial awareness and holding of them along with the sources used by the households to take informed financial decisions. The study was based in seven districts of Gujarat and study found that for investment and purchase of financial products, 51 percent households prefer product information followed by best buy guidance from experts and general advice. The demographic factor education has impact on financial awareness but male and female follow equal practices for financial product awareness so gender does not have any impact practices used for financial product information.
Households’ financial literacy for different financial products and their current holding, found that 100 percent were aware and hold at least one saving account. 98 percent were aware about fixed deposits and 71 percent hold it as it is secured investment. More than 90 percent know about public provident fund, mutual funds, credit cards, home mortgage loans but only 72 percent were aware about secured bank loans and lowest awareness 67 percent was found for the debt instruments like bond and debenture. In holding pattern also only 28 percent invest in debt instruments but 57 percent respondents invest in speculative capital market investments. It was found that holding in complex financial assets is dependent on gender and education but investment in tradition financial assets or products does not have any association with these two factors.
REFERENCES
[1] Arnone, Bill. “Selling the Value of Employee Financial Education to Management.” In Conference proceedings; Personal Finance Employee Education Conference. Virginia Tech, Roanoke, Virginia (1999).
[2] Barber, Brad, and Terrance, Odean. “The Courage of Misguided Convictions.” Financial Analysts Journal, November/December,(1999): 41-56.
[4] Brown, Kery, Gallery, Natalie., and Gerry, Gallery. “Informed superannuation choice: constraints and policy resolutions”, Economic Analysis and Policy,32, no.1,(2004): 71–90.
5] Brown, Sarah, Garino, Gaia., Taylor, Karl, and Stephen, Price. “Debt and Financial Expectation: An Individual and Household level Analysis.”Economic Inquiry,43, no.1, (2005): 100-120.
[6] Carpena, Fenella, Cole, Shawn, Shapiro, Jeremy, and Bilal, Zia. “Liability Structure in Small-Scale Finance: Evidence from a Natural Experiment”. Working Paper No.13-018. (August, 2012).
7] Chen, Haiyang, and Volpe, Ronald. “Gender Differences in Personal Financial Literacy among College Students.”Financial Services Review,11, no.3, (2002): 289-307.
[8] Cole, Shawn, Sampson, Thomas, and Bilal, Zia. “Financial Literacy, Financial Decisions, and the Demand for Financial Services: Evidence from India and Indonesia.” Working Paper 09-117. Harvard Business School. (2009).
[9] Cole, Shawn., Paulson, Anna, and Shastry, Gauri. “Smart Money: The Effect of Education on Financial Behavior”. Working Paper no. 09-071. (April 2012).
[10] Edward, Smith, Graham, Judy, and Mary, O’Reily. “The impact of gender on the personal financial planning process: Should financial advisors tailor their process to the gender of the client?”,Humanomics, Emerald,22, no. 4, (2006): 223-238. doi:10.1108/08288660610710746
[11] Greenspan, Alan. “Financial Literacy: a Tool for Economic Progress,”The Futurist,July-August, (2002): 37-41.
[12] Hibbert, Marie, Lawrence, Edward, and Arun, Prakash. “Are Women More Risk-Averse Than Men?”, Working Paper (2008).
[13] Hogarth, Jeanne, and Marianne, Hilgert. “Financial Knowledge, Experience and Learning Preferences: Preliminary Results from a New Survey on Financial Literacy.”Consumer Interest Annual,no.48, (2002): 1-7.
[14] Hogarth, Jeanne, Beverly, Sondra., and Marriane, Hilgert. “Patterns of Financial Behaviors: Implications for Community Educators and Policy Makers.” InFederal Reserve System Community Affairs Research Conference. (2003).
[15] Johnston, Robert, and Vasudevan, Sundararajan, Sequencing Financial Sector Reforms: Country Experiences and Issues. Washington, DC: International Monetary Fund. (1999).
[16] Lusardi, Annamaria, and Olivia, Michell. “Financial literacy and planning, implications for retirement well-being”. (Working Paper No.1) (2006).
17] Olsen, Robert, and Constance, Cox. “The Influence of Gender on the Perception and Response to investment risk: The case of professional investors.”Journal of Behavioral finance,2, no.1, (2001): 29-36.
[18] PACFL, USA.President's Advisory Council on Financial Literacy, 2008. Annual Report to the President. (2008).
[19] Ryan, Andrea, Trumbull, Gunnar, and Peter, Tufano. “A Brief Postwar History of U.S. Consumer Finance”, Business History Review,85, no.3 (2011):461–498.
[20] Volpe, Ronald, Chen, Haiyang, and Joseph, Pavlicko. “Personal Investment Literacy among College Students: A Survey.” Financial Practice and Education,6, no.2,(1996): 86-94.
[21] Atkinson, A. and F. Messy (2012), “Measuring Financial Literacy: Results of the OECD / International Network on Financial Education (INFE) Pilot Study”, OECD Working Papers on Finance, Insurance and Private Pensions, No. 15, OECD Publishing. http://dx.doi.org/10.1787/5k9csfs90fr4-en
APPENDICES
Table 1
Levene's Test for Equality of Variances for Practices for selection of financial product or services and gender
Test of Homogeneity of Variances source_information
Levene Statistic df1 df2 Sig.
16.394 1 560 .000
Table 2
Levene's Test for Equality of Variances for Practices for selection of financial product or services and formal education
Test of Homogeneity of Variances source_information
Levene Statistic df1 df2 Sig.